Quasistatic electric-field-modulated optical pattern transition in a thin nematic
liquid-crystal film with a single feedback mirror
Hsu-Kuan Hsu, Yinchieh Lai, and Shu-Hsia Chen
Citation: Applied Physics Letters 85, 2724 (2004); doi: 10.1063/1.1795363 View online: http://dx.doi.org/10.1063/1.1795363
View Table of Contents: http://scitation.aip.org/content/aip/journal/apl/85/14?ver=pdfcov
Published by the AIP Publishing
Articles you may be interested in
Submillisecond response nematic liquid crystal modulators using dual fringe field switching in a vertically aligned cell
Appl. Phys. Lett. 92, 111101 (2008); 10.1063/1.2896650
Electro-optic modulation using single-crystal film of an organic molecular salt in a Fabry-Perot cavity
Appl. Phys. Lett. 87, 191111 (2005); 10.1063/1.2130394
In-fiber nematic liquid crystal optical modulator based on in-plane switching with microsecond response time
Appl. Phys. Lett. 81, 5243 (2002); 10.1063/1.1532532
Frequency modulation response of a liquid-crystal electro-optic device doped with nanoparticles
Appl. Phys. Lett. 81, 2845 (2002); 10.1063/1.1511282
Interdependence of the electrical and optical properties of liquid crystals for phase modulation applications
J. Appl. Phys. 87, 4069 (2000); 10.1063/1.373032
This article is copyrighted as indicated in the article. Reuse of AIP content is subject to the terms at: http://scitation.aip.org/termsconditions. Downloaded to IP: 140.113.38.11 On: Thu, 01 May 2014 04:10:32
Quasistatic electric-field-modulated optical pattern transition in a thin
nematic liquid-crystal film with a single feedback mirror
Hsu-Kuan Hsu,a)Yinchieh Lai, and Shu-Hsia Chen
Institute of Electro-Optical Engineering, National Chiao Tung University, 1001 Ta Hsueh Road, Hsinchu 300, Taiwan, Republic of China
(Received 30 October 2003; accepted 19 July 2004)
We present here the pattern formation in the transverse profile of a continuous-wave laser beam passing through a parallel planar-aligned nematic liquid crystal(NLC) film biased by a quasistatic electric field and then reflected back to the sample cell by a single planar mirror. The effect of the biasing voltage is studied through the ability to change the nonlinearity by modulating the orientation of the NLC molecules electrically. By suitably modulating the quasistatic electric field the optical pattern transition from the hexagon to the roll is achieved. The pattern transition can be explained by the linear stability analysis for the nonlinear liquid crystal film with optical feedback. © 2004 American Institute of Physics. [DOI: 10.1063/1.1795363]
As is proposed and demonstrated by Firth and D’Allessandro, a simple optical system for optical pattern formation is constituted by placing a thin Kerr medium in front of a planar feedback mirror.1,2 For these systems the spontaneously generated patterns will typically form as hexa-gons. By breaking the rotational symmetry or using a spatial filter one can observe patterns other than hexagons.3–6If the nematic liquid crystal(NLC) films are used as the nonlinear media, three kinds of operating modes have been used to observe the transverse pattern formation.7–9Nevertheless, a quasistatic electric field biased parallel planar-aligned NLC film has not been used to observe the transverse pattern for-mation. Recently, we succeed in observing optical pattern formation by using such NLC films. The anisotropic distri-bution of the threshold intensity for the patterns to be formed makes the optical patterns can be switched between the roll and the hexagon by controlling the input light power.10 How-ever, the effect of the biasing voltage in this one-feedback-mirror system has not been studied. From our previous works we know that the optical nonlinearity for such NLC films can be effectively modulated by suitably applying a quasistatic electric field.11,12 This is due to the unique prop-erties of liquid crystal films. A nematic liquid crystal film can not only be an anisotropic film but also an inhomogeneous optical film. In particular, these optical properties can be modulated electrically utilizing its dielectric anisotropy. For example, consider the liquid crystal with positive dielectric anisotropy, the director tends to be parallel with the applied electric field via the effects of the induced electric dipole. In this letter, we present the analysis of the effect of the biasing voltage through the ability of changing the nonlinearity by electrically modulating the orientation of the NLC mol-ecules, which effectively modulates its optical anisotropy and threshold distribution. Considering both the anisotropic property of the threshold intensity for the pattern formation and the effect of the biasing voltage a simple electric method to obtain the roll and the hexagon at single input light power is successfully achieved. The experimental results reasonably agree with that predicted by the theoretical linear stability
analysis for the nonlinear liquid crystal film with optical feedback.
The work in this paper looks similar with that in Ref. 10. However, in this letter not only the intrinsic elastic aniso-tropy of the liquid crystals is considered but also the key topic of the effect of the biasing voltage is studied. The con-sideration of both the elastic and dielectric anisotropies can give further extensive understanding and applications in the optical pattern formation phenomena. Not only the experi-mental operating becomes easier but also the mechanism for the pattern-formation phenomena by using the electric-field biased NLC film is clearer.
Following the one-feedback-mirror system, the coordi-nates and the derivations in Ref. 10 the general diffusion-like equation for the optically induced optical phase variation in the transverse plane can be expressed as
t − lx 2
冉
2 x2冊
− ly 2冉
2 y2冊
+=␣I, 共1兲 where is the optically induced phase variation, is the response time, I is the input intensity, li共i=x,y兲 is thediffu-sive length in the i direction and␣is the effective nonlinear coefficient. Then the threshold intensity for the optical pat-tern formation can be easily obtained by the linear stability analysis(LSA) of Eq. (1) which assuming that a small sinu-soidal phase modulation is applied to the forward plane wave and can be expressed as
Ith共q,兲 = 1 + q2共lx2cos2+ ly2sin2兲 2R␣sin
冉
q 2 20L冊
, 共2兲where q is the wave-vector of the perturbation,is the azi-muthal angle starting from the x axis clockwise, 0 is the optical wavelength in vacuum, R is the reflectivity of the reflecting mirror, and L is the length between the sample and a)Electronic mail: [email protected]
APPLIED PHYSICS LETTERS VOLUME 85, NUMBER 14 4 OCTOBER 2004
0003-6951/2004/85(14)/2724/3/$22.00 2724 © 2004 American Institute of Physics
This article is copyrighted as indicated in the article. Reuse of AIP content is subject to the terms at: http://scitation.aip.org/termsconditions. Downloaded to IP: 140.113.38.11 On: Thu, 01 May 2014 04:10:32
the reflecting mirror. The coefficient in Eqs.(1) and (2) can be expressed as lx2= 1 G
冉
d 冊
2冋
1 +k 2冉
1 + 2J0共2a兲 − J1共2a兲 a冊
册
; 共3兲 l2y= 1 G冉
d 冊
2冉
k22 k11冊
; ␣= −2nedJ1共2a兲 2 0IfrG , where G =冋
2 + k冉
1 −J0共2a兲 2 + J2共2a兲 2冊
册
; 共4兲 Ifr= ck11冉
d冊
2 共− ne兲; Vth= 2冉
k11 共储−⬜兲冊
1/2 ,wherea is the electrically biased average tilt angle of the liquid crystal directors in the middle layer of the liquid crys-tal cell, k =共k33兲/共k11兲−1, = 1 −共ne兲2/共no兲2, k11, k22 and k33
are the splay, twist, and bend elastic constants, c is the ve-locity of light in vacuum, d is the thickness of the liquid crystal cell, Ifrand Vthare Freedericksz optical intensity and
voltage. Furthermore, neand no,储 and⬜are the refractive indices and the dielectric constants with their directions par-allel and perpendicular to the liquid crystal director, respec-tively. The tilt anglea depends on the applied voltage and the input optical intensity. For a fixed input intensity, a is tunable by the applied voltage. In other words, the anisotro-pies of the diffusion lengths and the threshold intensity are tunable by the applied voltage as well.
Considering the using of the positive-dielectric-anisotropic NLC materials the orientation of the liquid crys-tal director tends to be parallel with the direction of the ap-plied electric field and the average tilt angle a can be obtained by minimizing the total free energy under the hard
boundary and a uniformly distributed electric field assump-tions. By following the Euler–Lagrange optimization process
ahas to obey the equation expressed as:
a
冉
2 +k 2关2 − J0共2a兲 + J2共2a兲兴冊
=冉
V 2 Vth 2 − I Ith + k 4冊
2J1共2a兲. 共5兲The above equation can be calculated numerically if d, V, I, and the material parameters are known. Furthermore, a is dominated by the electric field for weak input power. From Eq.(2), the threshold intensity as a function of q is expected to reach its minimum approximately when sin关共q20L兲/ 共2兲兴=1 or equivalently when q⬵/
冑
0L.From Eqs. (2) and (3), one can see that the diffusion lengths in x and y directions are anisotropic. As we explained in Ref. 10, this property results in the anisotropic distribution of the threshold intensity for the patterns to be formed. Be-sides the intrinsic elastic anisotropic property, the biasing voltage indeed plays an important role in the optical pattern formation phenomena once a quasistatic electric field biased parallel planar-aligned NLC film is used. Since the positive-dielectric-anisotropic NLC films are used the orientation of the liquid crystal directors is changed when the applied volt-age exceeds the Freedericksz voltvolt-age Vth (in our case Vth
= 0.9 Vrms). As an example, from Eq. (5) we plot the chang-ing ofa with respect to the applied biasing voltage and is shown in Fig. 1(a). From Eqs. (3) and (4), the changing ofa affects the diffusion lengths. Furthermore, from Eqs.(2)–(4), not only the diffusion lengths but also the effective nonlinear coefficient␣will be changed whenais changed. From Fig. 1(a), we can see that a can be modulated by the applied biasing voltage. Therefore, we plot␣ with respect to a as shown in Fig. 1(b). From Fig. 1(b), we see that ␣ initially increases with a increasing and reaches a maximum when
ais about 0.9 rad. However, whenais lager than 0.9 rad␣ decreases witha increasing. Furthermore, the changing be-havior of␣ with respect toa directly affects the threshold intensity distribution when a is changed. Figures 1(c) and 1(d) show the theoretical threshold power at differentafor convenient. The threshold power is obtained by the product of Eq. (2) and the beam area. In our calculation the beam diameter is assumed to be 1.4 mm. From Figs. 1(c) and 1(d), the threshold power distribution decreases withaincreasing when a is smaller than 0.9 rad and increases with a in-creasing whena is larger than 0.9 rad. Therefore, consider-ing both the anisotropic distribution of the threshold power and the electric-modulated property of the effective nonlin-ear coefficient␣ an electric method to obtain different opti-cal patterns can be expected. Whenais initially biased at a value smaller than 0.9 rad, one can input a suitable light power larger than the maximum threshold (in our case the maximum locates at = 0° and 180°) and the hexagon is expected to be obtained on the basis of its compact structure. This is similar to that in the isotropic case and we can expect the oscillation of three ripple patterns leading to hexagons formation.13 Decreasing the biasing voltage which decreas-ing a results in the increasing of the threshold. Once the minimum threshold (in our case the minimum locates at = 90°) for a value ofais smaller and close to the input light power only the mode with the lowest threshold power will be enhanced and the roll patten should be observed. On the
FIG. 1. (a) Calculated average tilt angle a vs the biasing voltage; (b) effective nonlinear coefficient␣vs the average tilt anglea;(c) calculated threshold power distribution for differenta; from the top to the bottom are
a= 0.6, 0.75, and 0.9 rad, respectively.(d) Calculated threshold power dis-tribution for differenta; from the bottom to the top area= 0.9, 1.05, and 1.2 rad, respectively; with beam diameter= 1.4 mm, d = 68m, L = 1.9 cm,
R = 0.65, input light power= 0.91 W.
Appl. Phys. Lett., Vol. 85, No. 14, 4 October 2004 Hsu, Lai, and Chen 2725
This article is copyrighted as indicated in the article. Reuse of AIP content is subject to the terms at: http://scitation.aip.org/termsconditions. Downloaded to IP: 140.113.38.11 On: Thu, 01 May 2014 04:10:32
other hand, if the hexagons are observed whenais initially biased larger than 0.9 rad one has to increase the biasing voltage to see the roll pattern.
In our experiment, the setup arrangement is the same as in Ref. 10 and the sample cell is a nematic liquid-crystal(E7) film sandwiched between two indium-tin-oxide coated glass windows. We use polyvinyl alcohol(PVA) as the alignment material and achieve the parallel planar alignment by rub-bing. The applied external fields, include a 1 kHz electric field generated by a microcomputer’s waveform synthesizer
(Quatech Inc., WSB-A12M) and the p-polarized optical field
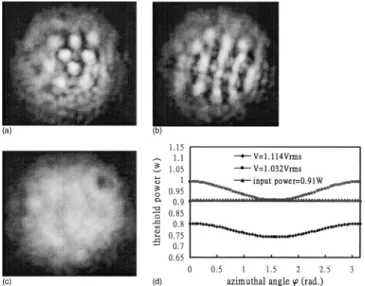
at the wavelength of 514.5 nm from an Ar-ion laser. The original beam waist from the Ar-ion laser is 1.9 mm and the input beam diameter is controlled by the pinhole as 1.4 mm. We use the pinhole to block the stray light in the low inten-sity wings of the beam and let the high inteninten-sity region pass through the sample. The reflectivity of our reflecting mirror is about 0.65. With the cell gap of 68m, the feedback length of 1.9 cm, and the input light power of 0.91 W, the curve of the threshold power for different azimuthal angles can be calculated by the product of Eq.(2) and the beam area and the results are shown in Fig. 2(d). Though the actual laser beam is a Gaussian beam, for simplicity, we calculate the threshold power from the threshold intensity multiplied by the beam area since only the light with high intensity passing through the pinhole and the sample. The threshold power with the peak intensity reaching the threshold inten-sity should be lower then that shown in Fig. 2(d). The input light power has been indicated in Fig. 2(d) as a horizontal line to compare with the theoretical threshold power curves and it is measured after the beam passing through the pinhole and the beam splitter. In our experiments, the laser beam is
blocked when we change the biasing voltage. Therefore, the pattern formations are always starting from the homogeneous state. The images of the observed near-field patterns are shown in Figs. 2(a) and 2(b) and the transition from the hexagon to the roll can be clearly seen. Figure 2(c) shows the picture when the biased voltage is zero and there is no pat-tern formed. This is because the liquid crystal directors will not be rotated when the applied voltage is bellow the Freed-ericksz voltage Vth.
In our calculation, we set the spatial frequency q as q
⬵共兲/共
冑
0L兲. The accuracy of such an approximation has been verified by measuring the relations between the feed-back length and the pattern period. The pattern period for the feedback length L = 1.9 cm is 198m and the theoretically predicted value is 197.74m. The experimental results agree with the theoretical predictions reasonably well.In conclusion, we have observed interesting spontaneous pattern formation by using a quasistatic electric field biased parallel planar-aligned NLC film with a single feedback mir-ror. The intrinsic anisotropy of the threshold intensity distri-bution makes the switching of the formed patterns possible. Since the effective nonlinear coefficient can be modulated by controlling the average tilt angle a electrically, the optical pattern transition between the hexagon and the roll can be easily achieved by suitably modulating a by the biasing voltage even for a single input laser power. The observed phenomena can be reasonably explained by the results from the linear stability analysis of the governing diffusion-like equation.
The consideration of both the elastic and dielectric anisotropies can give further extensive understanding and ap-plications in the optical pattern formation phenomena. Not only the experimental operating becomes easier but also the mechanism for the pattern-formation phenomena by using the electric-field biased NLC film is clearer.
This work was partially supported by the National Sci-ence Council, R.O.C., under Contract No. NSC 92-2112-M-009-025.
1
W. J. Firth, J. Mod. Opt. 37, 151(1990).
2
G. D’Allessandro and W. J. Firth, Phys. Rev. Lett. 66, 2597(1991).
3
E. Ciaramella, M. Tamburrini, and E. Santamato, Appl. Phys. Lett. 64, 3080(1994).
4
G. Agez, C. Szwaj, E. Louvergneaux, and P. Glorieux, Phys. Rev. A 66, 063805(2002).
5
E. Benkler, M. Kreuzer, R. Neubecker, and T. Tschudi, Phys. Rev. Lett.
84, 879(2000). 6
B. Gütlich, R. Neubecker, M. Kreuzer, and T. Tschudi, Chaos 13, 239
(2003).
7
R. Macdonald and H. J. Eichler, Opt. Commun. 89, 289(1992).
8
M. Tamburrini, M. Bonavita, S. Wabnitz, and E. Santamato, Opt. Lett. 18, 855(1993).
9
R. Neubecker, G.-L. Oppo, B. Thuering, and T. Tschudi, Phys. Rev. A 52, 791(1995).
10
H.-K. Hsu, S.-H. Chen, and Y. Lai, Opt. Express 12, 1320(2004).
11
S.-H. Chen, J. Y. Fan, and J.-J. Wu, J. Appl. Phys. 83, 1337(1998).
12
Y. Shen, H.-K. Hsu, and S.-H. Chen, J. Opt. Soc. Am. B 20, 65(2003).
13
G. D’Allessandro and W. J. Firth, Phys. Rev. A 46, 537(1992).
FIG. 2. Near-field images of the reflected beam at the cell showing the transition from the hexagon to the roll:(a) Biasing voltage=1.114 Vrms;(b)
biasing voltage= 1.032 Vrms; (c) biasing voltage=0 Vrms; (d) calculated
threshold power vs the azimuthal angle, from the bottom to the top are biasing voltage= 1.114 and 1.032 Vrms, respectively. The horizontal line
in-dicates the input light power= 0.91 W; with beam diameter= 1.4 mm, d = 68m, L = 1.9 cm, R = 0.65.
2726 Appl. Phys. Lett., Vol. 85, No. 14, 4 October 2004 Hsu, Lai, and Chen
This article is copyrighted as indicated in the article. Reuse of AIP content is subject to the terms at: http://scitation.aip.org/termsconditions. Downloaded to IP: 140.113.38.11 On: Thu, 01 May 2014 04:10:32