Modeling Optimal Security Investment of Information
Centers
Shyue-Liang Wang1, Paul A. Stirpe2, Tzung-Pei Hong3 1
Department of Information Management 3
Department of Computer Science and Information Engineering National University of Kaohsiung
Kaohsiung, Taiwan 81148 {slwang, tphong}@nuk.edu.tw 2 Letse, LLC 45 Oser Avenue Hauppauge, NY 11788 USA paul.stirpe@letse.com
Abstract. We present here two algorithms that calculate the probability of threat and the optimal investment for information center security respectively. Based on the insecurity flow model [10] of analyzing security violations, we first model information center topology using two basic components, namely resources and filters. Four basic patterns are then identified as the building blocks for the first algorithm to calculate the accumulative probability of realized threat on each resource. To calculate the optimal investment, a risk-based algorithm that maximizes the total expected net benefit is then proposed. Analyses and numerical simulations for the two algorithms are shown on some common information center topologies to demonstrate the effectiveness of the approach. The technique proposed here can be used to facilitate the analysis and design of more secured information centers.
Keywords: information security, information center, optimal security
investment, insecurity flow.
1 Introduction
1.1 Information System Security
Information system security has been studied extensively in the past thirty years. There are many approaches proposed to enhance system security. One approach is to build systems that follow certain security policy. Many modeling techniques for this
approach have been proposed. For example, access security models such as the Bell and LaPadula model [2], information flow models such as the nondeducibility model by Sutherland [16] and the noninterference model by Goguen and Messeguer [6], etc. The access security model system is secure if its execution satisfies a set of access control conditions such as multilevel security. The information flow models treat system behavior as information flow, and security is mainly about undesired information flows.
Another approach is to build systems that reduce the system insecurity or to reduce the system vulnerabilities. For example, the insecurity flow model proposed by Moskowitz and Kang [10] is used to analyze the probability of system insecurity, and attack graph models proposed by Sheyner et. al. [15], Ammann et. al. [1], Phillips [13] are used to analyze system vulnerability. Once system vulnerabilities are found, they can be used to determine what security measures to deploy to defend the systems.
However, most techniques for analyzing system insecurity and vulnerabilities originate their modeling or analysis from the attacker’s perspective or source of the attack. This approach generally requires exponential time complexity to produce the graph. In this work, we take a different approach by starting the analysis and calculation of insecurity from the resources to be protected. Based on information system architecture and probabilities of insecurities of system components, we extend the insecurity flow model [10] and propose a naïve algorithm to efficiently calculate the probability of insecurity (or probability of threat) for each resource in the system when a single threat exists.
1.2 Security Investment
The importance of information system security has resulted in a large stream of research that focuses on the technical defenses, e.g. encryption, access control, firewalls, and intrusion detection systems, of protecting information. In addition, research that focuses on behavioral aspects of reducing information security breaches has also been rapidly developing. However, research focusing on the economics of information security investment, where the traditional decision analysis in determining the optimal level of investments based on risk and returns, is still rather sparse [3,5,7-9,14,17].
Adopting the assumption of risk neutrality, Gordon and Loeb [5] proposed an economic model for analyzing the optimal level of security investment based on the principle of maximizing the net benefit of returns. The model takes into account the vulnerability of the information system to a security breach and the potential loss should such a breach occur. It is shown that for a given potential loss, a firm should not necessarily focus its investments on information sets with highest vulnerability. They also show that the optimal security investment on midrange vulnerability information sets is capped by 1/e of expected loss due to a security breach.
Extending Gordon and Loeb’s model, many works have proposed different breach functions such that optimal investment is not capped by 1/e of expected loss. For
example, Willemson [17] proposed two similar breach functions to Gordon and Loeb but require investment up to 100%. Hausken [7] proposed four classes of security investment breach functions that have different characteristics from Gordon and Loeb and show that the optimal investment is no longer capped by 1/e.
Adopting the assumption of game theory, Bier and Abhichandani [3] use game-theoretic models to analyze the security of systems consisting of parallel components and serial components separately. They also consider the attacker’s behavior and their knowledge about the information system. However, only a framework and strategy for qualitative analysis is presented.
In this work, we extend Gordon and Loeb’s model and consider the infrastructure of information set, in particular, the topology of an information center. Based on the assumption of vulnerability on each filter, we first propose an algorithm to calculate the accumulative probability of realized threat for each resource. Based on the assumption of risk neutrality, we then propose an algorithm to determine the optimal investment by maximizing the total expected net benefit.
The rest of the paper is organized as follows. Section 2 introduces the modeling of information center security and investment. Section 3 presents the proposed algorithms for calculating the accumulative probability of realized threat on resources in an information center and the optimal security investment. Section 4 shows some analyses and numerical simulations of the proposed algorithms. Concluding remarks and future works are described in section 5.
2 Information Center Security
This section introduces the modeling of information center security investment based on insecurity flow model [10] and maximum net benefit of returns [5].
2.1 Information center Security Modeling
Given a networked computing environment, organizations can protect their computing assets by establishing protection domains [10], which contain groups of related components. The typical computing assets in an organization may include, for example, resources such as information on web servers, application servers, and database servers. Protection domains can be established by physical and logical components. Each protection domain may possess a security policy and be protected by security mechanisms such as firewalls, access control lists, and intrusion detection systems, etc., to protect their assets.
Based on the concept of computing asset (or resource) and protection mechanism (or filter), a given information center infrastructure architecture [12] can be heuristically modeled as a graph with nodes representing resources and filters (see Figure 1). The attack represents the external environment connected to the network or information center.
probability that the given threat passes through the filter. The probability of threat of a resource is defined as the probability of the given threat in the resource. Let the probability of a threat passing through the filter F1 be v1 and the probability of a threat flow through the filter F2 be v2. For simplicity, in this work we assume that the probabilities are independent from filter to filter and are independent with respect to time. In addition, once an attacker compromises a resource, the attack process ends.
F1 R1
F2 R2
A tta c k
Fig. 1. One-Tier Network
The probability of threat of each resource in the system can then be modeled by the accumulative probability of threat flow through all possible simple paths from the core to the resource. For example, for resource R1 in Figure 1, there are two possible simple paths from the Attack (A) to R1, {< A, F1, R1>, < A, F2, F1, R1>}.
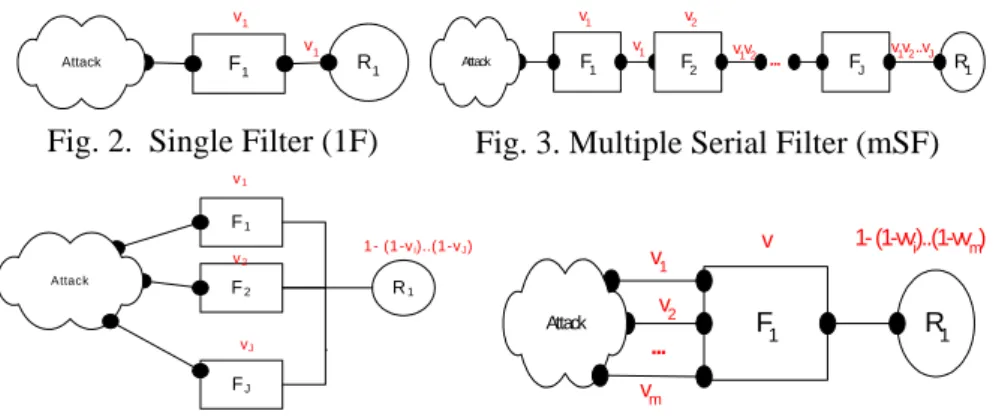
To calculate the accumulative probability of threat of each resource, we consider the following four basic patterns as the fundamental building blocks, namely single filter (1F), multiple serial filters (mSF), multiple parallel filters (mPF), and multiple interface filters (mIF).
For the single filter system in Figure 2, given a threat and assuming the probability of threat of filter F1 is v1, the probability of threat of resource R1 will be v1. For multiple serial filters system in Figure 3, given a threat and assuming the probability of threat of filter F1 and F2 be v1 and v2 etc, the probability of threat of resource R1 will be
. For the multiple parallel filters system in Figure 4, given a threat and assuming the probability of threat of filter F
J
v
v
v
1⋅
2L
1 and F2 be v1 and v2 etc, the probability that
R1 is secure from the threat is
(
1
−
v
1)
⋅
(
1
−
v
2)
L
(
1
−
v
J)
. Therefore the probabilityof threat for R1 is
1
−
(
1
−
v
1)
⋅
(
1
−
v
2)
L
(
1
−
v
J)
. For the multiple interface filters system in Figure 5, given a threat and assuming the probability of threat of filter F1 to be v1, the probability of threat for R1 is1
−
(
1
−
vv
1)
⋅
(
1
−
vv
2)
L
(
1
−
vv
m)
.F1 R1 Attack v1 v1 F1 F2 FJ R1 v1 v1 v2 v1v2 v1v2 ..vJ Attack ...
Fig. 2. Single Filter (1F) Fig. 3. Multiple Serial Filter (mSF)
F1 R1 F2 Attack F1 R1 Attack ... v1 v2 vm v 1- (1-vvi)..(1-vvm)
Fig. 5. Interface Filter (mIF)
FJ
v1
v2
vJ
1- (1-vi)..(1-vJ)
2.2 Information center Security Investment Modeling
We consider here a single-period, single-threat model of an information center contemplating the provision of additional security to protect the resources in an information center. An information center security investment model is characterized by parameters Li, 1 < i < r, and vj, 1 < j < f, representing the loss in the resources if a breach occurred, and the vulnerability which is defined as the probability of a realized threat (successful attack) on the filters respectively. For a single filter and single resource system such as Figure 2, the expected loss of the system (or security risk) is defined as v1L1. For multiple filters and single resource system such as Figure 3, the expected loss of the system is defined as v1v2…vJL1, since v1v2…vJ is the accumulative probability of realized threat that compromises the resource R1. The expected loss in a resource in an information center can then be defined as the accumulative probability of realized threat, due to a successful attack, multiplying the loss in the resource.
For two-filter and two-resource system such as Figure 1, the expected loss of the system is the sum of expected losses of all resources, R1 and R2, where expected loss of resource R1 is the accumulative probability of threat on R1 multiplied with loss of R1. The accumulative probability of threat on a resource can be calculated using the combination of the basic patterns introduced in the previous subsection and an algorithm called APT that will be introduced in the next section.
In keeping with the notation used in [5], note that the vulnerability (probability of realized threat) of a resource is a probability between 0 and 1, v ∈ [0, 1]. A resource is completely invulnerable when v = 0 and completely vulnerable when v = 1. For any given threat, the expected loss increases with the vulnerability. However, one can invest in security to protect resources in an information center. Let z > 0 denote the monetary (e.g. dollar) investment in security to protect resources. The purpose of the investment z is to lower the probability that the resources will be breached.
Let sj(zj) denote the probability of threat passing through filter Fj after zj dollars have been invested on Fj to improve the security. When no dollar is invested, i.e. zj = 0, the probability of threat is the initial filter vulnerability sj(0)=vj. We refer the function sj(zj) as the security breach probability function on filter Fj. Note that the total investment z is the sum of all investments zj on all filters in an information center, i.e., z = ∑ zj.
Let pi(z) denote the accumulative probability of realized threat on resource Ri after z dollars have been invested to improve security in an information center. Note that z is the total dollar of investment on all filters in an information center. When no dollar is invested, pi(0) is the initial accumulative probability of realized threat. In addition, pi(z) can be calculated using the same basic pattern mentioned before and the ATP algorithm in the next section.
The expected loss of an information center before and after investment z is then expressed as
∑
∑
= =∗
∗
r i i i i r i iL
and
p
L
p
1 1)
(
)
(
0
z
In order to determine the amount to invest in information security, a risk-neutral approach would compare the expected benefits of the investment with cost of the investment. The total expected net benefit of an investment in information center security, denoted as TENB, is equal to the reduction in the information center’s expected loss attributed to the extra security less the cost of the investment:
∑
∑
= =−
∗
−
=
f j j i i r i ip
L
z
p
z
TENB
1 1))
(
)
(
(
)
(
0
z
The optimal amount to be invested in an information center security is to determine the z* such that the TENB is maximized.
3 Proposed Algorithms
This section presents two algorithms that calculate the accumulative probability of realized threat for each resource and the optimal security investment for each filter in an information center respectively.
To calculate the probability of threat for any resource in an information center, we propose an algorithmic approach that generates path trees that contain all possible simple paths from the resource to the attack. For a given resource, the algorithm finds simple paths from the resource back to the attack in a top-down manner, based on the system structure, and adds to the tree. The simple path here is defined as a path that does not contain repeated nodes and any other resources. The leaf node of a path must be the attack. The path from a filter to a non-attack leaf node will be pruned if the filter has a attack as its other child. The algorithm then performs a bottom-up level-wise calculation of accumulative probabilities of threat passing each filter on the same level of the tree. The probability at the root of the tree will be the accumulative probability of threat of the resource. To calculate the probability of threat passing through a filter, depending on the number of interfaces, the filter is decomposed into combination of the basic patterns. The accumulative probability is then calculated according to the combined basic pattern.
Unlike the attack graph approach [1,11,13,15] for calculating the network vulnerability, our approach generates the search tree from the resource backward to the attacker. For each resource, there is exactly one attack in our model. However, in the attack graph approach, the algorithms generate all possible paths from one attacker to many resources. It generally requires exponential time complexity to produce the graph.
Algorithm APT (Accumulative Probability of Threat) Input: (1) an information center topology,
Output: accumulative probability of threat for each resource
1. For each resource, Ri, in the network;
1.1 Build an accumulative probability of threat tree,
where Ri is the root of the tree and each possible simple path from Ri to the attack (leaf node) is a branch of the tree.
1.2 For each level, from bottom level to the root level, 1.2.1 For each filter on the same level,
Calculate the accumulative probability of threat using the basic patterns
To determine the optimal security investment, z*, that maximizes TENB(z), one can set the first-order partial differentiation of TENB(z) with respect to zj to zero, i.e.
0
)
(
=
∂
∂
jz
TENB z
. This operation yields the maximum of TENB, if the breach
probability function satisfies
(
2)
0
2
≥
∂
∂
z
z
s
. However, due to the complexity of information center topology that the accumulative probability of realized threat on each resource is extremely difficult to express and therefore the partial differentiations are practically unobtainable. Hence we propose using the following numerical method to perform direct search to calculate the optimal security investment. The original Nelder and Mead’s simplex method is an iterative method that calculates the minimum point of a given function without requiring functional derivatives. It requires n + 1 initial guesses for the minimum point of an n-dimensional function. It also needs four user specified coefficients for accuracy tolerance, reflection, expansion, and contraction coefficients.
For each given guess of optimal investment zk, the proposed algorithm first
calculates its total expected net benefit. To calculate the total expected net benefit, the algorithm calls the APT algorithm for accumulative probability of threat for each resource in the information center. After obtaining the total expected net benefit for each guess, it then calls Nelder and Mead’s simplex method to iteratively find the optimal investment zk for the information center security investment.
Algorithm OSI (Optimal Security Investment) Input: (1) an information center topology,
(2) probability of threat on each filter, sj(zj), 1 < j < f (3) Li : loss associated with resource Ri , 1 < i < r
(4) TENB(z)
(5) initial guesses, z0, z1, z2, ..zf,
(6) required tolerance ε,
(7) reflection, expansion, and contraction coefficients a, b, c
Output: optimal investment z* that maximizes TENB(z)
1.1 Calculate accumulative probability of threat, pi(0), pi(zk), for each resource, by APT algorithm
1.2 Calculate Total Expected Net Benefit for each zk,
2. Call Nelder & Mead simplex method to determine the optimal investment z* that maximizes TENB(z)
4 Analysis
4.1 Information center Security
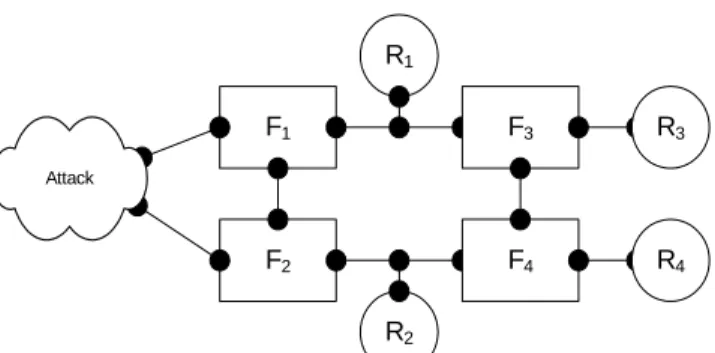
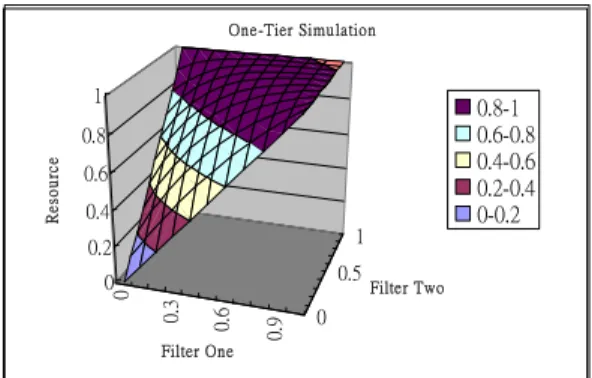
This section shows two numerical simulations for demonstrating the proposed algorithm in calculating the accumulative probabilities of threat for the resources in the one-tier (Figure 1) and two-tier (Figure 6) network designs. Figure 7 shows the accumulative probabilities of threat for R1 for the one-tier network when the probabilities of threat for the two filters vary from 0 to 1. The higher the probability, the less secure is the resource. It is observed that as the probability of threat for filters increases, the probability of threat for resources increases rapidly. Figure 8 shows the accumulative probabilities of threat for resources for the one-tier and two-tier networks when the probability for each filter is the same. It can be observed that resource R1 in the two-tier pattern is less secure than R1 in the one-tier pattern but more secure than R3 in the two-tier pattern. The reason that R1 in two-tier pattern is less secure than R1 in the one-tier pattern is because there are additional paths that traverse through F4 and F3 to reach resource R1 in two-tier pattern. However, R3 in two-tier pattern is not as secure as one single filter when the probabilities of threat for the filters are greater than approximately 0.6, in this particular setting. This is an indication that alternative designs need to be investigated.
F1 R1 F2 R2 Attack F3 R3 F4 R4
0 0. 3 0. 6 0. 9 0 0.5 1 0 0.2 0.4 0.6 0.8 1 R e sour ce Filter One Filter Two One-Tier Simulation 0.8-1 0.6-0.8 0.4-0.6 0.2-0.4 0-0.2
Fig. 7. One-Tier Simulations
On e a n d T w o T ie r S im lu a tio n s 0 0.1 0.2 0.3 0.4 0.5 0.6 0.7 0.8 0.9 1 0 0.1 0.2 0.3 0.4 0.5 0.6 0.7 0.8 0.9 1 F ilte r P ro b a b ility Pr obabi li ty o f T h re at 1T-R1 2T-R1 2T-R3 1F
Fig. 8. One-Tier and Two-Tier Simulations
4.2 Information center Security Investment
This section shows two numerical simulations for demonstrating the proposed OSI algorithm in calculating the optimal investment z* that maximize the total expected net benefit. The one-tier (Figure 1) and the reduced one-tier (Figure 9) information center design topologies are considered. The total expected net benefit of the reduced one-tier design in Figure 9 can be expressed as TENB(z) = [v1 – s1(z1)]L1+ [v2 – s2(z2)]L2 - z1 - z2. Assuming the breach probability function sj(zj)=vj / (αzj+1)
β
[5], 1 < j < 2, v1 = v2 = v, and L1 = L2 = L, then the optimal investment can be analytically expressed as
α
αβ
β1
)
(
1 1 *=
−
+vL
z
jUsing the proposed OSI algorithm, we can obtain the simulation result as shown in Figure 10. The parameters used here are α = β = 1, v = 0.9, and L = 1000. The optimal investment calculated is zj* = 29. It can be observed that the numerical result matches with the analytical result very well.
For the one-tier design in Figure 1, the total expected net benefit can be expressed as
TENB (z) = [1-(1-v1)(1-v1v2) – (1-(1-s1(z1))(1-s1(z1)s2(z2)))]L1 + [1-(1-v1)(1-v1v2)–
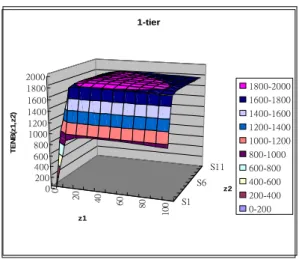
(1-(1-s2(z2))(1- s1(z1) s2(z2)))]L2 - z1 - z2. Assuming the same breach function and parameters, the simulation results using the proposed OSI algorithm is shown in Figure 11. The numerical results show similar characteristics as the reduced one-tier design in Figure 10 with zj* = 30. However, analytical expression of optimal investment for this information center design is not readily obtainable. This is an indication that the proposed numerical approach can facilitate analysis and design of a more secured information center.
F1 R1
F2 R2
Attack
Fig. 9. Reduced 1-Tier Network
0 20 40 60 80 100 0 40 80 0 200 400 600 800 1000 1200 1400 1600 1800 TE N B (z 1 ,z 2 ) z1 z2 Reduced 1-tier 1600-1800 1400-1600 1200-1400 1000-1200 800-1000 600-800 400-600 200-400 0-200
0 20 40 60 80 10 0 S1 S6 S11 0 200 400 600 800 1000 1200 1400 1600 1800 2000 T E NB( z 1 ,z 2 ) z1 z2 1-tier 1800-2000 1600-1800 1400-1600 1200-1400 1000-1200 800-1000 600-800 400-600 200-400 0-200
Fig. 11. One-Tier Simulations
5 Conclusions
In this work, we have studied the threat problem of information centers caused by potential attacks and proposed two algorithms, APT and OSI, to calculate the accumulative probability of threat for resources and the optimal security investment for each filter respectively in an information center when a single threat exists. The proposed APT algorithm is based on a threat flow model that models the probabilistic flow of possible attacks on information systems. The proposed OSI algorithm is based on a risk-neural assumption that the optimal security investment should maximize the total expected net benefit. Examples demonstrating the proposed algorithms are given. Numerical simulations on some common information center designs are presented. The calculated results effectively show the accumulative probabilities of threat for all the resources and the optimal security investments for the filters which can be used to facilitate the analysis and design of more secure information centers.
However, more work needs to be done. We have not considered multiple threats that might attack an information system simultaneously. In addition, complexity of various components and their dependencies in an information center is not completely modeled. We plan to investigate these issues as well as enhancement of our information center security and investment model.
References
1. Ammann, P., Wijesekera, D., Kaushik, S., “Scalable, Graph-Based Network Vulnerability Analysis”, Proceedings of the 9th ACM Conference of Computer and Communications Security (CCS’02), 217-224, 2002.
2. Bell, D., LaPadula, L., “Secure Computer Systems: Unified Exposition and multics Interpretation”, Technical Report, MTR-2997, MITRE, Bedford, Mass, 1975.
3. Bier, V.M., Abhichandani, V., “Optimal Allocation of Resources for Defense of Simple Series and Parallel Systems from Determined Adversaries”, In Risk-Based Decision Making in Water Resources X, 59-76, Reston, VA: American Society of Civil Engineers, 2003.
4. Cisco Systems, Inc., “Data Center: Infrastructure Architecture: SRND”, http://www.cisco.com, March 2004.
5. Gordon, L.A., Loeb, M.P., “The Economics of Information Security Investment”, ACM Transactions on Information and Systems Security, 5(4), 438-457, 2002.
6. Goguen, J.A., Meseguer, J., “Security Policies and Security Models”, Proc. of the 1982 IEEE Symposium on Security and Privacy, 11-20, Oakland, CA, April 1982.
7. Hausken, K., “Returns to Information Security Investment: Effect of Alternative Breach Functions on Optimal Investment and Sensitivity to Vulnerability”, Information Systems Frontiers, Vol. 5, No. 8, 2006.
8. Hoo, K.J. S., “How much is enough? A Risk-Management Approach to Computer Security”, Ph.D. thesis, Stanford University, 2000.
9. Huang, C.D., Hu, Q., Behara, R.S., ”Economics of Information Security Investment in the Case of Simultaneous Attacks”, The Fifth Workshop on the Economics of Information Security, University of Cambridge, England, June 2006.
10. Moskowitz, I.S., Kang, M.H., “An Insecurity Flow Model”, In New Security Paradigms Workshop, Langdale, Cumbria, UK, 1997.
11. Ortalo, R., Dewarte, Y., Kaaniche, M., “Experimenting with Quantitative Evaluation Tools for Monitoring Operational Security”, IEEE Transactions on Software Engineering, 25(5):633-650, September/October 1999.
12. OMG, “CORBA Security”, version 1.1, OMG document number 96-08-03 through 96-08-06, 1996.
13. Phillips, C., Swiler, L.P., “A Graph-Based System for Network-Vulnerability Analysis”, In New Security Paradigms Workshop, 71-79, 1998.
14. Schechter, S.E., “Computer Security Strength and Risk: A Quantitative Approach”, Ph.D. thesis, Harvard University DEAS, 2004.
15. Sheyner, O., Wing, J., “Tools for Generating and Analyzing Attack Graphs”, Proceedings of Formal Methods for Components and Objects, Lecture Notes in Computer Science, 2005. 16. Sutherland, D., “A Model of Information”, Proc. of the 9th National Computer Security
Conference, NSA/NIST, Gaithersburg, MD, September 1986.
17. Willemson, J., “On the Gordon & Loeb Model for Information Security Investment”, The Fifth Workshop on the Economics of Information Security, University of Cambridge, England, June 2006.