362
Abstract
Objective We analyzed data from the National Health Insurance Research (NHIR) database in the year 2000 to estimate the seasonal variation in the chickenpox rate in Taiwan.
Patients and Methods All chickenpox cases listed in the NHIR database were included (n = 165,719). A Lorenz curve was plotted and a chi-square test for equal proportions calculated for seasonal variation. To determine the effects of temperature and season on outcome values, generalized estimating equation methods were utilized to adjust the effects of other possible influencing factors and take into account the within-subject dependence over repeated assessments.
Results All four regions of the country had highest incidence rates in January, and three of them had lowest rates in September. Incidence was significantly higher in females aged 15 –24 years than in males. An increment of 1 °C resulted in an incidence ratio of approximately 0.98 or, equivalently, a 10 °C increment gives an incidence ratio of approximately 0.78. Conclusion The results suggest that season and temperature are significantly related to the incidence of chickenpox. Infectious diseases can be monitored. Prevention procedures can be taken by understanding its pattern and activity in order to decide the best policy for vaccination. Further studies are warranted, particularly for long-term trends, and in other nations with different seasonal temperatures from Taiwan.
Blackwell Publishing Ltd Oxford, UK IJD International Journal of Dermatology 1365-4632 Blackwell Publishing Ltd, 2006 45
Report
Risk factors for chickenpox Wu et al.
REPORT
Risk factors for chickenpox incidence in Taiwan from a
large-scale computerized database
Po-yuan Wu,
MD
, Yu-Chuan Li,
MD, PhD
, and Hong-Dar Isaac Wu,
PhD
From the Graduate Institute of Medical Informatics, Taipei Medical University, Guangyan Dermatology Clinic, School of Public Health, China Medical University, Taipei, Taiwan
Correspondence Yu-Chuan Li, MD, PhD
Graduate Institute of Medical Informatics Tapei Medical University
1031, Tapei, Taiwan E-mail: [email protected]
Introduction
Many infectious (especially viral) diseases, such as influenza and disease, resulting from respiratory syncytial virus1 have a cyclical and seasonal pattern. Identifying the seasonal pattern and factors predicting the virus infection rate is very impor-tant in outbreak prevention and disease control.
Chickenpox is a highly contagious disease with an average 2-week incubation period. The complications of chickenpox include pock scars, pneumonia, and encephalitis. The mortal-ity rate for children with leukemia or immunosuppressed children is 7–14%.2 Infections during pregnancy may cause congenital abnormalities,3 and may even be life-threatening to the fetus and mother.4 After primary exogenous Varicella-zoster virus (VZV) infection, the incidence and severity of latent infection – herpes zoster and its complication – post-herpetic neuralgia increases with age in association with a progressive decline in cell-mediated immunity to VZV. The Varicella vaccine was licensed and marketed in Taiwan in August, 1997. However, it has been provided free through government agencies since January, 2004. As a result, our data were carried out before mass vaccination, except for a few children who had paid for a vaccination.
With the implementation of the 1995 National Health Insurance Program in Taiwan, all contracted medical facili-ties were mandated to send computerized data, including ICD numbers, and information on medications and treat-ments, to the Bureau of National Health Insurance (BNHI) to qualify for financial reimbursement. As of April, 2003, there were 21,869,478 people (a coverage rate of 96%) enrolled in the NHI Plan. The BNHI contracted 17,022 medical institu-tions, which was 94% of the medical institutions nation-wide.5 The NHI Plan has accumulated data on 12 million claims, the largest databank of medical/ health information in the world.6 However, it is difficult to use the data because there are some gaps that lead to incorrect interpretation of the data. First, the program mandates that the prescribed drugs be linked to ICD numbers but sometimes incorrect ICD numbers are entered into the database owing to off-label use. Second, difficulties in diagnosing diseases are given temporary ICD numbers. Third, some ICD numbers indicate a group of diseases rather than a specific single disease. In our study, chickenpox is easy to diagnose and the drugs pre-scribed for its treatment are straightforward. Furthermore, chickenpox cases must be reported to the health authorities, so the chickenpox ICD number can not be used for other reasons.
363
Wu et al. Risk factors for chickenpox Report
Owing to low costs and the convenience of visiting hospitals and clinics in Taiwan (only approximately $US3–17) the data reflect attendance and the real condition of varicella; unlike in the UK, where many children with varicella are never seen by health care workers. We also used the daily weather data and demographic data provided by the govern-ment sources. All the data analyzed were reliable.
Materials and Methods
Chickenpox was clinically defined by the acute onset of multiple typical skin lesions in different stages (i.e. erythematous lesions, papules, vesicles, and crusts) and the ICD numbers of chickenpox were 052.0, 052.1, 052.7, 052.8 and 052.9, respectively. We collected data for the entire year 2000 that were banked under the above ICD numbers and transferred by all clinics and hospitals in Taiwan to the NHIR database. Using the SQL interpreter of the database, we obtained data including patient ID, date of visiting (counted first visit only if multiple visits were made), gender, birth date, and hospital ID. Then we used another interpreter to translate the hospital IDs into real locations. Hospitals were categorized on the basis of location (northern, central, southern, and eastern, and off-shore islands). The weather data in Taiwan were collected from Central Weather Bureau.7 The demographic data were extracted
from the government database.8
Estimation of incidence rates
Incidence rate was defined as the number of new cases divided by the population size.
Evaluation of seasonal variation and relationships to temperature, population density, and incidence of chickenpox
Lorenz curve9,10 analysis was used to explore the seasonal
variation, and the generalized estimating equation (GEE)11 model
to estimate the effect of season or temperature change, population density, density of clinics, etc., on the incidence rate.
The Lorenz curve was plotted in the following manner: A month-specific proportion (MSP) of cases was calculated for the entire year. The MSPs were sorted and aligned from the lowest to the highest. Indicators for the 12 months were placed on the X-axis, and the cumulative MSPs on the Y-axis. Presumably if there was no monthly or seasonal variation, the graph would feature a straight line, whereas significant differences in monthly and seasonal incidences would be reflected by a high curvature. As the outcome is the “incidence rate”, it was appropriate to choose a log-link function when GEE approach is implemented. Considering the following model:
log[E(Y|X)] = β0 + β1X1 + β2χ 2 + β
3X3 + β4X4,
where; E[Y|X] is the expectation of Yij, i = 1–23 denotes the
different counties; and j = 1–12 codes for “month”. For example, Y3,4 is the incidence of April of the county 3. Moreover,
X = (X1,X2,X3,X4,), where X1 is the set of variables (i.e. three
dummy variables) labeled “season”; X2 = temperature,
X3 = density of clinics within the county, and X4 = population
density of the county. This model is rather flexible. Because the model uses time-averaged incidence data, the entire Taiwan community can be divided into several (m) counties: m = 23 represents 23 counties. For purposes of calculating the intercorrelation between counties, the counties are assumed to be independent or, at least, very close to being independent. In which case the total independent sample size is 23. This technique can also be used to divide Taiwan into more than 300 townships to increase the sample size but at the expense of sample “independence”, which is more dubious in the case of townships. Furthermore, the incidence rate per month was calculated for each county, so there were 12 consecutive measurements per county during the year 2000 and these were serially correlated. That is the reason why the GEE method was selected to cope with this type of “longitudinal” data. Finally, the variables of temperature, density of clinics, and population density were included because of suspicion that these variables might (but not necessarily) be correlated with the incidence. Their roles would be clarified in the regression analysis using backward-variable selection
procedures.
Results
There were 165,719 cases (80,448 females, 84,312 males, and 959 of unknown gender). Annual incidence for the year 2000 was 7439 (per 105 person-years). Month-specific case numbers per incidence are reported in Table 1. To examine regional variations, Taiwan was divided into four areas and the month-specific incidence of each area was plotted (Fig. 1). Figure 1 revealed that the pattern varied slightly between regions. The eastern region of Taiwan had a higher incidence in January and February, while northern Taiwan had a much lower incidence from March to May than other regions. All four regions had highest incidence rates in January, and three of them had lowest rates in September.
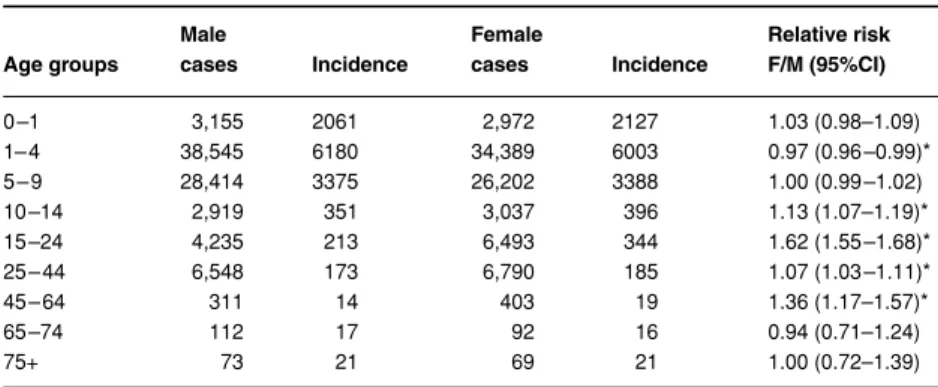
The case number and annual incidence rates per 100,000 person-years is shown by age-group and gender in Table 2. Relative risk between genders together with the correspond-ing 95% confidence intervals (CI) was also calculated. As can be seen, the incidence was significantly higher in females aged 15–24 years and 45–64 years than in males.
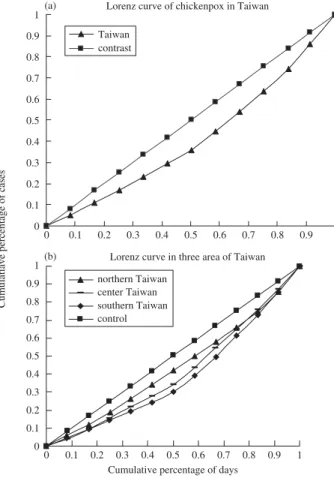
Figure 2 shows the Lorenz curve for the whole country (Fig. 2a) and those for the four regions (Fig. 2b). Generally, the curve shows significant seasonal variation (in terms of month-to-month variation) countrywide. Chi-square tests for equal proportions shows the chi-square is 16,957.377 (P < 0.0001). When the data were stratified by region, a difference in the pattern of seasonal variations was found between southern Taiwan and northern Taiwan. This could be an interesting contrast to the results shown in Fig. 1 and could
364 Report Risk factors for chickenpox Wu et al.
be referred to as the “regional difference of seasonal varia-tion.” In addition, population density was also considered to be a stratified variable; however, no significant difference was found (between Lorenz curves).
Finally, the analysis of the GEE regression model shown in Table 3 found a statistically significant difference between seasons; the “season” variable was expressed by three dummy variables representing the comparison between spring, fall, or winter versus summer, respectively. In this table, the variables
of the full model (Model IV) included season, month-averaged temperature, population density of each county, and density of clinics of each county. Other variables were also considered in a previous analysis, including total number of doctors and total county-specific population size, etc. No special significance was found for any of these variables (not reported). Other models (Model I, II, and III) were obtained by eliminating the most nonsignificant variable one at a time. Table 3 states that the relative incidence ratio of spring (March, April, and May) versus summer (June, July, and August) is exp(0.2996) = 1.35, 95%CI = (1.17, 1.55), and so on.
Discussion
The determinants of susceptibility to chickenpox may include age, season, climate, geographic location, and frequency of contact expressed by population density.12
From Table 2, age is the most important determinant of chickenpox incidence (85% of patients are 0 –14 years old). Similarly, Fleming et al.13 reported a 62% increased risk for females aged 15–24 years compared with males. The increased risk of chickenpox in this age group may be owing to more con-tact with sick children. In addition, a 36% increase in our study for females aged 45–64 years compared with males was found. Whether it is coincidence or not, this needs further study.
Table 1 Month-specific chickenpox cases in Taiwan during the year 2000
Month, 2000
Jan Feb Mar Apr May Jun Jul Aug Sep Oct Nov Dec Total
Gender F 11,341 9,445 8,175 7,860 7,766 6,894 4660 4693 4234 5,092 5,106 5,182 80,448
M 11,738 10,136 8,670 8,165 8,039 7,236 4962 4906 4370 5,267 5,361 5,462 84,312
U 111 126 98 85 93 67 52 62 69 53 72 71 959
Total 23,190 19,707 16,943 16,110 15,898 14,197 9674 9661 8673 10,412 10,539 10,715 165,719
Figure 1 Month-specific incidences in four regions of Taiwan
Age groups Male cases Incidence Female cases Incidence Relative risk F/M (95%CI) 0 –1 3,155 2061 2,972 2127 1.03 (0.98–1.09) 1– 4 38,545 6180 34,389 6003 0.97 (0.96 –0.99)* 5 – 9 28,414 3375 26,202 3388 1.00 (0.99 –1.02) 10 –14 2,919 351 3,037 396 1.13 (1.07–1.19)* 15 –24 4,235 213 6,493 344 1.62 (1.55 –1.68)* 25 – 44 6,548 173 6,790 185 1.07 (1.03 –1.11)* 45 – 64 311 14 403 19 1.36 (1.17–1.57)* 65 –74 112 17 92 16 0.94 (0.71–1.24) 75+ 73 21 69 21 1.00 (0.72–1.39) *P < 0.0001.
Relative risk and its 95% confidence intervals (CI) are calculated for comparison between different genders.
Table 2 Cases and incidence (/105
person-year) of chickenpox stratified by age and gender
365
Wu et al. Risk factors for chickenpox Report
The meaning of the term “climate” can be complex in that it includes temperature, moisture, air pressure, number of rainy days, sunny hours,14 and the quantity of rain, etc. In this study, “monthly average temperature” and “the indicator of
season” were the variables used to represent the “climate” variable and to examine the effect of climate on the incidence of chickenpox. By using the GEE method with nested models defined by a backward variable selection procedure, all four models revealed significant differences between the seasons (with summer serving as the reference season). In particular, spring versus summer had a relative risk (or incidence ratio) of approximately e0.3 = 1.35 [ref. models II to IV in Table 3], and 95% CI is approximately (e0.16, e0.44) = (1.17, 1.55); win-ter versus summer has an incidence ratio of approximately e0.26 = 1.30, and 95% CI is approximately (e0.14, e0.40) = (1.15, 1.49). The difference between fall and summer is also signifi-cant at the 0.05-level (type I error). The incidence ratio (fall versus summer) is approximately e0.26 = 0.83 (< 1), which was mainly a result dominated by the extremely low inci-dence in September ( Table 1 and Fig. 1).
When the effect of temperature is considered, models II to IV reveal a significant change in chickenpox incidence as temperature varies. An increment of 1 °C results in an inci-dence ratio of approximately e−0.025 = 0.98, or, equivalently, a 10 °C increment gives an incidence ratio of approximately e−0.25 = 0.78. A homogeneity effect over a reasonable range of temperature was assumed. If a nonhomogeneous or nonlin-ear effect is of interest, the analysis is more complicated. The negative temperature effect may be owing to a temperature increase that causes viral activity to decrease. Note also that even if temperature is added as a variable, the effect of sea-son is still significant; “temperature” and “seasea-son” variables are adjusted for each other and their partial effects are esti-mated in Models II–IV. The results shown in Table 3 implied that even at the same temperature, seasonal differences can still influence the incidence of chickenpox. Moreover, temperature has a partial influence on incidence when the season-variable is fixed. There are still implicit, or even un-observable, influential factors underlying the season-variable about which little is understand. In Models III and IV, the density of clinics and density of population do not have an
Figure 2 (a) Lorenz curve of chickenpox rate in Taiwan, where
the x-axis shows a cumulative percentage of days and the y-axis shows a cumulative percentage of incidences. (b) Lorenz curve of the chickenpox rate in Taiwan stratified by region
Table 3 Regression coefficient in four models
Variables Model I (95%CI) Model II (95%CI) Model III (95%CI) Model IV (95%CI)
S1 (spring vs. summer) 0.4409* 0.3002* 0.2928* 0.2996* (0.3541, 0.5277) (0.1671, 0.4333) (0.1554, 0.4303) (0.1591, 0.4400) S2 (autumn vs. summer) −0.1345 −0.1963 −0.1943 −0.1943 (−0.2797, 0.0106) (−0.3327, −0.0599) (−0.3381, −0.0505) (−0.3415, −0.0472) S3 (winter vs. summer) 0.5065* 0.2740* 0.2616* 0.2673* (0.4081, 0.6048) (0.1502, 0.3978) (0.1365, 0.3866) (0.1420, 0.3925) Temperature −0.0242* −0.0257* −0.0254* (−0.0370, −0.0114) (−0.0390, −0.0123) (−0.0391, −0.0117) Clinics density 0.0648 0.1322 (−0.0640, 0.1936) (−0.1388, 0.2784) Population density −0.0573 (−0.1233, 0.0087) *P < 0.001.
366 Report Risk factors for chickenpox Wu et al.
obvious impact on the incidence of chickenpox. This obser-vation also explains the lack of significant difference in incidence between cities and rural areas.
Two methods, the Lorenz curve and the χ-square test for equal proportions, were used to determine the seasonal variation in chickenpox incidence. As variation increased, the Lorenz curve became increasingly bowed, and the area between the curve and diagonal lines indicated the variations. These areas showed that variation depends on geography (southern Taiwan > central Taiwan > northern Taiwan), but not on population density (nearly the same for any popula-tion density). As shown in Fig. 1, the incidence is higher in southern than northern Taiwan, although the average tem-perature is higher in southern than northern Taiwan owing to the lower latitude. This phenomenon may be owing to the generalized negative effect of temperature on the incidence of chickenpox but not to the absolute decision effect on inci-dence, especially in different areas.
Comparing the true incidence of chickenpox in other countries is difficult owing to the differences in reporting sys-tems.15,16 Even within a given country, changes in the reporting system may reduce or increase incidence. Contrary to our data (n = 165,719), only 5861 cases were reported by the surveil-lance system in Taiwan in the year 2000.17
There are quite a number of cases of adult chickenpox in our results. In a study by Oxman et al.,18 the use of vaccine substantially reduced the illnesses related to herpes zoster and the incidence of post-herpetic neuralgia. In the Balfour
et al. study,19 oral acyclovir therapy is safe and effective for
treatment of varicella in otherwise healthy adolescents; this may be an appropriate subgroup for treatment with antiviral drugs because the disease is more severe in them than in younger children. Both vaccination and antiviral treatment provide promising solutions for social cost owing to varicella infection; however, cost-effectiveness of treatment and vaccination policy analysis still needs further evaluations.20
The computerized database reflects the true status of chickenpox incidence in Taiwan. It will permit long-term surveillance of incidence and has facilitated a retrospective study of the effectiveness of a chickenpox vaccine on the inci-dence of the disease. In the post-SARS era, study of the cycli-cal patterns of viral infection21,22 and the climatic factors that influence virulence will be important to understand how to control and eradicate these diseases. Further investigation and analysis to determine the actual significance of each of the individual risk factors23 will be needed.
References
1 van der Sande MA, Goetghebuer T, Sanneh M, et al. Seasonal variation in respiratory syncytial virus epidemics in the Gambia, West Africa. Pediatr Infect Dis J 2004; 23: 73–74.
2 Feldman S, Hughes WT, Daniel CB. Varicella in children with cancer. seventy-seven cases. Pediatrics 1975; 56: 388–397. 3 Wheller TH. Varicella and herpes zoster: changing concepts
of the natural history, control and importance of a not-so-benign virus. N Engl J Med 1983; 309: 1434. 4 Pastuszak A, Levy M. Outcome after maternal varicella
infection in the first 20 weeks of pregnancy. N Engl J Med 1994; 330: 901–905.
5 National Health Insurance Bureau. http://www.nhi.gov.tw/ 6 National Health Research Institute. http://
www.nhri.org.tw/nhird/brief_01.htm
7 Central Weather Bureau. http://www.cwb.gov.tw/index-f.htm 8 Population affairs administration. http://www.ris.gov.tw
(Chinese).
9 Lee WC. Analysis of seasonal data using the Lorenz curve and the associated Gini index. Int J Epidemiol 1996; 25: 426 –434.
10 Lee WC. Characterizing exposure-disease association in human populations using the Lorenz curve and Gini index. Stat Med 1997; 16: 729 – 739.
11 Liang KY, Scott LZ. Longitudinal data analysis using generalized linear models. Biometrika 1986; 73: 13–22. 12 Nelson WE, Behrman RE, Kliegman RM, et al.
Streptococcal infections. In: James Todd, ed. Textbook of Pediatrics, 15th edn. Philadelphia, PA: W.B. Saunders, 1996: 750–751.
13 Fleming DM, Cross KW, Cobb WA, et al. Gender difference in the incidence of shingles. Epidemiol Infect 2004; 132: 1–5. 14 Zak-Prelich M, Borkowski JL, Alexander F, et al. The role of solar ultraviolet irradiation in zoster. Epidemiol Infect 2002; 129: 593–597.
15 Liu SC, Wang JD, Lee CY, et al. Seasonal variation of chickenpox, mumps and rubella in Taiwanese children estimated by pediatric clinics. J Microbiol Immunol Infect 1998; 31: 217–224.
16 Kokaze A, Yoshida M, Sekine Y, et al. The magnitude of variation in temperature within a year has an effect on the seasonal variations of chickenpox incidence in Japan. Epidemiol Infect 2001; 126: 269–277.
17 Center for Disease Control Taiwan. Infectious disease statistics and surveillance annual report in 2000.
18 Oxman MN, et al. A vaccine to prevent herpes zoster and post-herpetic neuralgia in older adults. N Engl J Med 2005; 352: 2271–2284.
19 Balfour HH Jr, et al. Acyclovir treatment of varicella in otherwise healthy adolescents. The Collaborative Acyclovir Varicella Study Group. J Pediatr 1992; 121: 836–837. 20 Davis MM. Varicella vaccine, cost-effectiveness analyses,
and vaccination policy. JAMA 2005; 294: 845–846. 21 Noah ND. Cyclical patterns and predictability in infection.
Epidemiol Infect 1989; 102: 175–190.
22 Wagner S, Jung H, Nau F, et al. Relevance of infectious diseases in a pediatric practice. Clin Paediatr 1993; 205: 14– 17.
23 Sumi A. Time series analysis of surveillance data of infectious diseases in Japan. Hokkaido Igaku Zasshi 1998; 73: 343–363.