國
國
國
國 立
立
立
立 交
交
交 通
交
通
通
通 大
大
大
大 學
學
學
學
應用化學系碩士班
應用化學系碩士班
應用化學系碩士班
應用化學系碩士班
碩
碩
碩
碩
士
士
士
士
論
論
論
論
文
文
文
文
利用共焦拉曼顯微光譜技術觀測在活體的缺乏輔酶
Q 酵母細胞添加抗氧化劑之影響
Effects of Adding Antioxidants to
CoQ-Deficient Yeast Cells Studied by in Vivo
Confocal Raman Microspectroscopy
研 究 生:何恭慧
指導教授:重藤真介 博士
利用共焦拉曼顯微光譜技術觀測在活體的缺乏輔酶
Q 酵母細胞添加抗氧化劑之影響
Effects of Adding Antioxidants to CoQ-Deficient Yeast Cells
Studied by in Vivo Confocal Raman Microspectroscopy
研 究 生:何恭慧 Student:Kung-Hui He
指導教授:重藤真介 Advisor:Shinsuke Shigeto
國 立 交 通 大 學
應 用 化 學 系
碩 士 論 文
Submitted to M. S. program Department of Applied ChemistryCollege of Science National Chiao Tung University in partial Fulfillment of the Requirements
for the Degree of Master of Science in
Applied Chemistry
July 2013
Hsinchu, Taiwan
I
Effects of Adding Antioxidants to CoQ-Deficient Yeast
Cells Studied by in Vivo Confocal Raman
Microspectroscopy
Student: Kung-Hui He Advisor: Dr. Shinsuke Shigeto
M. S. Program,
Department of Applied Chemistry
National Chiao Tung University
Abstract
In this study, we apply confocal Raman microspectroscopy to a strain of fission yeast that cannot produce CoQ10 due to a gene disruption (denoted ∆ppt1) and quantitatively assess
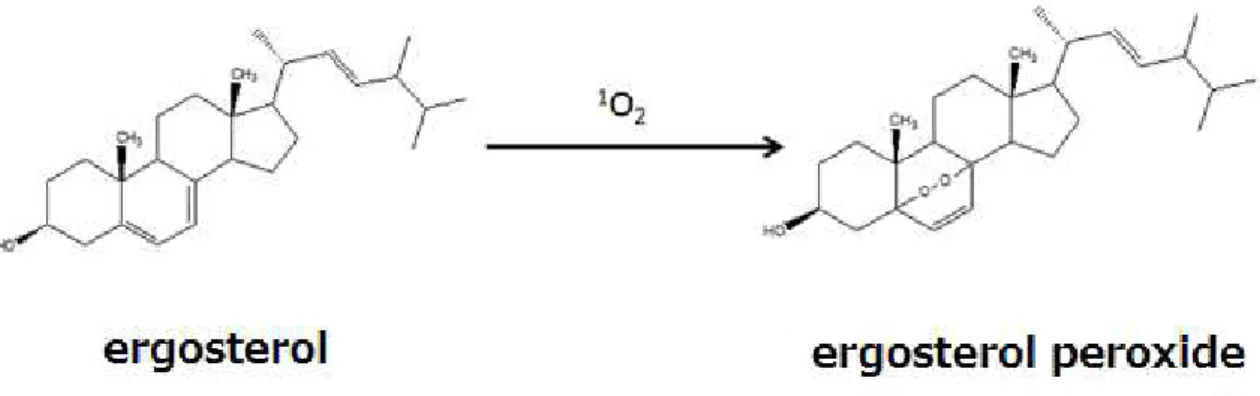
the effect of adding various antioxidants. According to the literature, the Raman band of yeast at 1602 cm−1 is contributed mainly from the conjugated C=C structure of ergosterol. The reactive oxygen species (ROS) present in yeast cells may oxidize ergosterol to form ergosterol peroxide, in which the conjugated C=C structure is destroyed, and consequently the 1602 cm−1 band may decrease. If exogenous antioxidative reagents are added to the ∆ppt1 strain,
we expect the Raman band at 1602 cm−1 to recover because ROS responsible for the loss of ergosterol can be detoxified by the antioxidant. We measured Raman spectra from 200 ∆ppt1
cells with and without treatment of common antioxidants (lipoic acid, glutathione, ascorbic acid, and an inclusion complex of lipoic acid with γ-cyclodextrin) as well as 200 wild-type yeast cells. The band area ratio of the 1602 cm−1 band to the CH bending band at 1440 cm−1 was found to increase about 2–3 times when the antioxidant was added. Among the five antioxidants, glutathione showed the best performance of increasing the intensity of the 1602 cm−1 band. We also performed time-lapse experiments, in which the time dependence of the band intensity ratio (1602 vs. 1440) was monitored over 1 day. The results show that in all cases tested, the band intensity ratio markedly increases in 10 h after addition of the antioxidant. We demonstrate that Raman microspectroscopy in combination with the mutant yeast strains can be used as a novel quantitative tool for assessing the efficacy of various antioxidants in vivo.
II
利用共焦拉曼顯微光譜技術觀測在活體的缺乏輔酶
Q 酵母細胞添加抗氧化劑之影響
學生: 何恭慧 指導教授: 重藤真介 博士
國立交通大學應用化學系碩士班
摘要
摘要
摘要
摘要
我們利用共焦拉曼顯微技術去觀測缺乏輔酶 Q10 的活體酵母細胞在添
加定量之抗氧化劑的影響。根據文獻,拉曼訊號 1602 cm
-1主要來自於酵母
細胞中的麥角甾醇結構裡的共軛碳碳雙鍵。然而,生長環境中的活性氧會
使得麥角甾醇轉換成過氧化麥角甾醇,因此,共軛碳碳雙鍵會被破壞,使
得拉曼訊號 1602 cm
-1消失。缺乏輔酶 Q10 的酵母細胞本身的抗氧化能力相
對弱於野生種,所以活性氧存在於環境中的濃度高於野生種,故缺乏輔酶
Q10 的活體酵母細胞的拉曼訊號 1602 cm
-1強度也弱於野生種。利用額外添
加抗氧化劑去消除環境中的活性氧,使其訊號增加。我們分別測量添加各
種抗氧化劑 200 隻細胞,其結果發現訊號增強大約 2 到 3 倍。經過時間推
移實驗,發現添加抗氧化劑後 10 小時,訊號有顯著地增強。
III
Acknowledgments
感謝重藤真介老師這兩年的指導,想當初當近研究所時,進入了重藤
真介老師的實驗室,一個英文很不好的人進入一間需要用英文進行溝通的
實驗室是一個蠻詭異的選擇。經過這兩年在實驗室裡的英文訓練,變得比
較敢說敢講。能完成這本論文也要特別感謝島根大學的山本達之教授以及
他的學生們。在此要謝謝同屆的同學,君輔以及書瑋,大家一起努力。還
有學長姐傳耿、小阿芳、塞塞、岡岡、辰文、伊庭、鎮遠,以及 Hemanth
和 Sudhakar 在學習以及研究上的幫助。還有學弟妹仁芳、富珉、弘凱、祐
敏、俊豪、量承,以及秉鈞,感謝有他們讓實驗室的氣氛非常的和諧。也
要感謝我爸媽的支持還有我姐姐在經濟上的支助,可以讓我無憂無慮的完
成碩士學位。還要感謝上評、慈慧、佳展、冠婷,以及玉米,讓我在新竹
也有好友的陪伴,還有恩立、嚕嚕、慧琪、于婷兒以及小太陽在我心情低
落時當我的出氣筒。最後,也要感謝濵口宏夫教授以及島田博後、岡島博
後、Vitaly 博後的指導。經過這兩年的研究學習,讓我感受到許多人的幫
忙,我真的非常感謝各位在各方面幫助過我的人。
IV
Tables of Contents
Abstract (English) ……….……I
Abstract (Chinese) ………...…II
Acknowledgments ………..III
Tables of Contents………...IV
List of Figures and Tables……….…………...V
Chapter I Introduction ……….1
Chapter II Experimental ………..6
II-1. Sample preparation ……….7
II-2. Laboratory-built confocal Raman microspectrometer ………...8
II-3. Experimental conditions in Raman measurements ………..10
II-4. Singular value decomposition analysis ………10
Chapter III Results and Discussion ………...17
III-1. Growth curves ……….18
III-2. In vivo quantitative Raman assessment of the effects of antioxidants in
fission yeast ………..18
III-2-1. Raman spectra of the WT and
∆
ppt1 strains ……….19
III-2-2. Raman intensity changes with external addition of antioxidants
to the
∆
ppt1 strain ………...19
III-3. Time-lapse Raman measurements ………..22
III-4. Conclusion ………..23
Chapter IV Summary and Future Work ………...………...…….………..39
V
List of Figures and Tables
Figure I-1. Scheme of formation of ergosterol peroxide from ergosterol in the presence of
reactive oxygen species ………..…5
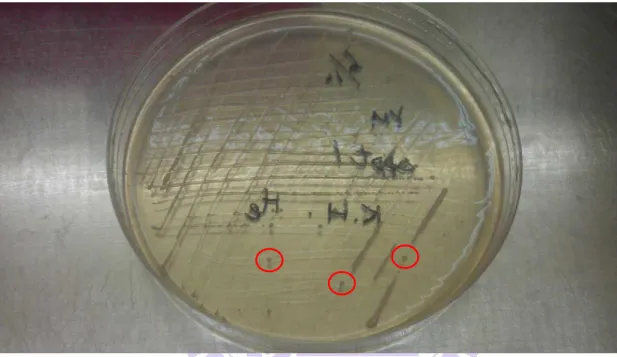
Figure II-1. Single colonies on the YES plate after 4–5 days of cultivation at 30 oC ………12
Figure II-2. Chemical structures of (a) (R)-(+)-lipoic acid (RLA), (b) glutathione (GSH), (c)
L-ascorbic acid (Vit C), and (d) γ-cyclodextrin (γ-CD) ………...13
Figure II-3. Schematic of the laboratory-built confocal Raman microspectrometer ………..14 Figure II-4. The stage-top incubator ………...15 Figure II-5. Estimation of the lateral (XY) resolution of the laboratory-built confocal Raman
microspectrometer ………16
Figure II-6. Estimation of the axial (Z) resolution of the laboratory-built confocal Raman
microspectrometer ………16
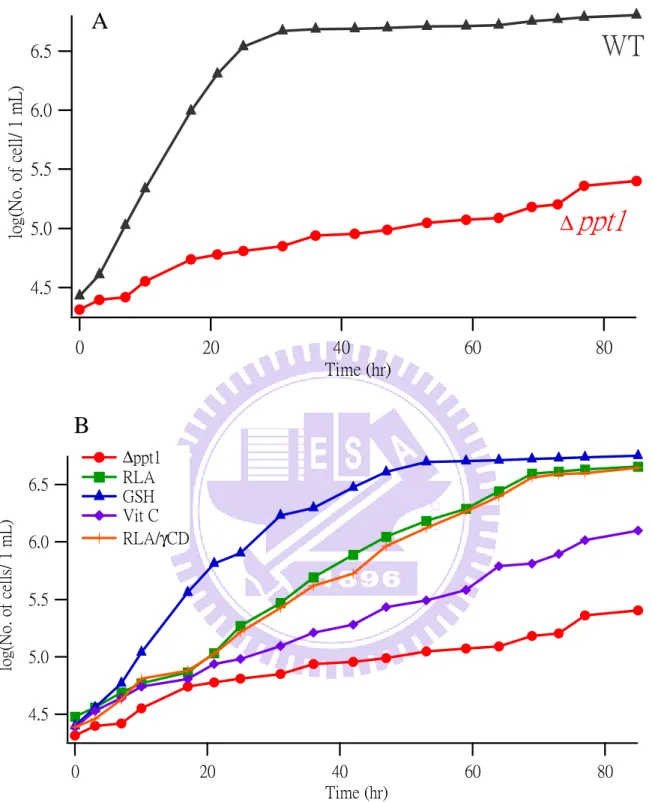
Figure III-1. (A) Growth curves of the WT and untreated ∆ppt1 strains. (B) growth curves of
the untreated ∆ppt1 strain and that treated with RLA, GSH, Vit C, and
RLA/γ-CD ………..……….…….25
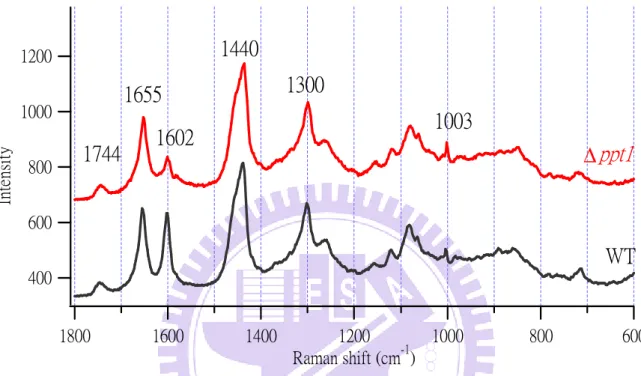
Figure III-2. Averaged Raman spectra (n = 200) of the WT and ∆ppt1 strain. The spectra
have been normalized to the area intensity of the 1440 cm−1 band ……….26
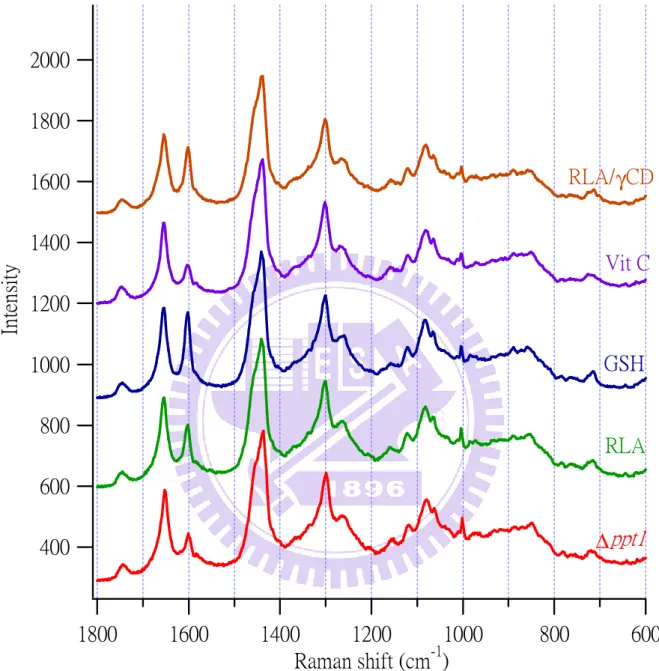
Figure III-3. Averaged Raman spectra (n = 200) of the untreated ∆ppt1 strain and the ∆ppt1
strains treated with 0.5 mM RLA,0.5 mM GSH, 0.5 mM Vit C, and 0.5 mM
RLA/γ-CD……….27
Figure III-4. Histograms of the ratio of the area intensity of the 1602 cm−1 band to the 144
0 cm−1 band, A1602/A1440 ………28
Figure III-5. Histograms of the ratio of the area intensity of the 1655 cm−1 band to the 1440
cm−1 band, A1655/A1440 ……….29
Figure III-6. Histograms of the ratio of the area intensity of the 1300 cm−1 band to the 1440
VI
Figure III-7. Histograms of the ratio of the area intensity of the 1003 cm−1 band to the 1440 cm−1 band, A1003/A1440 ………...31
Figure III-8. Bar graphs of the averaged intensity ratio of the 1602 (A), 1655 (B), 1300 (C),
and 1003 (D) cm−1 bands to the 1440 cm−1 band ……….32
Figure III-9. Time-lapse Raman spectra (n =100) of the untreated ∆ppt1 strain………33
Figure III-10. Time-lapse Raman spectra (n = 100) of the ∆ppt1 strain treated with 0.5 mM
RLA ………..34
Figure III-11. Time-lapse Raman spectra (n = 100) of the ∆ppt1 strain treated with 0.5mM
GSH ……….….35
Figure III-12. Time dependence of the averaged ratio of Raman band area intensity at 1602
cm−1 to that at 1440 cm−1 of the untreated ∆ppt1, ∆ppt1 treated with 0.5 mM RLA, and ∆ppt1
treated with 0.5 mM GSH……….36
Figure III-13. Time dependence of the averaged ratio of Raman band area intensity at 1655
(triangle), 1300 (circle), and 1003 (square) cm−1 to that at 1440 cm−1 of the untreated ∆ppt1, ∆ppt1 treated with 0.5 mM RLA, and ∆ppt1 treated with 0.5 mM GSH ………....37
Figure III-14. Histograms of the ratio of Raman band area intensity at 1602 cm−1 to that at 1440 cm−1 3 h (A) and 10 h (B) after addition of the antioxidant……….38
Table III-1. Assignments of representative vibrational bands observed in the Raman
1
Chapter I
Introduction
2
An imbalance between the level of reactive oxygen species (ROS) and the cell’s ability
to eliminate them, in favor of oxidants, may potentially cause significant structural and
functional damages to cells known as oxidative stress [1,2]. ROS, such as oxygen ions,
hydroxyl radicals, and peroxides, are continuously formed as a normal by product of aerobic
metabolism and play crucial roles in cell signaling and homeostasis. However, as the level of
ROS is elevated due to environmental stress or under path physiological conditions, ROS can
turn to be harmful to cells, leading to cellular oxidative injury. To counter the oxidative stress,
cells have various antioxidant defense mechanisms using enzymes and small-molecule
antioxidants. Antioxidants are often reducing agents such as thiols, ascorbic acid, carotenes,
polyphenols, and ubiquinone (also known as CoQ10) [1]. Because oxidative stress has been
suggested to be relevant to aging, some antioxidants are commercially produced as
supplement tablets. Despite the growing efforts in developing intracellular oxidative stress
assays, quantitative assessment of the antioxidant activity of antioxidants in vivo still remains
a great challenge. Here the author has developed a new platform for assessing the effects of
antioxidants using Raman microspectroscopy and a strain of fission yeast
Schizosaccharomyces pombe that is unable to produce CoQ10.
Raman microspectroscopy of single living S. pombe cells has been intensively studied
in the last decade [3-9, 16, 18]. One of the most important outcomes of these studies is that
the intensity of the yeast Raman band at 1602 cm−1 shows a strong correlation with the metabolic activity of yeast cells under different nutrient, stress, and atmospheric conditions [3,
4]. The spontaneous death process of budding yeast Saccharomyces cerevisiae has been
shown to accompany a decrease of this Raman band, reflecting the metabolic activity of yeast
cells [5]. Furthermore, the 1602 cm−1 band has been observed not only in yeast cells but also in animal cells [6, 7]. Although many experimental data have been accumulated on the
behavior of this interesting Raman band, its assignment has remained unclear until recently.
3
[3], which showed that addition of a respiration inhibitor KCN results in a rapid depletion of
this band. They also showed from their preliminary Raman imaging experiment that the
intracellular distribution of the molecular species that gives rise to the 1602 cm−1 band appears to coincide with that of mitochondria, the site of respiration. Inspired by these results
indicative of a close association of the 1602 cm−1 band with cellular respiration, Onogi et al. studied 13C- and 2H-isotope substitution effects on the 1602 cm−1 band [8]. By comparing the observed isotope shifts with density functional theory calculation results, they conclude that
the C=C bond without any hydrogen attached of the ubisemiquinone radical anion (CoQ−●) is a strong candidate for the origin of the 1602 cm−1 band [8]. Very recently,however, Chiu et al. argued that ergosterol, fungal sterols, is the main contributor to the 1602 cm−1 band and attributed the band to the conjugated C=C stretch of ergosterol [9] (Figure I-1).
To probe the effects of antioxidants at the single-cell level, we used a knock-out strain
of S. pombe in which p-hydroxybenzoate polyprenyl diphosphate transferase (ppt1) gene is
disrupted. This knock-out strain denoted ∆ppt1 has been well characterized previously [10,
11]. Due to the ppt1 gene disruption, the strain cannot produce CoQ10 by itself, which plays a
significant role in the respiration processes as an electron carrier. In CoQ-deficient strain
yeast cells, fermentation is the major way of producing energy. A previous study showed that
the CoQ-deficient cells cannot grow well in the minimal medium supplemented with only
glucose [10]. CoQ10 also acts as an endogenous antioxidant. Therefore, the deficiency in
production of CoQ10 in the ∆ppt1 strain may increase intracellular oxidative stress. As shown
in Figure I-1, the resulting ROS will potentially oxidize ergosterol to form ergosterol peroxide
[12, 13], and this conversion destroys the conjugated C=C moiety, which is considered to the
primary origin of the 1602 cm−1 band. Therefore, the intensity of the 1602 cm-1 band in the
∆ppt1 strain will decrease compared with that of the wild-type (WT) strain (no ppt1 gene
disruption). In the present study, we observed changes in the intensity of the 1602 cm−1 band as well as other bands for the ∆ppt1 single cells, with external addition of typical antioxidants
4
(glutathione, lipoic acid, and vitamin C) to the growth medium. We found that the intensity of
the 1602 cm−1 band is indeed restored by the addition of the antioxidants with glutathione being the most effective. We also performed time-lapse Raman measurements to understand
the dynamic aspect of our finding.
The rest of this thesis is organized as follows. Chapter II describes the sample and the
experimental approach used in this thesis work, namely, a laboratory-built confocal Raman
microspectrometer. In addition, the method of estimation of spatial resolution and data
analysis using singular value decomposition are described in detail. Chapter III presents our
results. The potential of Raman microspectroscopy with mutant yeast cells is discussed in
terms of quantitative assessment of the antioxidant activity of various biomolecules in living
5
Figure I-1. Scheme of formation of ergosterol peroxide from ergosterol in the presence of
6
Chapter II
Experimental
7
II-1. Samplllle preparation
A wild-type (WT) strain of Schizosaccharomyces pombe and its mutant that cannot
produce CoQ10 due to disruption in the p-hydroxybenzoate polyprenyl diphosphate
transefrase gene [11], (denoted ∆ppt1) were kindly provided by Profs. M. Kawamukai and T.
Yamamoto of Shimane University. The WT and ∆ppt1 S. pombe strains were pre-cultured at
30 ºC on a YES plate containing yeast extract (5 g/L), glucose (30 g/L), agar (17 g/L), and
amino acids including adenine, histidine, leucine, uracil, and lysine (50 mg/L each). After 3–5
days of cultivation, a large number of colonies of the WT and ∆ppt1 strains were found
spreading on the YES plate (Figure II-1). A single colony of the WT and ∆ppt1 strains was
harvested from the YES plate and transferred into Pombe Mineral Leucine Uracil (PMLU)
medium, which is a minimum nutrition medium with leucine and uracil (75 mg/L each). The
PMLU medium was supplied with five different antioxidants—glutathione (abbreviated as
GSH), (R)-(+)-lipoic acid (RLA), ascorbic acid (Vit C), and an inclusion complex of
(R)-(+)-lipoic acid in γ-cyclodextrin (RLA/γCD)—at 0.5 mM. All the antioxidants were completely dissolved in the medium. The instant when the single colony was added into the
fresh PMLU medium with an antioxidant was defined as time zero and Raman spectroscopic
measurement commenced. A 200 µL of the prepared sample was then transferred onto a poly-D-lysine coated glass-bottomed dish (MatTek; P35GC-1.5-10-C).
RLA and RLA/γ-cyclodextrin were provided by CycloChemBio. GSH and Vit C were commercially obtained from Sigma. All the chemicals were used as received. The chemical
structures of the antioxidants (RLA, GSH, and Vit C) and γ-CD are shown in Figure II-2. RLA (Figure II-2a) can be reduced to dihydrolipoic acid, thereby showing the antioxidant
effects [23]. GSH (Figure II-2b) is a tripeptide containing a thiol group as a reducing agent. In
acting as an antioxidant, GSH is converted to its oxidized form, glutathione disulfide (GSSG)
[24]. L-Ascorbic acid (Figure II-2c), also known as vitamin C, is a common food additive that
8
RLA is much less soluble in water. To improve the aqueous solubility of RLA, an inclusion
complex of RLA with γ-CD was also used in this study. As shown in Figure II-2d, γ-CD is a cyclic oligosaccharide that consists of 8 glucose monomers via α-1,4 linkages. It forms a toroid shape with an inner diameter of ≈9 nm in which a guest molecule can be
accommodated.
II-2. Laboratory-built confocal Raman microspectrometer
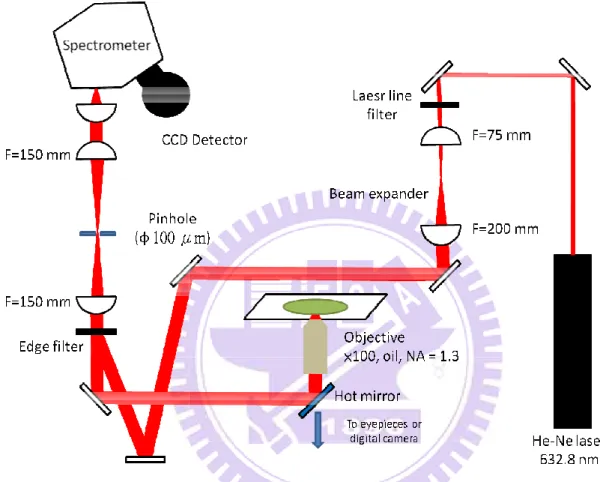
Figure II-3 is a schematic illustration of the laboratory-built confocal Raman
microspectrometer [14, 15] used in this study. The 632.8 nm output of a He-Ne laser
(Thorlabs; HRR170) was used as the Raman excitation source. The laser beam was magnified
by a factor of ~2.67 in order to effectively cover the exit pupil of the objective used and to
better use a high NA of the objective. The expanded laser beam was introduced to a
custom-made inverted microscope (Nikon; TE2000-U) by an edge filter (Semrock;
LP02-633RU-25) and a hot mirror (Thorlabs; FM02). The laser beam was focused on the
sample cell by an oil-immersion objective (Nikon; CFI Plan Fluor; 100× oil, NA=1.3) placed
on the microscope stage, and backward scattered light was collected by the same objective.
The backward scattered light was guided along the opposite direction to the incoming path.
The Rayleigh scattering and anti-Stokes Raman scattering were rejected by the edge filter and
only Stokes Raman scattering was transmitted. Then the Stokes Raman scattered light was
focused on a 100 µm pinhole by a 150-mm lens and then collimated by another 150-mm lens. With the use of the 100 µm pinhole and two 150 mm lenses for a confocal configuration, spatial resolution of 308 (±7) nm in lateral (XY) direction and 3.23 (±0.09) µm in axial (Z) direction was achieved. The Stoke Raman scattered light was introduced to a spectrometer
(HORIBA Scientific; iHR320) and detected by a liquid nitrogen-cooled charge-coupled
device (CCD) detector (Princeton Instruments; Spec-10:100) with 100 × 1340 pixels
9
was ≈7 cm−1, which was high enough in this work because the Raman spectra of biological samples usually exhibit relatively broad vibrational bands. This grating can cover a wide
spectral range over the fingerprint region (>2000 cm-1). For bright-field observation, the sample was illuminated by a halogen lamp (or a mercury lamp) and optical micrographs were
acquired by a digital camera (Nikon; DS-Ril) mounted on the microscope.
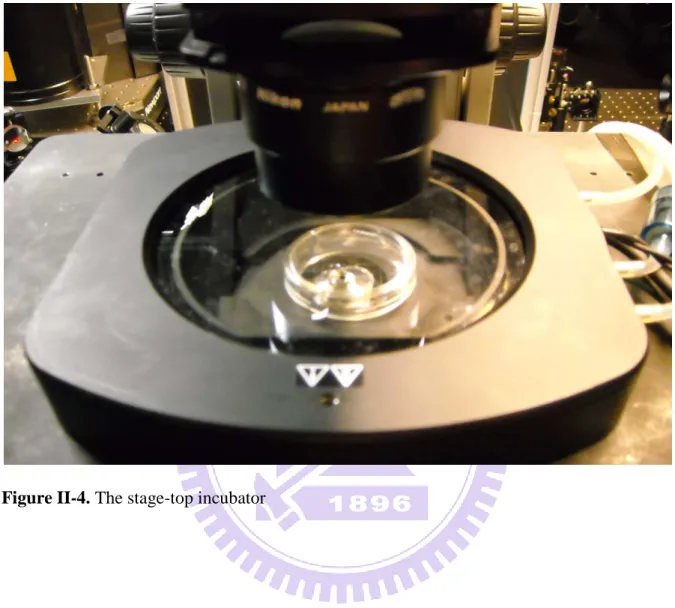
The laboratory-built confocal Raman microspectrometer can also be equipped with a
3-axis piezoelectric stage (PI; P-563.3CD) or a stage-top incubator (Figure II-4) [16] (Tokai
Hit; INU-ONICS-F1) on the microscope stage. The 3-axis piezoelectric stage can translate the
sample both horizontally and vertically and was used to determine the spatial resolution of our
confocal Raman microscope (see the next paragraph). The piezoelectric stage was controlled
by a computer program based on LabVIEW (National Instruments). The stage-top incubator
was used to keep the experimental environment including temperature and air flow more
stable. It can control the temperature by four independent heaters—stage, top, bath, and lens
heaters—and the air flow by a gas-flow device (dry air). The set temperatures of the stage, top,
bath, and lens heaters were, respectively, 30, 31.5, 30, and 35 ºC, making the sample
temperature kept ≈30 ºC. This incubator can prevent the sample from drying and maintain the
same culture conditions, allowing us to perform long experiments.
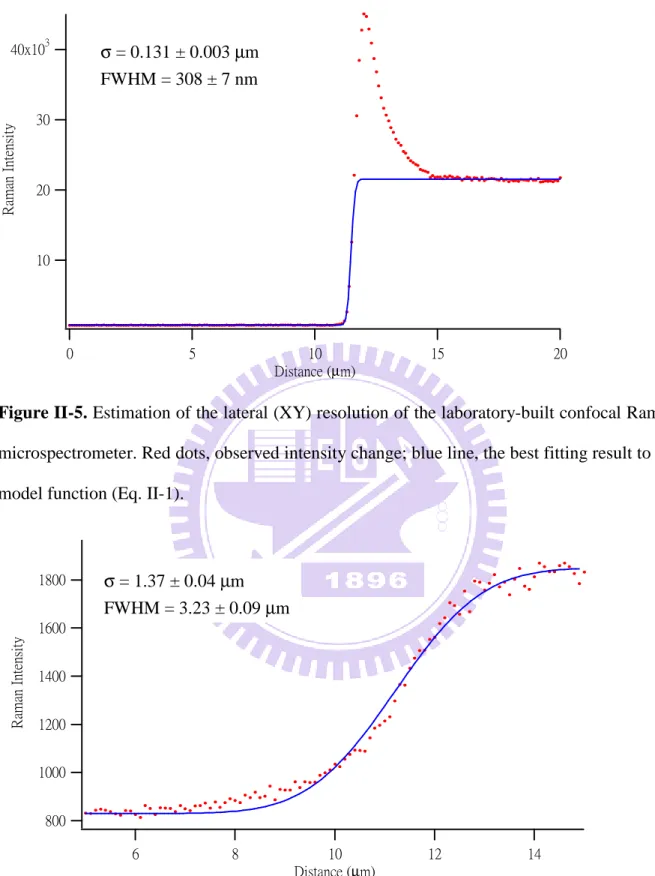
Figures II-5 and II-6 show the calibration results of the lateral (XY) and axial (Z)
resolutions of our confocal Raman microspectrometer. To estimate the lateral resolution, the
laser spot was scanned horizontally across a sharp edge of a silicon wafer using the intensity
of the 520 cm−1 phonon band of silicon. Similarly, to estimate the axial resolution, the intensity rise of the 1019 cm−1 band of indene at an indene–glass interface was measured. By scanning the laser spot continuously to cross the edge or the interface assumed to be infinitely
sharp, a plot of the intensity of the band (either 520 or 1019 cm−1) versus the scanned distance was obtained and it was fitted to a model function f(x). f(x) is a Heaviside step function
10
( )
x N erf x a C f + − + =σ
2 1 2 (Eq. II-1)where erf denotes the error function, N is a normalization constant, a is the onset of the step
function,
σ
is the width of Gaussian function, C is a constant. The full width at half maximum (FWHM) is equal to (Eq. II-2):σ 2 ln 2 2 = FWHM (Eq. II-2)
Therefore, the fitting results show that the spatial resolution was about 308 ± 7 nm in the
lateral direction and 3.23 ± 0.09 µm in the axial direction. Here the error bars represent fitting precision.
II-3. Experimental conditions in Raman measurements
Yeast cells were cultured in PMLU medium in a shaking incubator at 30 ºC. Growth
curves were measured by using a cell counting chamber [16] (Marienfeld; 06 401 30). The
yeast cells were immobilized well on the poly-D-lysine coated glass-bottomed dish. The
excitation laser power was 3.7 mW. The exposure time for each spectrum was 5 s. About
60–70 Raman spectra could be measured in 1 h and the sample dish was replaced every 1 h by
a new one that was prepared in exactly the same manner. At each measurement time, a total of
200 Raman spectra were acquired from 200 different S. pombe cells.
II-4. Singular value decomposition analysis
In our experiment, we measured a large number of Raman spectra (200 spectra) so we
needed to shorten the exposure time (5 s for each spectrum). To improve the signal-to-noise
ratio in the spectra acquired with such a short exposure time, singular value decomposition
(SVD) analysis was performed [14-15, 18-20]. SVD is a mathematical technique that
factorizes an arbitrary m × n matrix A into the product of three matrices as Eq. II-3 [21].
11
Here U is an m × n column-orthonormal matrix; W is an n × n diagonal matrix of positive
singular values, and V is an n × n orthonormal matrix. U and V represent the spectral and
positional matrices, respectively. We only retained components of U and V having
significantly large singular values to reproduce matrix A, because other components with
much smaller singular values contribute to the original data negligibly and can be regarded as
noises. Then we reconstructed matrix A by using those components that have significantly
large singular values. The number of singular values used for reconstruction depends on the
data set, but it was less than 10 in all cases. The SVD was computed in Igor Pro
12
13
Figure II-2. Chemical structures of (a) (R)-(+)-lipoic acid (RLA), (b) glutathione (GSH), (c)
Figure II-3. Schematic of the laboratory
14
15
16
Figure II-5. Estimation of the lateral (XY) resolution of the laboratory-built confocal Raman
microspectrometer. Red dots, observed intensity change; blue line, the best fitting result to the
model function (Eq. II-1).
Figure II-6. Estimation of the axial (Z) resolution of the laboratory-built confocal Raman
microspectrometer. Red dots, observed intensity change; blue line, the best fitting result to the
model function (Eq. II-1).
40x103 30 20 10 R am an I nt en si ty 20 15 10 5 0 Distance (µm) 1800 1600 1400 1200 1000 800 R ama n In te ns it y 14 12 10 8 6 Distance (µm) σ = 0.131 ± 0.003 µm FWHM = 308 ± 7 nm σ = 1.37 ± 0.04 µm FWHM = 3.23 ± 0.09 µm
17
Chapter III
18
III-1. Growth curves
The growth curves of the WT and ∆ppt1 yeast strains in PMLU medium are shown in
Figure III-1A. The WT strain can reach stationary phase after 30 h culture. In contrast, the
∆ppt1 strain cannot grow well in PMLU medium primarily due to the deficiency in CoQ10
production. It grows much more slowly than WT and even after 80 h culture, it seems not to
reach stationary phase yet. As can be seen from Figure III-1B, however, addition of the
antioxidants (RLA, GSH, Vit C, and RLA/γ-CD) was found to improve the growth of the
∆ppt1 mutant.
The cell growth was recovered in all cases, but the extent of recovery depends on
antioxidants. The effect is smallest for Vit C. The cell density of the ∆ppt1 strain after 3 days
of culture treated with RLA is similar to that of the WT strain, but the growth rate is still
much smaller. There is no notable difference in growth curve between RLA and RLA/γ-CD; the two growth curves look nearly identical. GSH shows the largest recovery in terms of both
final cell density and growth rate. Although the ∆ppt1 strain treated with GSH takes
somewhat longer time (about 50 h) to reach stationary phase than the WT strain, it indeed
eventually grows to the same level as the WT strain. Based on the growth curves, we
conclude that the recovery of cell growth increases in the order of Vit C, RLA (RLA/γ-CD), and GSH. This order is thought to reflect, at least to some extent, the strength of antioxidant
activity. Similar restoration of the cell growth of another mutant (∆dps1) by addition of
CoQ10/γ-CD complex has recently been reported by Nishida et al [22].
III-2. In vivo quantitative Raman assessment of the effects of antioxidants in fission yeast III-2-1. Raman spectra of the WT and ∆∆∆∆ppt1 strains
As shown above, the growth characteristics can clearly show the effect of the
antioxidative reagents. However, the cell number does not provide any information on the
19
the ∆ppt1 strain (e.g., metabolic activity) and results in a better growth. In this study, we used
Raman microspectroscopy to understand the effect of antioxidants at the molecular level and
to assess their antioxidant activity quantitatively in living cells.
Figure III-2 displays typical Raman spectra of the WT and ∆ppt1 strains. Each
spectrum is the average of 200 spectra measured from 200 different cells of either WT
or ∆ppt1 strain. It is important to collect data on a large number of cells in order to extract
information through statistics that is not affected by cell individuality. The two spectra have
been normalized to the area intensity of the 1440 cm−1 band (see Table III-1 for assignment of this band). Because the intracellular space is highly heterogeneous with many organelles and
biomolecules, the observed Raman spectral pattern, in general, depends greatly on the
location from which the spectrum is measured, namely, where the laser is focused. Here we
focused the excitation laser on lipid droplets inside yeast cells (usually visible as tiny black
spots under the microscope). Lipid droplets are composed of the core of neutral lipids such as
triacylglycerols and sterol esters surrounded by a phospholipid monolayer, so they are rich in
lipids.
Several representative Raman bands are observed at 1744, 1655, 1602, 1440, 1300,
1154, and 1003 cm−1 in both WT and ∆ppt1 spectra. The assignments [3] of these and other
Raman bands can be found in Table 1. The averaged normalized Raman spectra of the WT
and ∆ppt1 strains are quite similar to each other, except for the 1602 cm−1 band. The intensity of this band is much weaker in the ∆ppt1 strain than in WT. As already mentioned in Chapter
I, this Raman band is unique in that it sharply reflects the metabolic activity of yeast cells [2,
4, 16], and it has recently been shown to arise mainly from the conjugated C=C stretching of
ergosterol [7] (see Figure I-1). Because the ∆ppt1 strain is unable to synthesize CoQ10 by
itself, their ability to reduce the level of intracellular reactive oxygen species (ROS) is
considered weaker than WT. Note that CoQ10 also has antioxidant activity. In the presence of
20
C=C structure of ergosterol will be disrupted as shown in Figure I-1. Consequently, the
intensity of the 1602 cm−1 band will decrease. If this is the case, the intensity of the 1602 cm−1 band should recover when intracellular oxidative stress caused by ROS is reduced by e.g.,
adding antioxidative reagents externally to the cell.
III-2-2. Raman intensity changes with external addition of antioxidants to the ∆∆∆∆ppt1
strain
To study the effects of exogenous antioxidants on the Raman spectrum of the ppt1
strain, we measured lipid-droplet Raman spectra from 200 living ppt1 cells grown for 10 h
in the medium to which the antioxidant (RLA, GSH, Vit C, or RLA/γ-CD) was added. We obtained Raman data exclusively from lipid droplets because their Raman spectrum usually
exhibits strong 1602 cm−1 band compared with the cytoplasm. Figure III-3 shows the average of 200 spectra for ∆ppt1 cells with and without the addition of antioxidants. The five averaged
spectra have been normalized to the area intensity of the 1440 cm−1 band.
In all cases, the treatment with the antioxidant caused a significant increase in the
intensity of the 1602 cm−1 band relative to the control (antioxidant-untreated ∆ppt1). We do
not see such a drastic change in other Raman bands. To see this more quantitatively, we plot
the number of spectra that give a certain intensity ratio to the 1440 cm−1 band as histograms for the bands at 1602, 1655, 1300, and 1003 cm−1 (Figure III-4–7). These figures compare the distributions of 200 spectra obtained from WT, untreated ∆ppt1 (control), and ∆ppt1 treated
with RLA, GSH, Vit C, and RLA/γ-CD. The distributions do not deviate much from the normal distribution. Assuming the normal distribution, we calculated the mean of each
distribution and its standard deviation (n = 200), which are also reported in Figure III-4–7.
First, let us focus on the 1602 cm−1 band (Figure III-4). As discussed above, the mean of the intensity ratio A1602/A1440, of the ∆ppt1 strain is about three times smaller than that of WT
21
double the untreated control value. The mean of the ratios A1602/A1440 is even larger for the
∆ppt1 cells treated with GSH. Upon treatment, it increases by a factor of ≈3.7 and becomes
almost the same as WT. In fact, among the four antioxidative reagents tested, GSH showed
the most prominent recovery of the 1602 cm−1 band. In contrast, the effect of adding Vit C was found to be little. The trend in the recovery of the band intensity at 1602 cm−1 agrees very well with our growth curve results (see the previous section). The ability of antioxidant to
regain the intensity of the 1602 cm−1 band is strongest for GSH, moderate for RLA, and weakest for Vit C. An important point to note here is that using the Raman band at 1602 cm−1, we have been able to assess the activity of antioxidants in vivo and at the molecular level. It is
not possible with either growth curve measurements or ordinary biochemical approaches.
We suspected the moderate antioxidant activity of RLA is due to the low solubility of
RLA in water, so we also tried a complex of RLA with γ-cyclodextrin (RLA/γ-CD). In the complex, hydrophobic RLA is included in the inner cavity of γ-CD and the outer hydrophilic part makes the guest molecule solubilized in aqueous environment. Nevertheless, we observed
no significant difference in the mean value of the intensity ratio A1602/A1440 between treatment
with RLA alone and with RLA/γ-CD. This may be because all RLA was dissolved even without using γ-CD complex at concentration as low as 0.5 mM.
The behavior of the protein and lipid Raman bands is quite different from that of the
1602 cm−1 band. The intensity ratios of the 1655 (Figure III-5), 1300 cm−1 (Figure III-6), and 1003 cm−1 (Figure III-7) bands to the 1440 cm−1 band do not vary significantly with antioxidant treatment; the variation is within experimental uncertainties. This result clearly
indicates that only the ergosterol band at 1602 cm−1 is sensitive to the treatment with antioxidants and can be used as a probe of the antioxidative effects.
To check the reproducibility of the trend, we performed the whole set of measurements
(WT, untreated ∆ppt1, and antioxidant-treated ∆ppt1 strains) in triplicate. More specifically,
22
200 cells in each measurement. Results are shown in Figure III-8. The overall trend in the
effect of the antioxidants is fully consistent with what we have discussed on the basis of
Figures III-4–7.
III-3. Time-lapse Raman measurements
We now have shown by looking into the Raman spectra measured after 10 h of culture,
that the intensity of the 1602 cm−1 band of the ∆ppt1 yeast strain can be improved by external
addition of the antioxidants (Figure III-3). This phenomenon should be dynamic in nature,
and it is crucially important to study its temporal behavior. Therefore, we tried to do
time-lapse experiments in which the change in Raman spectrum was monitored at different
culture times after the antioxidant was added.
We measured 100 Raman spectra of the ∆ppt1 cells with and without addition of RLA
and GSH at 0.5 mM to the medium at different culture times (0, 3, 7, 10, 15, 22, and 30 h). A
time-stream of the averaged (but unnormalized) Raman spectra is shown for the control
(untreated ∆ppt1), ∆ppt1 treated with RLA, and ∆ppt1 treated with GSH in Figure III- 9, 10,
and 11, respectively. At 0 h, the ∆ppt1 strain showed almost no signal at 1602 cm−1 (Figure III-9). The 1602 cm−1 band emerged at 7 h and remains nearly constant for more than 20 h afterward. Note that the intensity of the 1602 cm−1 band slightly increased after long incubation even in the absence of an antioxidant. However, it increased with time more
markedly when the ∆ppt1 cells were treated with RLA (Figure III-10) and GSH (Figure
III-11). To better see the time evolution, we plot the averaged band intensity ratio A1602/A1440
as a function of culture time (Figure III-12). We can see a drastic increase in the ratio at
around 10 h for RLA and GSH. This finding indicates that it took about 10 h for the added
antioxidant to become effective. The ratio for the untreated ∆ppt1 strain decayed gradually
after 10 h, whereas that for the RLA- or GSH-treated strains increased by about 20–30 times.
23
time as much as the 1602 cm−1 band (Figure III-13). The marked increase at 10 h can also be seen from histograms of the intensity ratio A1602/A1440 shown in Figure III-14. In both cases of
RLA and GSH, the distribution shifts to a higher ratio on going from 3 h to 10 h.
III-4. Conclusion
The key findings are summarized as follows:
(1) Presumably because of the disruption of gene responsible for CoQ10 production, the
∆ppt1 strain of fission yeast may have less resistance to intracellular oxidative stress
induced by ROS. It showed much weaker 1602 cm−1 band intensity than the WT strain (Figure III-2).
(2) Adding antioxidants to the medium in which the ∆ppt1 strain was grown recovered the
intensity of the 1602 cm−1 band (Figure III-4). However, similar effects of the antioxidants were not observed for other Raman bands at 1655, 1300, and 1003 cm−1 (Figures III-5-7).
(3) The antioxidant activity in living fission yeast cells evaluated by using the diminished
1602 cm−1 band of ∆ppt1 was found to be strongest for GSH (about 2.8-fold increase
with respect to the untreated control), moderate for RLA and RLA/γ-CD (about 2-fold increase), and very weak for Vit C (1.2-fold increase).
(4) Time-lapse Raman measurements on the ∆ppt1 cells treated with RLA and GSH clearly
revealed that the intensity of the 1602 cm−1 band begins to increase approximately 10 h after the addition and keeps growing up to 30 h.
Together, we have demonstrated that Raman microspectroscopy can be used as a novel
quantitative tool for assessing the efficacy of various antioxidants in vivo. It is still unclear
why only the ergosterol band recovers when cells are treated with antioxidants and other
protein and lipid bands do not. More spectroscopic as well as biological experiments will be
24
Table III-1. Assignments [3] of representative vibrational bands observed in the Raman
spectrum of S. pombe
.
Peak position (cm−1) Assignment
715 Phospholipid headgroup
782 DNA/RNA
1003 Ring breathing of phenylalanine residues
1083 Antisymmetric CCC stretching
1154 C–C and C–N stretching
1266 C=C–H in-plane bend of the cis –CH=CH– linkage
Amide III mode of proteins
1300 In-plane CH2 twisting mode
1340 CH2 bending of the aliphatic chain of proteins
1440 CH2 scissoring and CH3 degenerate deformation
1602 Mainly conjugated C=C stretch of ergsterol [9]
1655 cis-C=C stretching of the unsaturated lipid chains
Amide I mode of proteins
25
Figure III-1. (A) Growth curves of the WT (black) and untreated ∆ppt1 strains (red). (B)
growth curves of the untreated ∆ppt1 strain (red) and that treated with RLA (green), GSH
(blue), Vit C (purple), and RLA/γ-CD (orange).
6.5 6.0 5.5 5.0 4.5 lo g( N o. o f ce ll / 1 m L ) 80 60 40 20 0 Time (hr)
WT
ppt1
∆
6.5 6.0 5.5 5.0 4.5 lo g( N o. o f ce ll s/ 1 m L ) 80 60 40 20 0 Time (hr) ∆ppt1 RLA GSH Vit C RLA/γCDA
B
26
Figure III-2. Averaged Raman spectra (n = 200) of the WT (black) and ∆ppt1 strain (red).
The spectra have been normalized to the area intensity of the 1440 cm−1 band.
1200 1000 800 600 400 In te ns it y 1800 1600 1400 1200 1000 800 600 Raman shift (cm-1)
ppt1
WT
∆
1744
1655
1602
1440
1300
1003
27
Figure III-3. Averaged Raman spectra (n = 200) of the untreated ∆ppt1 strain (red) and the ∆ppt1 strains treated with 0.5 mM RLA (green),0.5 mM GSH (blue), 0.5 mM Vit C (purple), and 0.5 mM RLA/γ-CD (orange).
2000
1800
1600
1400
1200
1000
800
600
400
In
te
ns
it
y
1800
1600
1400
1200
1000
800
600
Raman shift (cm
-1)
ppt1
RLA
GSH
Vit C
RLA/ CD
γ
∆
28
Figure III-4. Histograms of the ratio of the area intensity of the 1602 cm−1 band to the 1440 cm−1 band, A1602/A1440. The number of bins is 20 and the bin width is 0.02. Yellow lines
represent the mean value of 200 spectra. Also indicated are mean ± standard deviation and median (minimum–maximum). 30 25 20 15 10 5 0 N o. o f sp ec tr a 0.40 0.30 0.20 0.10 0.00 A1602/A1440 WT 0.18±0.06 0.18 (0.07 - 0.33) 50 40 30 20 10 0 N o. o f sp ec tr a 0.40 0.30 0.20 0.10 0.00 A1602/A1440
ppt1
0.06±0.04∆ 0.05 (0.00 - 0.21) 30 25 20 15 10 5 0 N o. o f sp ec tr a 0.40 0.30 0.20 0.10 0.00 A1602/A1440 RLA 0.12±0.05 0.12 (0.00 - 0.30) 35 30 25 20 15 10 5 0 N o. o f sp ec tr a 0.40 0.30 0.20 0.10 0.00 A1602/A1440 GSH 0.22±0.06 0.21(0.04 - 0.37) 40 30 20 10 0 N o. o f sp ec tr a 0.40 0.30 0.20 0.10 0.00 A1602/A1440 Vit C 0.09±0.04 0.10 (0.00 - 0.21) 40 30 20 10 0 N o. o f sp ec tr a 0.40 0.30 0.20 0.10 0.00 A1602/A1440 RLA/ CD 0.13±0.04 γ 0.13 (0.00 - 0.22)29
Figure III-5. Histograms of the ratio of the area intensity of the 1655 cm−1 band to the 1440 cm−1 band, A1655/A1440. The number of bins is 20 and the bin width is 0.03. Yellow lines
represent the mean value of 200 spectra. Also indicated are mean ± standard deviation and
median (minimum–maximum). 35 30 25 20 15 10 5 0 N o. o f sp ec tr a 0.70 0.60 0.50 0.40 0.30 0.20 0.10 A1655/A1440 WT 0.41±0.09 0.40 (0.22 - 0.67) 80 60 40 20 0 N o. o f sp ec tr a 0.70 0.60 0.50 0.40 0.30 0.20 0.10 A1655/A1440
ppt1
0.31±0.02 0.31 (0.25 - 0.41) ∆ 50 40 30 20 10 0 N o. o f sp ec tr a 0.70 0.60 0.50 0.40 0.30 0.20 0.10 A1655/A1440 RLA 0.36±0.05 0.35 (0.62 - 0.26) 100 80 60 40 20 0 N o. o f sp ec tr a 0.70 0.60 0.50 0.40 0.30 0.20 0.10 A1655/A1440 GSH 0.35±0.02 0.35 (0.27 - 0.41) 50 40 30 20 10 0 N o. o f sp ec tr a 0.70 0.60 0.50 0.40 0.30 0.20 0.10 A1655/A1440 Vit C 0.34±0.05 0.33 (0.23 - 0.53) 100 80 60 40 20 0 N o. o f sp ec tr a 0.70 0.60 0.50 0.40 0.30 0.20 0.10 A1655/A1440 RLA/ CD 0.31±0.02 γ 0.30 (0.26 - 0.38)30
Figure III-6. Histograms of the ratio of the area intensity of the 1300 cm−1 band to the 1440 cm−1 band, A1300/A1440. The number of bins is 20 and the bin width is 0.025. Yellow lines
represent the mean value of 200 spectra. Also indicated are mean ± standard deviation and
median (minimum–maximum). 40 30 20 10 0 N o. o f sp ec tr a 0.50 0.40 0.30 0.20 0.10 A11300/A1440 WT 0.33±0.06 0.31 (0.20 - 0.54) 50 40 30 20 10 0 N o. o f sp ec tr a 0.50 0.40 0.30 0.20 0.10 A1300/A1440
ppt1
0.31±0.05∆ 0.31(0.16 - 0.54) 100 80 60 40 20 0 N o. o f sp ec tr a 0.50 0.40 0.30 0.20 0.10 A1300/A1440 RLA 0.23±0.02 0.23 (0.19 - 0.38) 80 60 40 20 0 N o. o f sp ec tr a 0.50 0.40 0.30 0.20 0.10 A1300/A1440 GSH 0.23±0.02 0.23 (0.13 - 0.29) 80 60 40 20 0 N o. o f sp ec tr a 0.50 0.40 0.30 0.20 0.10 A1300/A1440 Vit C 0.21±0.03 0.22 (0.08 - 0.27) 120 100 80 60 40 20 0 N o. o f sp ec tr a 0.50 0.40 0.30 0.20 0.10 A1300/A1440 RLA/ CD 0.21±0.02 γ 0.21 (0.15 - 0.28)31
Figure III-7. Histograms of the ratio of the area intensity of the 1003 cm−1 band to the 1440 cm−1 band, A1003/A1440. The number of bins is 20 and the bin width is 0.005. Yellow lines
represent the mean value of 200 spectra. Also indicated are mean ± standard deviation and
median (minimum–maximum). 30 25 20 15 10 5 0 N o. o f sp ec tr a 100x10-3 80 60 40 20 0 A1003/A1440 WT 0.029±0.015 0.026 (0.006 - 0.083) 50 40 30 20 10 0 N o. o f sp ec tr a 100x10-3 80 60 40 20 0 A1003/A1440
ppt1
∆ 0.015±0.007 0.015 (0.000 - 0.045) 70 60 50 40 30 20 10 0 N o. o f sp ec tr a 100x10-3 80 60 40 20 0 A1003/A1440 RLA 0.012±0.006 0.011 (0.002 - 0.041) 100 80 60 40 20 0 N o. o f sp ec tr a 100x10-3 80 60 40 20 0 A1003/A1440 GSH 0.010±0.004 0.009 (0.001 - 0.022) 60 40 20 0 N o. o f sp ec tr a 100x10-3 80 60 40 20 0 A1003/A1440 Vit C 0.011±0.006 0.009 (0.000 - 0.034) 60 50 40 30 20 10 0 N o. o f sp ec tr a 100x10-3 80 60 40 20 0 A1003/A1440 RLA/ CDγ 0.012±0.005 0.012 (0.000 - 0.029)32
A.
B.
C.
D.
Figure III-8. Bar graphs of the averaged intensity ratio of the 1602 (A), 1655 (B), 1300 (C),
and 1003 (D) cm−1 bands to the 1440 cm−1 band.
0.00 0.10 0.20 0.30 0.40
WT Dppt1 RLA GSH Vit C RLA/gCD
R a ti o t o 1 4 4 0 c m -1 bandarea of 1602 cm-1 ***P<0.001 0.00 0.10 0.20 0.30 0.40
WT Dppt1 RLA GSH Vit C RLA/gCD
R a ti o t o 1 4 4 0 c m -1 bandarea of 1655 cm-1 ***P<0.001 0.00 0.10 0.20 0.30 0.40
WT Dppt1 RLA GSH Vit C RLA/gCD
R a ti o t o 1 4 4 0 c m -1 bandarea of 1300 cm-1 ***P<0.001 0.000 0.005 0.010 0.015 0.020 0.025
WT Dppt1 RLA GSH Vit C RLA/gCD
R a ti o t o 1 4 4 0 c m -1 bandarea of 1003 cm-1 ***P<0.001
33
Figure III-9. Time-lapse Raman spectra (n =100) of the untreated ∆ppt1 strain obtained 0 h
(red), 3 h (orange), 7 h (green), 10 h (blue), 15 h (purple), 22 h (mulberry), and 30 h (brown).
2200
2000
1800
1600
1400
1200
1000
800
600
400
200
0
R
am
an
I
nt
en
si
ty
1800
1600
1400
1200
1000
800
600
Raman shift (cm
-1)
30 h
22 h
15 h
10 h
7 h
3 h
0 h
without antioxidant
34
Figure III-10. Time-lapse Raman spectra (n = 100) of the ∆ppt1 strain treated with 0.5 mM
RLA obtained 0 h (red), 3 h (orange), 7 h (green), 10 h (blue), 15 h (purple), 22 h (mulberry),
and 30 h (brown) after addition of RLA.
2400
2200
2000
1800
1600
1400
1200
1000
800
600
400
200
0
R
am
an
i
nt
en
si
ty
1800
1600
1400
1200
1000
800
600
Raman shift (cm
-1)
0 h
3 h
7 h
10 h
15 h
22 h
30 h
add 0.5 mM RLA
35
Figure III-11. Time-lapse Raman spectra (n = 100) of the ∆ppt1 strain treated with 0.5mM
GSH obtained 0 h (red), 3 h (orange), 7 h (green), 10 h (blue), 15 h (purple), 22 h (mulberry),
and 30 h (brown) after addition of GSH.
2400
2200
2000
1800
1600
1400
1200
1000
800
600
400
200
0
R
am
an
i
nt
en
si
ty
1800
1600
1400
1200
1000
800
600
Raman shift (cm
-1)
0 h
3 h
7 h
10 h
15 h
22 h
30 h
add 0.5 mM GSH
36
Figure III-12. Time dependence of the averaged ratio of Raman band area intensity at 1602
cm−1 to that at 1440 cm−1 of the untreated ∆ppt1 (red), ∆ppt1 treated with 0.5 mM RLA
(green), and ∆ppt1 treated with 0.5 mM GSH (blue). 0.25 0.20 0.15 0.10 0.05 0.00 ra ti o 30 25 20 15 10 5 0 Time (hr) A1602/A1440 (add GSH)
A1602/A1440 (add RLA)
37
Figure III-13. Time dependence of the averaged ratio of Raman band area intensity at 1655
(triangle), 1300 (circle), and 1003 (square) cm−1 to that at 1440 cm−1 of the untreated ∆ppt1
(red), ∆ppt1 treated with 0.5 mM RLA (green), and ∆ppt1 treated with 0.5 mM GSH (blue). 0.5 0.4 0.3 0.2 0.1 0.0 ra ti o 30 25 20 15 10 5 0 Time (hr)
A1655/A1440 (non-add) A1655/A1440 (add GSH) A1655/A1440 (add RLA) A1300/A1440 (non-add) A1300/A1440 (add GSH) A1300/A1440 (add RLA) A1003/A1440 (non-add) A1003/A1440 (add GSH) A1003/A1440 (add RLA)
38
A
B
Figure III-14. Histograms of the ratio of Raman band area intensity at 1602 cm−1 to that at 1440 cm−1 3 h (A) and 10 h (B) after addition of the antioxidant (green, RLA; blue, GSH). Yellow lines represent the mean value.
60 40 20 0 N o. o f sp ec tr a 0.20 0.16 0.12 0.08 0.04 0.00 A1602/A1440 RLA / 3 hr 80 60 40 20 0 N o. o f sp ec tr a 0.20 0.16 0.12 0.08 0.04 0.00 A1602/A1440 GSH / 3 hr 25 20 15 10 5 0 N o. o f sp ec tr a 0.20 0.16 0.12 0.08 0.04 0.00 A1602/A1440 RLA / 10 hr 25 20 15 10 5 0 N o. o f sp ec tr a 0.20 0.16 0.12 0.08 0.04 0.00 A1602/A1440 GSH / 10 hr
39
Chapter IV
40
In this study, we used confocal Raman microspectroscopy to measure the effects of
exogenous antioxidants on the CoQ-deficient (∆ppt1) strain of fission yeast. The Raman
intensity of the 1602 cm−1 band, which mainly originates from the conjugated C=C stretch of ergosterol [9], is greatly suppressed in the ∆ppt1 strain. This is most likely because the ∆ppt1 strain cannot lower the level of ROS and ergosterol can potentially be oxidized by
accumulated ROS to form ergosterol peroxide [12, 13], which no longer possesses the
conjugated C=C moiety. Upon addition of antioxidants (RLA, GSH, Vit C, and RLA/γCD), the intensity of the 1602 cm−1 band increased about 2–3 times. However, similar recovery of the band intensity was not observed for other Raman bands at 1655, 1300, and 1003 cm−1, showing that the 1602 cm−1 band is a sensitive probe for intracellular oxidative stress. Time-lapse Raman measurements on the ∆ppt1 cells treated with RLA and GSH clearly
revealed that the intensity of the 1602 cm−1 band begins to increase approximately 10 h after the addition and keeps growing up to 30 h.
However, in these experiments, we did not discuss the effect of the concentration of
exogenous antioxidants on the CoQ-deficient (∆ppt1) strain of fission yeast, so we will
measure the CoQ-deficient (∆ppt1) strain of fission yeast added different concentration
antioxidants. Time-lapse Raman measurements on the ∆ppt1 cells treated with RLA and GSH
clearly revealed that the intensity of the 1602 cm−1 band begins to increase approximately 10 h after the addition and keeps growing up to 30 h. But the intensity of the 1602 cm-1 did not keep a balance, so we will observes the intensity of the 1602 cm-1 after 30 h.
We have thus demonstrated that Raman microspectroscopy can be used as a novel
quantitative tool for assessing the efficacy of various antioxidants in vivo. Although it is still
unclear why only the ergosterol band recovers when cells are treated with antioxidants and
other protein and lipid bands do not, we believe this method will open new possibilities not
41
42
References
[1] H. Sies, Experimental Physiology, Vol. 82, pp. 291-295,1997.
[2] Chaudière J, Ferrari-Iliou R., Food Chem Toxicol, Vol. 37, pp. 949-962,1999.
[3] Y.-S. Huang, T. Karashima, M. Yamamoto, and H. Hamaguchi, Biochemistry, Vol. 44,
pp. 10009-10019, 2005.
[4] Y.-S. Huang, T. Nakatsuka, and H. Hamaguchi, Applied Spectroscopy, Vol. 61,
pp.1290-1294, 2007.
[5] Y. Naito, A. Toh-e, and H. Hamaguchi, Journal of Raman Spectroscopy, Vol. 36, pp.
837-839, 2005.
[6] H. Tang, H. Yao, G. Wang, Y. Wang, Y. Q. Li, and M. Feng, Optics Express, Vol. 15,
pp. 12708-12716, 2007.
[7] V. V. Pully, and C. Otto, Journal of Raman Spectroscopy, Vol. 40, pp. 473-475, 2009.
[8] C. Onogi, H. Torii, and H. Hamaguchi , Chemistry Letters, Vol. 38, pp. 898-899, 2009.
[9] L.-d. Chiu, F. Hullin-Matsuda, T. Kobayashi, H. Torii, and H. Hamaguchi, Journal of
Biophotonics, Vol. 5, pp.724-728, 2012.
[10] K. Suzuki, K. Okada, Y. Kamiya, X. F. Zhu, T. Nakagawa, M. Kawamukai, and H.
Matsuda, Journal of Biochemistry, Vol.121, pp. 496-505,1997.
[11] N. Uchida, K. Suzuki, R. Saiki, T. Kainou, K. Tanaka, H. Matsuda, and M.
Kawamukai, Journal of Bacteriology, Vol.182, pp. 6933-6939, 2000.
[12] J.-S. Lee, C.-M. Ma, D.-K. Park, Y. Yoshimi, M. Hatanaka, and M. Hattori, Biological
and Pharmaceutical Bulletin, Vol.31, pp. 949-954, 2008.
[13] A’. Trigos and A. Ortega-Regules, Mycologia, Vol. 94, pp. 563-568, 2002.
[14] C.-K. Huang, H. Hamaguchi, and S. Shigeto, Chemical Communications, Vol. 47, pp.
9423-9425, 2011.
[15] H. N. N. Venkata, N. Nomura, and S. Shigeto, Journal of Raman Spectroscopy, Vol. 42,
43
[16] Y.-F. Chiu, C.-K. Huang, and S. Shigeto, ChemBioChem, Vol.14, pp. 1001-1005,2013.
[17] S. Ask, P. Barrillon, A. Braem, C. Cheiklali, I. Efthymiopoulos, D. Fournier, C.
Delataille, B. Digirolamo, P. Grafstrom, and C. Joram, Nuclear Instruments and
Methods in Physics Research Section A: Accelerators, Spectrometers, Detectors and Associated Equipment, Vol. 568, pp. 588-600, 2006.
[18] H. N. N. Venkata, N. Nomura, and S. Shigeto, Chemistry and Biology, Vol. 14, pp.
1001-1005, 2012
[19] C.-K. Huang, M. Ando, H. Hamaguchi, and S. Shigeto, Analytical Chemistry, Vol. 84,
pp. 5661-5668, 2012
[20] Y.-T. Zheng, M. Toyofuku, N. Nomura, and S. Shigeto, Analytical Chemistry, Vol. 85,
pp. 7295-7301, 2013
[21] G. H. Golub and C. Reinsch, Numerishche Mathematik, Vol. 14, pp. 403-402, 1970
[22] T. Nishida, T. Kaino, R. Ikarashi, D. Nakata, K. Terao, M. Ando, H. Hamaguchi, and T.
Yamamoto, Journal of Molecular Structure, Vol. 1048, pp. 375-381, 2013
[23] Petersen Shay K, Moreau RF, Smith EJ, Hagen TM., IUBMB Life, Vol. 60, pp.362-367,
2008
[24] Pompella A, Visvikis A, Paolicchi A, De Tata V, Casini AF., Biochem Pharmacol., Vol.
66, pp. 1499-503,2003
[25] McGregor GP, Biesalski HK., Curr Opin Clin Nutr Metab Care., Vol. 9, pp. 697-703,

![Table III-1. Assignments [3] of representative vibrational bands observed in the Raman spectrum of S](https://thumb-ap.123doks.com/thumbv2/9libinfo/8239640.171281/32.892.118.753.195.837/table-assignments-representative-vibrational-bands-observed-raman-spectrum.webp)