Droplet-based electrospray ionization mass
spectrometry for qualitative and quantitative
analysis
Additional supporting information may be found in the online version of this article at the publisher’s web site.
Dear Sir,
Mass spectrometry (MS) is a rapid and sensitive analytical tool that can provide information such as molecular weight and struc-ture.[1,2]One of the fast growingfields in MS in the beginning of this century is the development of ion sources at atmospheric pressure. Speed, simplicity and minimal sample preparation are the main characteristics of these recently developed ion sources at open air.[3–21]Most ion sources are mainly used in qualitative MS analysis. However, quantitative analysis can provide impor-tant information in different analyses, such as in the determina-tion of the level of specific species in natural products[22,23]and the concentration of disease-related biomarkers in biological fluids.[24,25]
Conventionally, chromatography combined with MS can provide reliable quantitative analysis. Nevertheless, newly developed ion sources could be potentially used in quantitative analysis,[15,26–31] such as the use of laser electrospray MS in the quantitative analysis of mixtures of small molecules.[26] Laser diode thermal desorption combined with atmospheric pressure chemical ionization was also used to quantify sulfonamide resi-dues in dairy milk.[27] Paper spray has been demonstrated its potential in the quantitative analysis of abused drugs.[28]In addi-tion, direct analysis in real-time ionization MS for the quantification of drugs in biological matrixes was also successfully demonstrated.[31]
We previously proposed the contactless atmospheric pressure ionization,[15–19]an ionization method that simply uses a tapered capillary as a sampling tube and a spray emitter. The capillary was placed approximately 1 mm from the front of the orifice of a mass spectrometer without electric contact. Electrospray is mainly in-duced by the high voltage applied on the mass spectrometer to generate gas phase ions. This approach suggests that ionization processes can be induced by the electricfield provided by the mass spectrometer without making any direct electric contact with the emitter. Thus, we used an electronic pipette-operated tip as the emitter to generate the sample spray in the proximity of MS in this study. The electronic pipette can precisely dispense a given volume of droplets with a set interval for multiple ejections. No direct elec-tric contact was made on the pipette tip. Thus, the setup can be easily established with the elimination of any extra accessories by simply placing the electronic pipette in the proximity (~1 mm) of a mass spectrometer. The mass spectra acquired from multiple droplets ejected from the pipette with a given dispensed volume and afixed interval can be readily and quickly obtained. Multiple droplets from the same sample can be ejected in afixed frequency by using one run of the electronic pipette. Thus, multiple analyses from the same sample can be repeatedly and quickly conducted. As a consequence, calibration curves based on the ion intensity of
analytes versus concentration plots can be created for quantitative analysis. Initially, we demonstrated the feasibility of the use of an electronic pipette-operated tip as the emitter to obtain mass spec-tral results from the analytes with a wide mass range. The feasibility of the use of this setup for quantitative analysis was then studied.
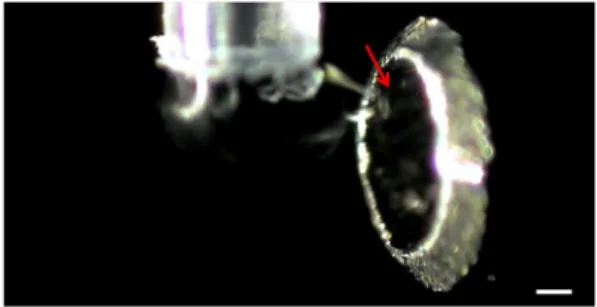
All chemicals were purchased from Sigma Aldrich (St. Louis, MO, USA) except acetonitrile (Merck, Darmstadt, Germany). Urine was collected from a healthy individual. Pipette tips (catalogue no. 15100; inner diameter: 390μm, outer diameter: 570 μm) were purchased from Sorenson BioScience (Salt Lake City, Utah, USA). Scheme 1 shows the experimental setup used in this study. An Avegene electronic pipette (ePipette S20) obtained from the Pacific Image Electronics (New Taipei City, Taiwan) was adapted with a tip loaded with sample solution. This pipette was then placed vertically in front of a Bruker Daltonics Micro-Q-TOF II Focus (Bremen, Germany). The tip end was distanced from the orifice of the mass spectrometer for ~1 mm. The electronic pipette was powered by a lithium-ion chargeable battery (3.7 V). The voltage applied on the orifice of the mass spectrometer was 4000 V, whereas the temperature of the ion transfer capil-lary was set to 220 °C. The pipette can be set to dispense a series of programmed volumes repetitively with a set interval. Gener-ally, 2μl was set for multi-dispensing (×5 or ×10) every 10 s when conducting MS analysis in the study. The auto function was used, and the dwell time was set at 10 s, whereas the speed was set at 9 (full range pickup, 1 s; full range dispense, 1 s; hold at the end, 1 s). Once the trigger was pressed, 5 (or 10) droplets (2μl) were repetitively dispensed every 10 s from the pipette with the set frequency. The generated gas phase ions were readily acquired by the mass spectrometer in real time. Unless specified, the sam-ples were prepared in deionized water, and 1% formic acid was added to the deionized water when preparing the protein samples. We investigated if the sample solution dispensed from the pi-pette was affected by the high electric voltage ( 4000 V) applied on the mass spectrometer (Scheme 1). The image of the droplet ejected from the tip was taken by a camera (Fig. 1). The sample droplet formed a Taylor cone (indicated by a red arrow), which was induced by the electricfield of the mass spectrometer and was observed in front of the orifice of the mass spectrometer. Considering the limited magnification of the camera, we were unable to see the sprayedfine droplets in front of the orifice of the mass spectrometer. Nevertheless, the presence of the Taylor cone indicated that charge accumulation occurred at the edge of the sample droplet.
* Correspondence to: Y.-C. Chen, Department of Applied Chemistry, National Chiao Tung University, Hsinchu 300, Taiwan. E-mail: [email protected]
Received: 15 January 2014 Revised: 20 February 2014 Accepted: 3 March 2014 Published online in Wiley Online Library
(wileyonlinelibrary.com) DOI 10.1002/jms.3355
We further investigated if any ions derived from the sample droplet were generated and were acquired by the mass spec-trometer. Tryptophan ((M + H)+= 205) prepared in deionized water wasfirst selected as the model sample. Multidroplets with a volume of 2μl (×10) were repeatedly ejected from the tip every 10 s. Figure 2(A) shows the resulting plots of total ion current (TIC) chromatogram. A total of 10 peaks representing the 10 dis-pensed droplets from the electronic pipette were observed in the chromatogram, thereby indicating that the analyte ions were successfully generated from this approach. Furthermore, each peak was distanced from the adjacent peak every 10 s, which cor-responds to the set interval between the dispensed droplets. The area of each peak is slightly different from one another, and Fig. 2 (B) shows the corresponding mass spectrum obtained from the plot. Protonated and sodiated tryptophan ions at m/z 205 and m/z 227, respectively, appear in the mass spectrum. The results indicate that the gas phase ions of the analytes can be success-fully generated and detected by the mass spectrometer.
We further used larger biomolecules, such as peptides and pro-teins, as the samples to demonstrate the feasibility of using this approach for the analysis of large biomolecules. Figure 3(A) and (B) shows the plot of TIC obtained from the sample containing bradykinin (10 7M) and its corresponding mass spectrum, respectively. Figure 3(C) and (D) shows the plot of TIC obtained from the sample containing insulin (10 6M) and its correspond-ing mass spectrum, respectively. A total of 10 separated peaks were observed in these plots. The mass spectra were dominated by multiply charged ions as indicated in the mass spectra. The results indicate that the current approach is suitable for use in the analysis of peptides and small proteins. Moreover, like in electrospray ionization (ESI), multiple charged ions dominated the mass spectra. However, the intensity of the ion peaks derived from larger protein such as cytochrome c are much weaker than those observed in the mass spectra of bradykinin and insulin (results not shown). Usually, 1% formic acid was added to the protein solution to facilitate the ionization. The results demon-strate that this approach is also suitable for the analysis of large biomolecules although obtaining ion signals from analytes with lower molecular weights is easier. The choice of solvent is crucial in obtaining a reproducible peak area. Considering the surface tension and volatility, we selected water as the best solvent because of its desirable performance in the experiment. An additional organic solvent helps the ionization process; thus, better results for protein analysis can be obtained. However,
Scheme 1. Setup of the droplet-based electrospray ionization mass spectrometry. The distance between the tip and the orifice of the mass spectrometer was ~1 mm.
Figure 1. Photograph obtained when ejecting a liquid droplet from a pi-pette tip close to the orifice of a mass spectrometer applied with 4000 V. Scale bar, 150μm. The red cursor indicates the formation of Taylor cone. This figure is available in colour online at wileyonlinelibrary.com/journal/jms.
Figure 2. (A) Total ion current chromatogram of tryptophan (10 4M) and (B) its corresponding mass spectrum acquired from the time points between 88.3 and 91.4 s. Ten droplets of the sample solution were dispensed from the pipette tip from every single run.
the reproducibility of the integrated area from peak to peak is not good. When an organic solvent was used, the ion intensity derived from the proteins can be improved, but the peak area from multiple analyses from one run greatly varied. Thus, adding organic solvent for protein analysis to obtain a higher intensity of ion peaks for qualitative analysis is effective. Nevertheless, the results indicate that the detectable upper molecular weight of the analytes when this approach was used is smaller than 20 kDa. To demonstrate the reproducibility of this approach, replicate experiments using the same tip and different tips for droplet-based ESI-MS analysis were conducted. Bradykinin (10 6M) prepared in deionized water was initially used as the model sample. Multidroplets with a volume of 2μl (×5) were repeatedly ejected from the tip every 10 s. Figure S1A, S1B and S1C in the Supporting Information showed the resultant plots of the extracted ion chromatograms (EICs) at m/z 531, standing for the doubly charged ion of bradykinin, using the same tip for three replicates of droplet-based ESI-MS analyses. A total offive peaks representing thefive dispensed droplets from the elec-tronic pipette was observed in these chromatograms. The rela-tive standard deviation (RSD) values derived from the peak area of thefive peaks observed in Fig. S1A, S1B and S1C were esti-mated to be ~7%, ~11% and ~13%, respectively. Figure S2 showed the resultant EICs at m/z 531 using three different tips for the droplet-based ESI-MS analysis. The corresponding RSD values derived from the peak area of thefive peaks observed in Fig. S2A, S2B and S2C were ~7%, ~5% and ~12%, respectively. The RSD values derived from Figs. S1 and S2 were< 15%. The results indicate that the reproducibility for the analysis of aqueous samples using the same tip and different tips for the droplet-based ESI-MS analysis seemsfine.
To show the reproducibility of this approach in complex samples, bradykinin (10 6M) prepared in 50-fold-diluted urine was used as the model sample. Multidroplets with a volume of 2μl (×5) were repeatedly ejected from the tip every 10 s. Figure S3A, S3B and S3C showed the resultant EICs at m/z 531 using the same tip for three replicates of droplet-based ESI-MS analy-ses. The corresponding RSD values derived from the peak area of thefive peaks observed in Fig. S3A, S3B and S3C were 14%, 13% and 10%, respectively. The RSD values are slightly higher than those obtained from aqueous samples. It is understandable because urine is much more complex than aqueous solution. Thus, the ion intensity of the analyte ions obtained from droplet to droplet was varied slightly. Three different tips were also used to examine the reproducibility of the analysis of the urine sample by this current approach (Fig. S4). The RSD values of the peak area from thefive peaks observed in Fig. S4A, S4B and S4C were 14%, 15% and 18%, respectively. The results show that the RSD values from different sets were< 20%, indicating that the repro-ducibility of this approach for the analysis of complex samples seems still all right.
The main advantage of this approach is multiple analyses that can be conducted within a very short period from one run, suggesting the feasibility of using this approach for quantitative analysis. The results obtained from multiple analyses of the same sample from the same run are good for constructing the data points in a quantitative calibration curve. The level of amino acids such as arginine in biologicalfluids in newborns[32,33]can be used as an indication of abnormal metabolism. Thus, we selected argi-nine as the model sample. Because creatiargi-nine is a basic metabo-lite excreted in urine, it was selected as the internal standard. Figure 4(A)–(E) shows the EIC plots obtained from different
Figure 3. (A) Total ion current chromatogram of bradykinin (10 7M) and (B) its corresponding mass spectrum. (C) Total ion current chromatogram of insulin (10 6M) and (D) its corresponding mass spectrum acquired from the time periods of 81.4–88.4 s and 33.3–37.3 s, respectively. Ten droplets of the sample solution were dispensed from the pipette tip from every single run.
concentrations of arginine (m/z 175, green) spiked with a given concentration of creatinine (m/z 114, red). The intensity of the green peaks over that of the red peaks increased with increasing arginine concentration in the sample. Although the peak area slightly varied, the presence of an internal standard in the sample compensated for the variance. Figure 4(F) shows the resultant calibration curve based on the results obtained from Fig. 4(A)–(E). The linear regression (R2≈ 0.993) indicates a desirable linearity. The results suggest that this current approach may be potentially used in quantitative analysis.
In conclusion, we demonstrated a quite straightforward approach involving the use of a tip operated by an electronic pipette as a spray emitter without any extra accessories or elec-tric contact. By placing the tip in front of a mass spectrometer, gas phase ions generated from the droplet that is ejected by the tip can be readily acquired by the mass spectrometer. The results showed that this approach can be used in the analysis of organic molecules, peptides and small proteins. Moreover, we demonstrated the possibility to conduct quantitative analysis by this simple setup. Desalting and concentration are possible with the use of a tip packed with stationary phase. We believe that our approach is potentially suitable in directly characterizing the eluent after treated by stationary phase-packed tips. The time spent in sample transfer and treatment can be reduced. This ap-proach is potentially useful for quantitative analysis and quick characterization of enriched species that are eluted from station-ary phase-packed tips in real time.
Acknowledgement
We thank the National Science Council of Taiwan (NSC 99-2113-M-009-003-MY3) forfinancial support of this research.
Yours,
Song-Yi Wong and Yu-Chie Chen*
Department of Applied Chemistry, National Chiao Tung Univer-sity, Hsinchu 300, Taiwan
References
[1] Y.-C. Chen, P. L. Urban. Time-resolved mass spectrometry. TRAC Trend Anal. Chem. 2013, 44, 106–120.
[2] M. Kandiah, P. L. Urban. Advances in ultrasensitive mass spectrome-try of organic molecules. Chem. Soc. Rev. 2013, 42, 5299–5322. [3] Z. Takáts, J. M. Wiseman, B. Gologan, R. G. Cooks. Mass spectrometry
sampling under ambient conditions with desorption electrospray ionization. Science 2004, 306, 471–473.
[4] R. M. Alberici, R. C. Simas, G. B. Sanvido, W. Romão, P. M. Lalli, M. Benassi, I. B. Cunha, M. N. Eberlin. Ambient mass spectrometry: bringing MS into the real world. Anal. Bioanal. Chem. 2010, 398, 265–294.
[5] A. Hirabayashi, M. Sakairi, H. Koizumi. Sonic spray ionization method for atmospheric pressure ionization mass spectrometry. Anal. Chem. 1994, 66, 4557–4559.
[6] J. Laskin, B. S. Heath, P. J. Roach, L. Cazares, O. J. Semmes. Tissue imaging using nanospray desorption electrospray ionization mass spectrometry. Anal. Chem. 2012, 84, 141–148.
[7] R. Dams, T. Benijts, W. Günther, W. Lambert, A. De Leenheer. Sonic spray ionization technology: performance study and application to a LC/MS analysis on a monolithic silica column for heroin impurity profiling. Anal. Chem. 2002, 74, 3206–3212.
[8] R. B. Cody, J. A. Laramée, H. D. Durst. Versatile new ion source for the analysis of materials in open air under ambient conditions. Anal. Chem. 2005, 7, 2297–2302.
[9] C. N. McEwen, R. G. McKay, B. S. Larsen. Analysis of solids, liquids, and biological tissues using solid probe introduction at atmospheric pressure on commercial LC/MS instruments. Anal. Chem. 2005, 77, 7826–7831.
[10] S. Trimpin, E. D. Inutan, T. N. Herath, C. N. McEwen. Laserspray ioni-zation, a new atmospheric pressure MALDI method for producing highly charged gas-phase ions of peptides and proteins directly from solid solutions. Mol. Cell Proteomics 2009, 9, 362–367. [11] V. G. Santos, T. Regiani, F. F. G. Dias, W. Romão, J. L. P. Jara, C. F. Klitzke,
F. B. Coelho, M. N. Eberlin. Venturi easy ambient sonic-spray ionization. Anal. Chem. 2011, 83, 1375–1380.
[12] P. A. Kottke, F. L. Degertekin, A. G. Fedorov. Scanning mass spec-trometry probe: a scanning probe electrospray ion source for imag-ing mass spectrometry of submerged interfaces and transient events in solution. Anal. Chem. 2010, 82, 19–22.
[13] T.-Y. Chen, J.-Y. Lin, J.-Y. Chen, Y.-C. Chen. Ultrasonication-assisted spray ionization mass spectrometry for the analysis of biomolecules in solution. J. Am. Soc. Mass Spectrom. 2010, 21, 1547–1553. [14] C.-H. Hsieh, A. K. Meher, Y.-C. Chen. Automatic sampling and analysis
of organics and biomolecules by capillary action-supported Figure 4. Extracted ion chromatograms at m/z 175 (arginine, green) and m/z 114 (creatinine, red) obtained from the samples containing arginine with the concentrations of (A) 625 ng/ml, (B) 1250 ng/ml, (C) 2500 ng/ml, (D) 5000 ng/ml and (E) 10 000 ng/ml. Each arginine sample contained creatinine (2μg/ml), which was used as the internal standard. (F) Corresponding calibration curve obtained from the results of Panels (A–E). Ten droplets of the sample solution were dispensed from the pipette tip from every single run.
contactless atmospheric pressure ionization mass spectrometry. PLoS One 2013, 8, e66292.
[15] C.-H. Hsieh, C.-H. Chang, P. L. Urban, Y.-C. Chen. Capillary action-supported contactless atmospheric pressure ionization for the com-bined sampling and mass spectrometric analysis of biomolecules. Anal. Chem. 2011, 83, 2866–2869.
[16] C.-H. Hsieh, C.-S. Chau, K.-K. T. Mong, Y.-C. Chen. Online monitoring of chemical reactions by contactless atmospheric pressure ioniza-tion mass spectrometry. J. Mass Spectrom. 2012, 47, 586–590. [17] T.-J. Lo, C.-H. Chang, Y.-C. Chen. Syringe infusion-based contactless
atmospheric pressure ionization mass spectrometry for small and large biomolecules. Mass Spectrom. Lett. 2012, 3, 87–92.
[18] H.-Y. Huang, T.-J. Lo, Y.-C. Chen, J.-B. Hu, P. L. Urban. Liquid-phase and gas-phase investigation of biomolecules in a single experiment. Anal. Meth. 2013, 5, 5908–5911.
[19] B. Wang, S. Trimpin. High-throughput solvent assisted ionization in-let for use in mass spectrometry. Anal. Chem. 2013. DOI: 10.1021/ ac400867b
[20] P.-H. Li, H. Ting, Y.-C. Chen, P. L. Urban. Recording temporal charac-teristics of convection currents by continuous and segmented-flow sampling. RSC Adv. 2012, 2, 12431–12437.
[21] H. Ting, P. L. Urban. Spatiotemporal effects of a bioautocatalytic chemical wave revealed by time-resolved mass spectrometry. RSC Adv. 2014, 4, 2103–2108.
[22] E. Katz, M. Fon1, R. A. Eigenheer, B. S. Phinney, J. N. Fass, D. Lin, A. Sadka, E. Blumwald. A label-free differential quantitative mass spec-trometry method for the characterization and identification of pro-tein changes during citrus fruit development. Proteome Sci. 2010, 8, 68.
[23] N. Georgelis, J. W. Scott, E. A. Baldwin. Relationship of tomato fruit sugar concentration with physical and chemical traits and linkage of RAPD markers. J. Amer. Soc. Hort. Sci. 2004, 129, 839–845. [24] S. M. Cologna, X.-S. Jiang, P. S. Backlund, C. V. M. Cluzeau, M. K. Dail,
N. M. Yanjanin, S. Siebel, C. L. Toth, H.-S. Jun, C. A. Wassif, A. L. Yergey, F. D. Porter. Type C1 cerebellum identifies protein biomarkers and provides pathological insight. PLoS One 2012, 7, e47845.
[25] H. J. Lee, K. Na, M. S. Kwon, H. Kim, K. S. Kim, Y. K. Paik. Quantitative analysis of phosphopeptides in search of the disease biomarker
from the hepatocellular carcinoma specimen. Proteomics 2009, 9, 3395–3408.
[26] P. M. Flanigan, J. J. Perez, S. Karki, R. J. Levis. Quantitative measure-ments of small molecule mixtures using laser electrospray mass spectrometry. Anal. Chem. 2013, 85, 3629–3637.
[27] P. A. Segura, P. Tremblay, P. Picard, C. Gagnon, S. Sauvé. High-throughput quantitation of seven sulfonamide residues in dairy milk using laser diode thermal desorption- negative mode atmospheric pressure chemical ionization tandem mass spectrometry. J. Agric. Food Chem. 2010, 58, 1442–1446.
[28] Y. Su, H. Wang, J. J. Liu, P. Wei, R. G. Cooks, Z. Ouyang. Quantitative paper spray mass spectrometry analysis of drugs of abuse. Analyst 2013, 138, 4443–4447.
[29] Z. Q. Zhu, J. E. Bartmess, M. E. McNally, R. M. Hoffman, K. D. Cook, L. G. Song. Quantitative real-time monitoring of chemical reactions by autosamplingflow injection analysis coupled with atmospheric pressure chemical ionization mass spectrometry. Anal. Chem. 2012, 84, 7547–7554.
[30] L. J. Corkery, H. Pang, B. B. Schneider, T. R. Covey, K. W. Siu. Auto-mated nanospray using chip-based emitters for the quantitative analysis of pharmaceutical compounds. J. Am. Soc. Mass Spectrom. 2005, 16, 363–369.
[31] S. Yu, E. Crawford, J. Tice, B. Musselman, J.-T. Wu. Bioanalysis without sample cleanup or chromatography: the evaluation and initial imple-mentation of direct analysis in real time ionization mass spectrome-try for the quantification of drugs in biological matrixes. Anal. Chem. 2009, 81, 193–202.
[32] P. R. Goodyer, C. Clow, T. Reade, C. Girardin. Prospective analysis and classification of patients with cystinuria identified in a newborn screening program. J. Pediatr. 1993, 122, 568–572.
[33] D. Marsden, C. Larson, H. L. Levy. Newborn screening for metabolic disorders. J. Pediatr. 2006, 148, 577–584.
Supporting information
Additional supporting information may be found in the online version of this article at the publisher’s web site.