Transient Infrared Absorption Spectra of Reaction Intermediates Detected with a
Step-scan Fourier-transform Infrared Spectrometer
Yu-Hsuan Huang,
aJin-Dah Chen,
aKuo-Hsiang Hsu,
aLi-Kang Chu
b* and Yuan-Pern Lee
a,c*
aDepartment of Applied Chemistry and Institute of Molecular Science, National Chiao Tung University, 1001, Ta-Hsueh Road, Hsinchu 30010, Taiwan
b
Department of Chemistry, National Tsing Hua University, 101, Sec. 2, Kuang-Fu Rd., Hsinchu 30013, Taiwan
c
Institute of Atomic and Molecular Sciences, Academia Sinica, Taipei 10617, Taiwan
(Received: Aug. 9, 2013; Accepted: Sept. 23, 2013; Published Online: Oct. 22, 2013; DOI: 10.1002/jccs.201300415)
Our group has utilized a step-scan FTIR spectrometer operating in the absorption mode to characterize transient species in chemical reactions upon photo-irradiation of gaseous mixtures in a multipass White cell. The operational temporal resolution is typically 1-10 ms with spectral resolution 0.1- 4 cm-1, de-pending on conditions. The acquisition of both ac- and dc-coupled signals enables an extraction of minute changes in the large background signal to attain a typical detectable absorbance variation greater than 1´ 10-4. By consideration of reaction mechanisms and comparison of vibrational wavenumbers, IR intensi-ties, and rotational contours predicted with theoretical calculations, we have assigned IR absorption bands of many important atmospheric free radicals and unstable species including their conformers, such as ClCO, ClSO, ClCS, ClCOOH, CH3SO2, CH3SOO, CH3OSO, CH3SO, CH3OO, CH3C(O)OO, CH2OO C6H5CO, C6H5SO2, and C6H5C(O)OO. The advantages and limitations of this technique to perform spec-tral and kinetic investigations of transient species in chemical reactions are discussed.
Keywords: Step-scan; Fourier-transform infrared spectroscopy; Transient absorption; FTIR; Free radicals.
Special Issue for the 60th Anniversary of Journal of the Chinese Chemical Society
* Corresponding author. Tel: +886-3-5131459; Fax: +886-35713491; Email: [email protected] (L.-K. Chu) and [email protected] (Y.-P. Lee)
Li-Kang Chu: B. S. (2000) and Ph.D. (2006) in chemistry, National Tsing Hua University,
Taiwan. Postdoctoral researcher, Laser Dynamics Lab, Georgia Institute of Technology (2008-2010). Assistant professor, Department of Chemistry, National Tsing Hua Univer-sity, Taiwan (2010-). His main research interests focus on the spectroscopy, kinetics, and ion pumps of the photosynthetic proteins, using various time-resolved approaches includ-ing step-scan FTIR, nanosecond-resolved transient absorption, and electrochemical methods.
Yuan-Pern Lee: B. S. in chemistry, National Taiwan University (1973) and Ph.D. in
chem-istry, University of California, Berkeley (1979). Postdoctoral fellow, Aeronomy Labora-tory, NOAA, Boulder, Colorado. Associate professor (1981-1985) and professor (1985-2004), Chemistry Department, National Tsing Hua University, Taiwan. Adjunct re-search fellow, Institute of Atomic and Molecular Sciences, Academia Sinica (1987- ). Chair professor, Department of Applied Chemistry (2004- ), Dean of Science (2005-2008), and Director of Center for Interdisciplinary Science (2006- ), National Chiao Tung University. The main research topics pursued concern spectroscopy, kinetics and dynamics of free radicals or unstable species, using diverse methods including step-scan time-resolved FTIR (emission or absorption), matrix isolation using p-H2,
cav-ity ringdown, IR-VUV photoionization, and ultrafast lasers. He has identified more than 70 new free radicals, most of which are important in atmospheric, combustion, or plane-tary chemistry. He has received numerous honors, and was elected as Fellow of the Ameri-can Physical Society in 1999, National Chair Professor from Ministry of Education (since 1997), Academician of Academia Sinica in 2008, and fellow of TWAS-academy of sci-ences for the developing world in 2011.
INTRODUCTION
Infrared absorption spectra, which are regarded as molecular fingerprints, have been employed extensively in environmental sciences, atmospheric chemistry, analytical chemistry, and industrial applications. The conventional continuously scanned (cs) Fourier-transform infrared (FTIR) spectrometer utilizes a continuous-scan Michelson interferometer to record the interferogram (a plot of inten-sity as a function of optical path difference); an interfero-gram yields a conventional spectrum (a plot of intensity as a function of wavelengthl or wavenumber s) via Fourier transformation. The FTIR technique possesses several ad-vantages such as multiplex,1large throughput,2great accu-racy of wavenumber,3and superb spectral resolution; the FTIR spectrometer has hence become a standard instru-ment in modern chemical laboratories. Because the inter-ferogram of the cs-FTIR spectrometer is recorded on scan-ning the mirror in one arm of the divided beam in the inter-ferometer to create an optical path difference, the best tem-poral resolution achievable is ~5 ms when a rapid-scan mode is employed.4Such a temporal resolution is unsatis-factory for the detection of transient species that might have a typical lifetime less than 0.2 ms. Several methods have been developed to overcome this limitation to record IR spectra with improved temporal resolution.5Among them, an interferometer operated in the step-scan (or stop-scan, ss) mode,6in which the moving mirror scans in a discrete fashion, is the most promising approaches to achieve this objective.7,8
Initially, the ss-FTIR instrument was employed in an emission mode to investigate the chemical dynamics of photodissociation and chemical reactions.9-17Green et al. investigated the vibrational relaxation of excited NO by O2.9Hancock and Heard investigated the chemilumines-cence from the reaction of O (3P) + CF2(
~
X 1A1) with spec-tral resolution 2 cm-1 and temporal resolution 10 ns.10 Hartland et al. investigated the laser induced fluorescence of I2and achieved spectral resolution of 0.25 cm-1and tem-poral resolution of 100 ns.11In our laboratory we employed the ss-FTIR emission spectroscopy to study the photodis-sociation dynamics of various haloethenes, such as vinyl halides,12,13CH2CF2,14and CF2CHCl (Ref. 15) as well as chemical reactions of Cl + CH3SH (Ref. 16) and Cl + H2S (Ref. 17) on monitoring the emission of HF or HCl to rive their vibration-rotational energy distributions. Our de-tection scheme subsequently extended to emission of CO,18-23CO2(Ref. 24, 25), HCO,23OH,22,26and NO.
The ss-FTIR technique in absorption mode has been used in the condensed phase for the investigation of photo-chemistry of photosynthetic proteins,27,28metallic com-plexes,29,30and species in zeolites31and in bio-systems.32In contrast, to our knowledge, reports on investigations of gaseous reactive species using ss-FTIR technique in ab-sorption mode are only from our laboratory. Since our first launch of this technique to detect the IR absorption spec-trum of gaseous ClCO in 2001,33we have continuously im-proved the technique to observe many important radicals and reactive species, including ClSO,34ClCS,35CH3SO2,36 C6H5SO2,37ClCOOH,38CH3SOO,39CH3SO,39CH3OSO,40 CH3OO,41CH3C(O)OO,42C6H5CO,43C6H5C(O)OO,44and, most excitingly, the simplest Criegee intermediate, CH2OO.45 In this review, we describe the basic principles and in-strumentation of using an ss-FTIR spectrometer to record transient absorption spectra, the methods to identify tran-sient species with spectral assignments, and some repre-sentative results; the advantages and limitations of this technique are also discussed.
EXPERIMENTS
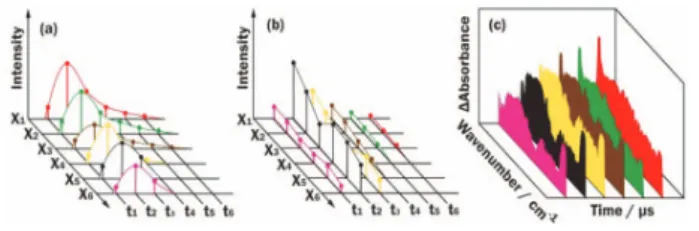
Data acquisition using an ss-FTIR spectrometer Unlike a conventional FTIR spectrometer, in which a mir-ror moves continuously during the scan to produce an inter-ferogram, an ss-FTIR spectrometer records a signal as the moving mirror stops at specific points defined by the zero crossing of the He-Ne laser fringes. Figure 1 depicts the data acquisition of an ss-FTIR spectrometer. The abscissa represents the position at which the moving mirror stops, and the other two axes represent the time evolution (t) and intensity (I) of the detected signal. After the moving mirror is stopped and stabilized at a given position xi,
corresponding to an optical path difference si, the temporal
pro-file, denoted as Isi(tn), is recorded at specified intervals after being
initiated by a triggered event, typically a laser irradiation.
Gener-Fig. 1. Schematic diagram of the data acquisition of a step-scan FTIR spectrometer. (a) Temporal profiles at varied steps xiare recorded. (b)
Inter-ferograms at varied intervals tiafter the
rear-rangment of (a). (c) Time-resolved spectra are obtained upon Fourier transformation.
ally 10-100 temporal profiles are recorded for signal averaging before the moving mirror becomes stepped to the next point xi+1,
corresponding to a path difference si+1, to repeat the acquisition of
the temporal profile. After recording all temporal profiles at all steps, as shown in Fig. 1(a), matrix Isi(tn) is rearranged to yield the
temporally-resolved interferograms, denoted as Itn(si) and shown
in Fig. 1(b), corresponding to each specific period tnafter
trigger-ing. The time-resolved spectra in a set Itn(s), shown in Fig. 1(c),
are thus obtained by Fourier transformation of Itn(si). Ac/dc detection
The interferogram of a cs-FTIR spectrometer is recorded in an ac-mode as the detector experiences modulation in signal when the mirror moves continuously to create optical path differ-ences. In a step-scan mode, the interferogram is typically re-corded in a dc-mode because the signal that the detector monitors does not vary with time as the mirror stops at a specific position; phase information is retrieved from this dc-coupled interfero-gram. However, to observe a minute change in a large background signal upon laser irradiation, ac-coupled detection is needed. The time-resolved absorption measurements are hence accomplished on recording both the dc- and ac-coupled signals either simulta-neously or consecutively.46,47For consecutive measurements, the dc-coupled signal is measured first without laser excitation, fol-lowed by the time-resolved measurements of the ac-coupled sig-nals upon laser excitation. The dc-coupled signal is used to obtain a static interferogram, I0(s), in which s is the path difference or
op-tical retardation. Upon Fourier transformation, it then serves as the background spectrum, S0(s), and provides the phase
informa-tion,j(s). An ac-coupled signal records the changes induced by laser irradiation. After Fourier transformation of these recorded interferograms at specific time delays tn, Itn(si), using the stored
phase from the dc-coupled measurement, temporally resolved dif-ferential spectra at varied periods t,DSt(s) are obtained. The
dif-ference absorbance spectrum at time t,DAt(s), is thus expressed
as DAt(s) = -log S S S t 0 0 ( ) ( ) ( ) s s s + é ë ê ù û ú D =-log 1 0 + é ë ê ù û ú DS S t( ) ( ) s s (1)
In the difference spectrum, lines pointing upwards typically indi-cate production of new species, whereas those pointing down-ward indicate destruction of the precursor. Caution should be ex-ercised to ensure that both S0(s) and St(s) are adjusted to the same
amplification factor if the dc- and ac-coupled signals are pre-am-plified with different factors.
Undersampling
There is commonly no benefit to record an extensive spec-trum when only a section of the spectral region is of interest. To
decrease the duration of data acquisition, undersampling, which decreases the number of acquired interferogram points, is applied in our measurements. In the step-scan mode, the interferogram is sampled discretely, and the zero-crossing points of the interfer-ence fringes of a monochromatic HeNe laser (632.8 nm) serve as a reference for sampling. According to the Nyquist criterion,48 any waveform that is a sinusoidal function can be sampled unam-biguously with a sampling frequency greater than, or equal to, twice the bandwidth of the system. If the sampling interval is 632.8 nm, which is equivalent to 15802 cm-1, the maximum (Nyquist) wavenumber range is hence 0-7899 cm-1. When the spectrum is limited to a smaller spectral range, a lower sampling frequency corresponding to a larger sampling interval might be used, resulting in a smaller number of points in the interferogram. For example, for a spectrum of interest in spectral range 1053-2106 cm-1, a sampling interval 15 × 632.8 nm is sufficient to re-cord the waveform. Each data acquisition is hence performed af-ter the moving mirror has advanced 15 steps; the number of acqui-sition points can thus be decreased to 1/15 of that in normal sam-pling. The advantage of undersampling is more pronounced for a high-resolution spectrum in a short spectral range.
Instruments
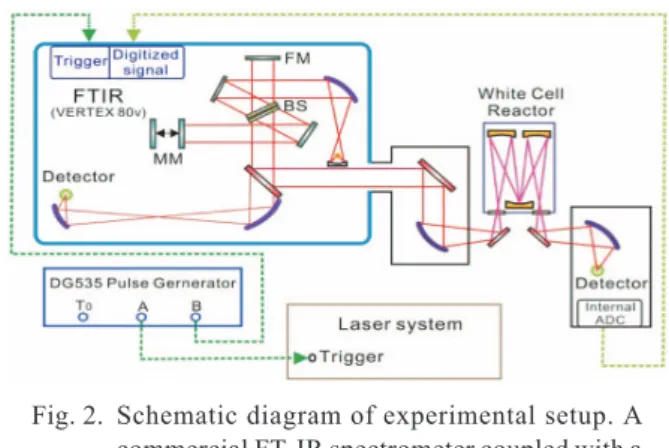
A commercial ss-FTIR spectrometer coupled with a multi-reflection White cell is employed for our time-resolved absorp-tion measurements. Figure 2 shows the experimental setup. We discuss below the details of two major systems in our laboratory. 1a. First-generation system
The step-scan measurements are performed under the mas-ter mode of the spectromemas-ter (Thermo Nicolet, NEXUS 870), in which the timing trigger is initiated by the spectrometer. Figure 3
Fig. 2. Schematic diagram of experimental setup. A commercial FT-IR spectrometer coupled with a White cell reactor is used. The solid lines repre-sent the optical path of the IR probing light and the detection at the right exit port is used for step-scan measurements. The dotted lines rep-resent the electronic signal cabling. FM: fixed mirror; BS: beam splitter; MM: moving mirror.
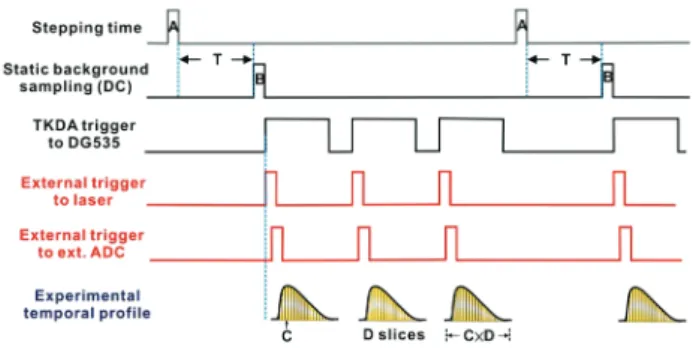
shows the timing diagram of data acquisition. When the moving mirror steps to the desired position, 300-600 ms suffices to stabi-lize the mirror, depending on the mirror velocity and under-sampling ratio. After the preset settling time T, the dc-coupled signal is recorded by the internal analogue-to-digital-converter (ADC, 2 × 10⁵sample s-1, 16 bit) without amplification. The spectrometer then sends the ‘take-data’ signal (TKDA) to trigger an external delay generator (DG535, Stanford Research Systems). This delay generator serves to trigger the photolysis laser and the external ADC (GAGE Applied Technologies, CompuScope 14100, 108sample s-1, 14 bit,) to record the ac-coupled signal. The external ADC is triggered when the photolysis laser beam ar-rives at the flow reactor. After laser excitation, the pre-amplified ac-coupled signal is sent to a voltage amplifier (Stanford Re-search Systems, SR560) for further amplification (typically, gain ~10) before being recorded with the external ADC. The minimal temporal resolution, indicated as C in Fig. 3, is 10 ns for the exter-nal ADC used. In principle, the temporal resolution is limited only by the response time of the detector and the ADC; the practi-cal temporal resolution is typipracti-cally determined by the acceptable ratio of signal to noise (S/N). In our experiments we typically em-ployed 150 slices at interval 1ms. The TKDA signal repeats sev-eral times (typically 10-30 times in our experiments, but only 3 times are shown in Fig. 3) for averaging. After the desired acqui-sition at a given mirror poacqui-sition, the mirror moves to the next step. The maximal optical retardation, hence the maximal distance that the moving mirror travels, is determined by the spectral resolu-tion. The highest available instrumental resolution (before apodization) of this interferometer is 0.2 cm-1. In consideration of duration of measurement and stability of the system, the spectral resolution is typically set at 1-4 cm-1.
1b. Second-generation system
In our second-generation system the step-scan FTIR spec-trometer (Bruker, Vertex 80v) employs all-digital electronics to improve the performance. The spectrometer is operated under an external triggering mode, whereby the timing trigger is initiated with an external delay generator (DG535). In this system, the dc-coupled background spectrum is measured first separately. The ac-coupled signal, synchronized with laser excitation, is re-corded in a separate measurement. Figure 4 shows the timing dia-gram with external triggering. After the settling time T (400-600 ms), the measurement trigger is activated. The sequence trigger is activated to initiate the data acquisition only when the measure-ment trigger is activated and an external trigger to spectrometer initiates the process, such as E1in Fig. 4; otherwise, the external
trigger to spectrometer is ignored, such as E2in Fig. 4. For this
system, the ultimate temporal resolution is 5 ns for an external ADC (MI3025, 2 × 10⁸sample s-1, 12 bit), but an internal ADC (8 × 10⁴sample s-1, 24 bit) at 12.5-ms resolution is typically used for its greater dynamic range; a resolution 6.3ms for the latter is also available. Both the preamplified dc- and ac-coupled signals are recorded by the internal ADC without further amplification. The greatest instrumental resolution of this instrument (without apodization) is 0.083 cm-1. With this resolution and much im-proved S/N of the system, we have demonstrated that rotational lines in an IR band become partially resolved, to be discussed be-low.
2. Multipassing absorption cell and reactor
A White cell49is mounted vertically in the sample compart-ment of the spectrometer to serve as the flow reactor. The body is made of stainless steel with an interior volume of ~1.5 L and is
Fig. 3. Time chart of the Nexus 870 spectrometer oper-ating in its master mode. A: stepping time of the moving mirror; T: stabilization time of the moving mirror; B: data acquisition time of the dc-coupled signal; C: temporal resolution of the analogue-to-digital converter (ADC); D: num-ber of time slices; C´D: total period of temporal profile.
Fig. 4. Time chart of the Vertex80v spectrometer oper-ating in its external-trigger mode. A: stepping time of the moving mirror; T: stabilization time of the moving mirror; E1: external trigger to the
spectrometer activated by the measurement trigger; E2: external trigger to the spectrometer
that is ignored; C: temporal resolution of the an-alogue-to-digital converter (ADC); D: number of time slices.
equipped with a water jacket to perform experiments at varied temperature. The White cell contains two concave spherical mir-rors with the same radius of curvature, which defines the distance between them; one mirror is cut into halves for adjustment of the tilt between them. Figure 5 shows the structure of the White cell. The probing IR light reflects several times to increase the optical path, hence the absorbance. White cells with a base path of length 20 cm with a maximal effective absorption length 6.0 m, and a base path length 15 cm with a maximal effective absorption length 3.6 m are used in our measurements. Parallel to the IR paths, two rectangular quartz windows (3´ 12 cm2) on two sides of the chamber are mounted to allow passage of the photolysis la-ser beam, which propagates through these windows and is multi-ply reflected between a pair of rectangular laser mirrors installed externally but nearly parallel to the quartz windows. The photo-lysis wavelengths vary with the chemical systems of interest; we generally use light at 193 and 248 nm from an excimer laser and at 355 nm from the third-harmonic output of a Nd:YAG laser. 3. Key factors in experiments
In experiments for detection of unstable intermediates, two factors should be considered: S/N and temporal resolution. Many factors affect the S/N: stability of the mirrors, acoustic noise, flow turbulence in the reactor, electric connections of the detector sig-nal, and electromagnetic noise from the photolysis laser. Care must be taken to minimize all these factors to achieve a satisfac-tory S/N.
If one can control the reaction kinetics so that the interme-diate endures more than 100ms, integration of the spectra over an extended period helps to improve the S/N. When employing a non-integrating ADC, one should perform data acquisition at the greatest rate and integrate the data to the desired temporal
resolu-tion to improve the S/N.
In step-scan measurements, the stability of the moving mir-ror is also critical to the S/N of the spectrum. If the moving mirmir-ror is not held in position stably, slight dithering might cause an artifi-cial signal, espeartifi-cially for the ac-coupled signal. Before each ex-periment, one has to measure the actual settling time of the mirror and set the settling time properly, especially when a large factor of undersampling is employed. As one records a high-resolution spectrum, extensive undersampling is necessary to keep the dura-tion of data acquisidura-tion within a reasonable period. Two important aspects must be addressed when undersampling is used. First, an appropriate optical filter must be employed to confine light to the desired spectral range to reach the detector; otherwise, folding or aliasing from other spectral range might appear in the resultant spectrum to interfere with the original spectrum.50Second, be-cause the mirror travels a greater distance before it stops, a greater settling time should be used for the moving mirror when extensive undersampling is applied.
RESULTS AND DISCUSSION
Methods to produce reaction intermediates
The unstable gaseous reaction intermediates are typi-cally produced by either direct photodissociation of a pre-cursor or via a bimolecular reaction of photolyzed reac-tants. In both cases, the excess energy of the products after irradiation or reaction should be rapidly removed; other-wise, the highly unstable intermediates might further disso-ciate. Some precursors that might not dissociate upon irra-diation are in their internally highly excited states; the side lobes of the parent absorption bands due to absorption of these internally excited states thus created might interfere with the detection of the intermediates. For these reasons, a buffer gas at pressure 50-200 Torr is typically added to quench the internally excited states of the products and the parent. N2and CO2are commonly used for their quenching efficiencies greater than those of inert gases. In some mea-surements, a buffer gas at a large pressure serves as both re-actant and quencher; for example, O2in the peroxide mea-surements.
When a molecular complex produced from a termo-lecular reaction is desired, performing the reaction at low temperature helps to stabilize the intermediates. In con-trast, higher temperature might be needed when the vapor pressure of the precursor is small under ambient condi-tions.
Identification of reaction intermediates
To identify the newly formed species, we typically
Fig. 5. Schematic of the White cell. The first and sec-ond IR beam paths and the first and secsec-ond UV photolysis beam paths of the multiply reflected light are shown. Circular dots indicate images of the IR beam at each reflection.
consider the following factors: reaction kinetics, observed vibrational wavenumbers, relative IR intensities, and rota-tional contours; all items are critical in the assignments of absorption bands.
With the advantage of time-resolved spectra, a tem-poral trace of the reactants and products can assist the iden-tification. The temporal evolution of each spectral band can be extracted from the 3D spectra to derive the rate coeffi-cient according to a proposed kinetic model. On comparing the temporal profiles, one can evaluate whether the mecha-nism of formation of the species of interest agrees with the kinetic model. Varied experimental conditions might result in varied temporal profiles of species of interest to assist the assignment. For one to confirm the identity of a newly formed species, producing it via varied precursors and via varied reaction schemes is desirable. For example, the photolysis of (CH3)2CO/O2at 248 nm and CH3CHO/O2/Cl2 at 355 nm both give rise to the the same transient features, attributed to CH3C(O)OO,42because CH3CO is the com-mon intermediate in both reactions and it reacts with exces-sive O2readily.
The equilibrium geometry, vibrational wavenumbers, IR intensities and rotational parameters of an unstable spe-cies in its ground and vibrationally excited (vi= 1) states were calculated with the density-functional theory using GAUSSIAN 09;51 the B3LYP method with an aug-cc-pVTZ basis set is typically employed. Analytic first deriva-tives are utilized in geometry optimization, and vibrational wavenumbers are calculated analytically at each stationary point. The predictions of the corresponding anharmonic wavenumbers are also carried out by calculating the analyt-ical second derivatives. To identify the carrier of the spec-trum, one typically compares the observed vibrational wavenumbers and relative IR intensities with the anhar-monic vibrational wavenumbers and IR intensities pre-dicted for all possible candidates in the reaction scheme. When the spectral patterns are similar for two possible can-didates, especially two conformers, we require information on rotational contours to differentiate them.
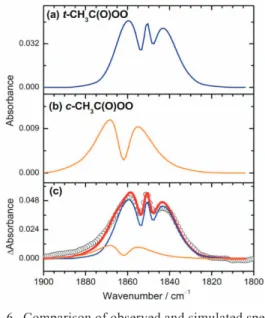
Using the predicted molecular parameters for the ground and the vibrationally excited state, vibration-rota-tional spectra are simulated with the help of programs for that purpose, such as PGOPHER52and SpecView.53The ro-tational contours of possible candidates are compared for a final identification. As an example, cis-CH3C(O)OO and trans-CH3C(O)OO have similar vibrational wavenumbers for the C=O stretching mode, predicted near 1862 and 1851
cm-1, respectively, but the cis-isomer has a b-type band for this mode whereas the trans-isomer has a mixed a-/b-type band. From the observed contour, we readily assign that the major carrier of this band is trans-CH3C(O)OO; a small discrepancy can be taken into account with a small contri-bution from cis-CH3C(O)OO, as shown in Fig. 6.42
With the second-generation system, we can partially resolve the rotational lines to make the assignments even more definitive. Some examples (spectra of ClCO and CH3OO) illustrating this improvement will be discussed in latter sections. The best resolution achievable, 0.083 cm-1, provides a chance to derive approximate primary rotational parameters A, B and C, especially when the parameters of the ground state are known.
Advantages and limitations
Although the ss-FTIR possesses advantages with multiplex and high throughput, its sensitivity is still unsat-isfactory. To detect reactive intermediates, one can typi-cally detect an absorbance difference greater than 10-4; for most species that value corresponds to ~1013molecule cm-3 in the reactor, still much greater than the detection limits of
Fig. 6. Comparison of observed and simulated spectra of the C=O stretching mode of CH3C(O)OO in
the region 1800-1900 cm-1. (a) Simulated band of t-CH3C(O)OO (n0= 1851 cm-1and
a-type/b-type = 54/46). (b) Simulated band of c-CH3C(O)OO (n0= 1862 cm-1and a-type/b-type
= 1/99). (c) Comparison of spectra (open cir-cles) observed from an irradiated flowing mix-ture of CH3CHO/Cl2/O2(2/5/500 at 100 Torr) at
298 K and simulated spectrum (thick solid line) for t-CH3C(O)OO : c-CH3C(O)OO = 3.7 : 1.0;
other spectral techniques such as laser-induced fluores-cence. For IR spectral detection, the coupling of a diode la-ser, an IR optical parametric oscillator/amplifier, or a quan-tum-cascade laser with a multipass absorption cell or a ringdown cavity provides much improved sensitivity. Nev-ertheless, the ss-FTIR technique possesses some advan-tages unsurpassed by these highly sensitive techniques mentioned above. The wide spectral coverage enables one to monitor simultaneously nearly all species in the reactor with satisfactory temporal resolution, providing ample in-formation on the chemical kinetics that might be critical in the assignments of the spectral features and understanding the reaction mechanism. The multiplex feature of a FTIR spectrometer is also superior to the laser techniques if the laser source or the reaction system is unstable. In contrast, the laser techniques can only detect one wavelength at a time; instability of the system is more susceptible to be taken as the real signal.
The matrix-isolation technique, especially using p-H2 as a host, has been commonly employed in trapping free radicals; the IR absorption spectra provide a valuable tool for the identification of these free radicals.54,55This tech-nique suffers, however, from matrix shifts that causes small deviations in band positions from those in the gas-phase. With only information of vibrational wavenumbers and rel-ative IR intensities, but without rotational contours, it might be difficult to provide definitive assignments of the observed absorption bands, especially for conformers. As discussed previously, the ss-FTIR method can utilize rota-tional contours as important information for band assign-ments. Furthermore, the lack of temporal resolution in ma-trix isolation prevents its study of rapidly decaying species and investigation of rapid reaction kinetics.
Another limitation of an ss-FTIR system is that the flow system uses reagents in large quantities. Unlike matrix isolation, which requires only a minute amount of sample, investigations with isotopes or valuable samples are costly and often unlikely with the ss-FTIR method. Finally, even though a resolution 0.08 cm-1is attainable, this extent is still inadequate to resolve rotational fine structure. In this respect, the IR laser beams have much narrower width and enable the recording of high-resolution spectra.
Because the IR probe beam and the UV photolysis beam have disparate paths, care must be exercised to distin-guish the average concentration in the IR-probed volume from the average concentration in the photolyzed volume. The concentration of IR-probed volume might be derived
from the decrease in concentration of the precursor and the known or estimated yield for production of the intermedi-ate. It can also be estimated from the theoretically predicted IR intensities; to minimize the errors due to theoretical pre-dictions, as many bands as possible should be employed. For estimation of the concentration in a photolyzed vol-ume, one typically has to rely on UV absorption cross sec-tions of the precursors and the laser fluence. As diffusion is generally slower than reaction, the concentration of the photolyzed volume is used in kinetic analysis.
Significance of experimental results
We have employed the ss-FTIR technique to investi-gate the IR spectra and reaction kinetics of many gaseous unstable species, mostly free radicals that are important in atmospheric chemistry. Nearly all spectra recorded with this technique are previously unreported. Here we briefly describe some representative results and their significance. 1. Chlorine-containing compounds
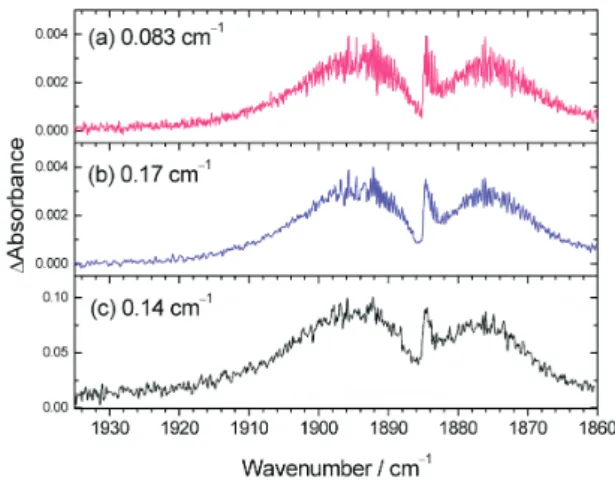
In the degradation of chloro-hydrocarbons, several reactive Cl-containing species, such as ClCO and ClCOOH, are important intermediates in the upper atmosphere. Upon irradiation of the gaseous mixture containing Cl2, CO, and Ar at 355 nm, the transient absorption of ClCO was ob-served near 1884 cm-1, as shown in Figure 7 (c) with its ro-tational contour unresolved.33With the second-generation system, we have partially resolved the rotational lines of ClCO at resolution 0.083 cm-1, as shown in Figure 7 (a), thus enabling a comparison of the simulated spectrum and
Fig. 7. Absorption spectra of ClCO recorded under varied conditions. (a) and (b) are recorded by the second-generation system at resolutions 0.083 cm-1and 0.17 cm-1, respectively. (c) Pre-vious results recorded at resolution 0.14 cm-1 (adapted from Ref. 33; the y-axis scale might be in error).
deriving information about the structure of ClCO.
After the reaction of Cl with formic acid (HCOOH), the isomeric products c-ClCOOH and t-ClCOOH were identified;38ClCOOH was produced via rapid reactions of COOH with Cl2and Cl. Upon irradiation of the mixture of Cl2/HCOOH/N2, two sets of transient features were ob-served. Band origins at 1808.0 and 1328.5 cm-1are attrib-uted to the C=O stretching and the COH bending modes of t-ClCOOH, respectively, whereas those at 1883.0 and 1284.9 cm-1are assigned as the corresponding modes of c-ClCOOH. The observed relative intensities indicate that t-ClCOOH is more stable than c-ClCOOH by ~3 kJ mol-1, consistent with theoretical calculations.
We have also accomplished the detection of ClSO and ClCS upon photolysis of precursors Cl2SO and Cl2CS with an excimer laser.34,35Much buffer gas, such as Ar, N2, CO2, was added to the system to quench and to stabilize both the primary photolysis products and the precursor. If the quenching is insufficient, the energized primary prod-uct might undergo further dissociation and hot bands of ClSO, Cl2SO, ClCS, and Cl2CS appeared.
2. Important intermediates in atmospheric sulfur oxi-dation
The oxidation of CH3S plays an important role in the degradation of reduced sulfur compounds, such as CH3SCH3, CH3SSCH3, and CH3SH.56,57According to results of Zhu and Bozzelli, the reaction of CH3S with O2yields the ther-modynamically favored species CH3SO2via an intermedi-ate CH3SOO.58Formation of a third isomer CH3OSO was also predicted.59,60Before our work, CH3SO2was detected only with a mass spectrometer; no spectral information on any isomer was available. We have prepared CH3SO2, CH3OSO, and CH3SOO from varied precursors and ob-tained their IR spectra.
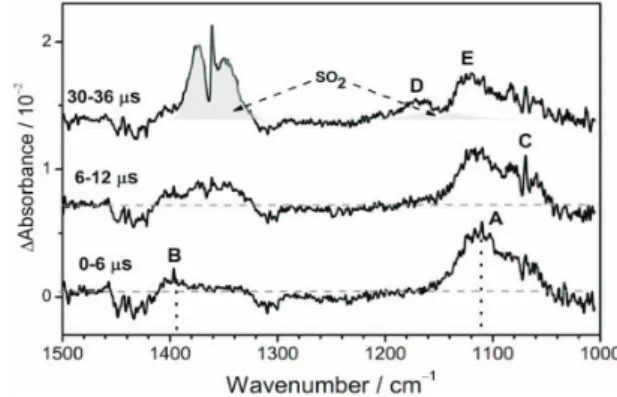
Upon irradiation at 248 nm of a flowing mixture of CH3SSCH3in excessive O2at 260 K, several features were observed in separate reaction periods, as shown in Fig. 8. Two transient bands with sharp Q-branches near 1397 (B) and 1110 (A) cm-1were attributed to the antisymmetric CH3-deformation and O=O stretching modes of syn-CH3SOO, respectively. A band with an origin near 1071 (C) cm-1appeared at a slightly later stage and was assigned to the S=O stretching mode of CH3SO, produced via a sec-ondary reaction of CH3SOO with CH3S. At an even later stage, two bands near 1170 (D) and 1120 (E) cm-1were ten-tatively assigned to CH3S(O)OSCH3and CH3S(O)S(O)CH3, which are probably generated via the self-reaction of
CH3SOO. The final product SO2was observed to increase in intensity throughout the reaction period.
Upon irradiation at 248 nm of a flowing mixture of CH3I, SO2and CO2, two transient bands near 1280 and 1076 cm-1observed in the earlier stage were attributed to CH3SO2; a band near 1159 cm-1observed in a subsequent stage was assigned to the secondary reaction product CH3SO2I.37The kinetic analysis revealed that the rate coef-ficient of the bimolecular reaction CH3+ SO2is (2.6 ± 0.5) ´ 10-13cm3
molecule-1s-1, consistent with a previous re-port.61Isomer CH3OSO was not observed in the reaction CH3+ SO2. CH3OSO was detected upon photodissociation of CH3OS(O)Cl in CO2or N2at 248 nm.40Five transient features at 2991, 2956, 1154, 1151, and 994 cm-1are as-signed as the CH3antisymmetric stretching (n2), CH3 sym-metric stretching (n3), the S=O stretching mixed with CH3 rocking (n8), the S=O stretching mixed with CH3wagging (n9), and the C-O stretching (n10) modes of syn-CH3OSO.
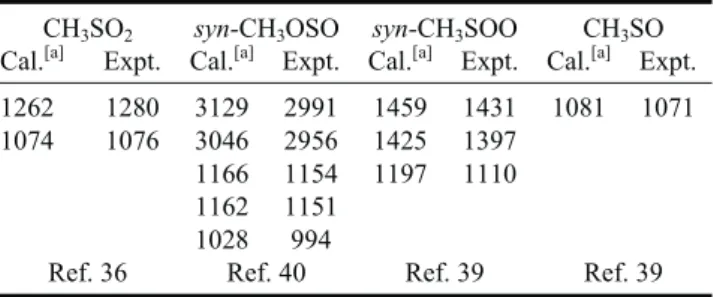
Table 1 presents a summary of observed bands of CH3SO2, CH3OSO, CH3SOO, and CH3SO. With this infor-mation, further kinetic and mechanistic investigations by direct probe of absorption bands of these S-containing radi-cals are possible. An example is shown in Fig. 9 in which the preliminary results clearly indicate that CH3SO, indi-cated with B, and CH3SNO2(Ai), CH3SO3H (MSA), and NO (not shown) were produced in the CH3S + NO2 reac-tion, initiated by photolysis at 248 nm of a mixture of CH3SSCH3/NO2/N2at 16 Torr.
3. Spectra of peroxides and formaldehyde oxide Alkyl peroxides are important intermediates in the oxidation of hydrocarbons; they are involved in catalytic cycles of ozone destruction and might be the precursors of
Fig. 8. Time-resolved spectra recorded at varied inter-vals upon irradiation of a flowing mixture of CH3SSCH3/O2at 220 Torr and 260 K (adapted
from Ref. 39). A and B: CH3SOO; C: CH3SO; D
smog or aerosols in the atmosphere. We produced CH3OO upon irradiation at 248 nm of a flowing mixture of CH3I and O2.41Although some bands were overlapped, we were able to deconvolute the spectra and to identify transient ab-sorption bands with origins near 3033, 2954, 1453, 1408, 1183, 1117, 3020, and 1441 cm-1, corresponding ton1–n6, n9, andn10modes of CH3OO, respectively; these values are consistent with the reported wavenumbers of CH3OO iso-lated in an Ar matrix.62We employed the second-genera-tion system and improved significantly the spectra both in resolution and S/N. Figure 10 shows, in the CH-stretching region, the Q-branches ofn2andn9are clearly visible at 2954.1 and 3021.4 cm-1, whereas in the previous report41 they were derived from spectral deconvolution and com-parison with simulated rotational contours.
The reaction of acetyl radical (CH3CO) with O2was
also investigated.42CH3C(O)OO is regarded as the main precursor of the peroxyacetyl nitrate (PAN), which is a ma-jor pollutant in photochemical smog.63 We generated CH3C(O)OO on irradiation at 248 nm of a mixture of CH3COCH3and O2or on irradiation at 355 nm of a mixture CH3COH/Cl2/O2. The band origins near 1851, 1372, 1169, and 1102 cm-1are assigned to t-CH3C(O)OO, and those near 1862, 1142, and 1078 cm-1to c-CH3C(O)OO; a partial spectrum in the C=O stretching region is shown in Fig. 6. Our observations are consistent with those reported in an Ar matrix.64Use of the theoretically predicted IR intensi-ties with the observed relative absorbance indicated that t-CH3C(O)OO is more stable than c-CH3C(O)OO by 3± 2 kJ mol-1. A weak band near 1960 cm-1assigned to cyc-CH2C(O)O ( -lactone) is the first direct identification of the co-product of the OH-formation channel in the reaction CH3CO + O2.
Criegee intermediates are carbonyl oxides that play key roles in the reactions of ozone with unsaturated hydro-carbons; these reactions thus become an important mecha-nism for the removal of unsaturated hydrocarbons and for the production of OH in the troposphere. They are also re-sponsible for the production of some acids and carbonyl compounds that might generate aerosols that contribute to local photochemical smog and global climate change. No
Fig. 9. Time-resolved spectra recorded at varied inter-vals upon irradiation at 248 nm of a flowing mixture of CH3SSCH3/NO2/N2(0.9/0.09/15 at
16.2 Torr and at 298 K) in the region 1000 -1800 cm-1. Bottom: before photolysis (DMDS indicates CH3SSCH3); A1-A3: CH3SNO2; B:
CH3SO; MSA: CH3SO3H.
Table 1. Comparison of observed vibrational wavenumbers (cm-1) of CH3SO and various isomers of CH3SO2
CH3SO2 syn-CH3OSO syn-CH3SOO CH3SO
Cal.[a] Expt. Cal.[a] Expt. Cal.[a] Expt. Cal.[a] Expt. 1262 1280 3129 2991 1459 1431 1081 1071 1074 1076 3046 2956 1425 1397
1166 1154 1197 1110 1162 1151
1028 994
Ref. 36 Ref. 40 Ref. 39 Ref. 39 [a] Harmonic vibrational wavenumbers were predicted with the B3P86 method.
Fig. 10. Comparison of observed and simulated spec-tra of CH3OO recorded under varied
condi-tions. (a) Previously reported spectra recorded upon photolysis of a flowing mixture of CH3I/
O2(~1/100, 203 Torr, 281 K) at resolution 4
cm-1.41(b) Spectra simulated at resolution 4
cm-1(thick black line); individual bands of three vibrational modes are shown in thin grey lines. (c) Spectra recorded upon photolysis of a flowing mixture of CH3COCH3/O2(~1.6/99,
101 Torr, 298 K) at resolution 0.17 cm-1using the second-generation system.
direct IR identification of even the simplest gaseous inter-mediate CH2OO (formaldehyde oxide) has been reported. We recorded the transient infrared absorption spectrum of CH2OO, produced from CH2I + O2in a flow reactor, with the ss-FTIR technique.45The five bands observed at 849, 908, 1240, 1286, and 1435 cm-1provide a definitive identi-fication of this intermediate. The observed wavenumbers of the O-O stretching mode of CH2OO near 908 cm-1is much smaller than the wavenumbers of the corresponding modes of CH3OO at 1117 cm-1(Ref. 41) and CH3C(O)OO at 1102 cm-1,42determined with a similar technique (Table 2). The observed wavenumber of the C-O stretching mode near 1286 cm-1is much larger than the corresponding value of CH3OO at 902 cm-1observed in a matrix62and 911 cm-1 observed in our second-generation system, indicating some double bond character. These observed vibrational wave-numbers imply that a zwitterion with a strengthened CO bond and a weakened OO bond rather than a diradical de-scribes this intermediate more appropriately. The direct IR detection of CH2OO will be very useful for kinetic and mechanistic investigations involving the Criegee mecha-nism.
4. Reactions of benzyl radical
Benzyl radical (C6H5) is the simplest aromatic radi-cal; it plays an important role in organic synthesis, atmo-spheric chemistry and combustion chemistry. The reactions of C6H5with CO, O2, and SO2have been investigated with the ss-FTIR technique.
C6H5CO was generated from photolysis at 248 nm of acetophenone, C6H5C(O)CH3, or via the reaction of phenyl radical (C6H5) with CO upon photolysis of C6H5Br at 248 nm.43An intense band near 1838 cm-1and a weak band near 1131 cm-1are assigned to the C=O stretching (n6) and mixed modes of the C-C stretching and C-H deformation (n15) of C6H5CO, respectively. Several secondary products, such as BrCO, C6H5C(O)Br, and C6H5C(O)C6H5, were also observed in the C6H5Br/CO/N2experiments; a correspond-ing kinetic analysis was performed.
The reaction of C6H5CO with O2was investigated.44 Two intense bands near 1830 and 1226 cm-1are assigned to the C=O stretching (n6) and C-C stretching mixed with C-H deformation (n13) modes and two weak bands near 1187 and 1108 cm-1are attributed to the C-H deformation (n14) and O-O stretching/CH deformation (n16) modes of syn-C6H5C(O)OO, the benzoylperoxy radical. The sec-ondary self-reaction of C6H5C(O)OO generates C6H5C(O)OOC(O)C6H5. Observed bands of the
aforemen-tioned OO- and CO-containing species are summarized in Table 2.
The reaction of C6H5with SO2was studied because of its importance in organic synthesis.37Upon the irradiation at 248 nm of three flowing mixtures, C6H5SO2Cl in N2, C6H5Cl and SO2in CO2, and C6H5Br and SO2in CO2, two transient features with origins at 1087.7 and 1278.2 cm-1 were assigned to the symmetric and antisymmetric SO2 -stretching modes of C6H5SO2, respectively. When the mix-ture containing C6H5Br/SO2/CO2 was used to produce C6H5SO2, two transient bands observed near 1186 and 1396 cm-1at a subsequent reaction period were ascribable to C6H5SO2Br, due to secondary reaction of C6H5SO2with Br.
SUMMARY
A step-scan time-resolved Fourier-transform spec-trometer coupled with a multipass White cell as a reactor has been applied to characterize many reaction intermedi-ates that are important in atmospheric chemistry; these gas-eous IR spectra were unreported previously. The wide spectral coverage and adequate temporal resolution pro-vide information on chemical kinetics, which, coupled with vibrational wavenumbers and IR intensities predicted quantum-chemically, aid in the assignments of observed absorption bands. The rotational contours of observed bands provide critical information for the assignments to distinguish conformers or isomers. Although other tech-niques using IR lasers might have sensitivity superior to this technique, the multiplex advantage of the ss-FTIR technique provides a wide spectral coverage for simulta-neous detection of several species in the reaction system and is an excellent tool for exploring unknown species. The Table 2. Comparison of observed vibrational wavenumbers of
OO-stretching and CO-stretching modes of various imtermediates
OO-stretch CO-stretch Ref.
t-ClC(O)OH 1808 38 c-ClC(O)OH 1883 38 t-CH3C(O)OO 1102/1169 1851 42 c-CH3C(O)OO 1078/1142 1862 42 syn-C6H5C(O)OO 1108 1830 44 C6H5CO 1838 43 CH3OO 1117/1183 911[a] 41 CH2OO 908 1286/1435 45
spectra in the fingerprint region thus obtained provide valuable information on molecular structures and can be employed for direct probe and further investigations on chemical kinetics and reaction mechanisms.
ACKNOWLEDGEMENTS
National Science Council of Taiwan (Grants No. NSC102-2745-M009-001-ASP) and Ministry of Educa-tion, Taiwan (“Aim for the Top University Plan” of Na-tional Chiao Tung University) supported this work. The National Center for High-Performance Computing pro-vided computer time.
REFERENCES
1. Fellgett, P. B. J. Phys. Radium 1958, 19, 187. 2. Jacquinot, P. J. Opt. Soc. Am. 1954, 44, 761. 3. Connes, J. J. Phys. Radium 1958, 19, 197.
4. Braiman, M. S.; Ahl, P. L.; Rothschild, K. J. Proc. Nat. Acad. Sci. U S A 1987, 84, 5221.
5. Time-Resolved Vibrational Spectroscopy, Springer Proceed-ings In Physics 4. Laubereau, A.; Stockburger, M., Eds.; Springer-Vetlag: Berlin, Germany, 1985.
6. Heard, D. E.; Brownsword, R. A.; Weston, D. G.; Hancock, G. Appl. Spectros. 1993, 47, 1438.
7. Sakai, H.; Murphy, R. E. Appl. Opt. 1978, 17, 1342. 8. Barowy, W.; Sakai, H. Infrared Phys. 1984, 24, 251. 9. Green, B. D.; Caledonia, G. E.; Murphy, R. E.; Robert, F. X.
J. Chem. Phys. 1982, 76, 2441.
10. Hancock, G.; Heard, D. E. Chem. Phys. Lett. 1989, 158, 167. 11. Hartland, G. V.; Xie, W.; Dai, H.-L.; Simon, A.; Anderson,
M. J. Rev. Sci. Instrum. 1992, 63, 3261.
12. Lin, S.-R.; Lin, S.-C.; Lee, Y.-C.; Chou, Y.-C.; Chen, I-C.; Lee, Y.-P. J. Chem. Phys. 2001, 114, 160.
13. Lin, S.-R.; Lin, S.-C.; Lee, Y.-C.; Chou, Y.-C.; Chen, I-C.; Lee, Y.-P. J. Chem. Phys. 2001, 114, 7396.
14. Lin, S.-R.; Lee, Y.-P. J. Chem. Phys. 1999, 111, 9233. 15. Wu, C.-Y.; Chung, C.-Y.; Lee, Y.-C.; Lee, Y.-P. J. Chem.
Phys. 2002, 117, 9785.
16. Cheng, S.-S.; Wu, Y.-J.; Lee, Y.-P. J. Chem. Phys. 2004, 120, 1792.
17. Chen, K.-S.; Cheng, S.-S.; Lee, Y.-P. J. Chem. Phys. 2003, 119, 4229.
18. Wu, C.-Y.; Lee, Y.-P.; Ogilvie, J. F.; Wang, N. S. J. Phys. Chem. A 2003, 107, 2389.
19. Wu, C.-Y.; Lee, Y.-P.; Wang, N. S. J. Chem. Phys. 2004, 120, 6957.
20. Chen, H.-F.; Lee, Y.-P. J. Phys. Chem. A 2006, 110, 12096. 21. Tseng, C.-M.; Lee, Y. T.; Lin, M.-F.; Ni, C.-K.; Liu, S.-Y.;
Lee, Y.-P.; Xu, Z. F.; Lin, M. C. J. Phys. Chem. A 2007, 111, 9463.
22. Chen, H.-F.; Liang, C.-W.; Lin, J. J.; Lee, Y.-P.; Ogilvie, J. F.;
Xu, Z. F.; Lin, M. C. J. Chem. Phys. 2008, 129, 174303. 23. Bagchi, A.; Huang, Y.-H.; Xu, Z. F.; Raghunath, P.; Lee, Y.
T.; Ni, C.-K.; Lin, M. C.; Lee, Y.-P. Chem. Asian J. 2011, 6, 2961.
24. Chen, H.-F.; Tsuchiya, S.; Lee, Y.-P. J. Phys. Chem. A 2009, 113, 3431.
25. Chiang, H.-C.; Wang, N. S.; Tsuchiya, S.; Chen, H.-T.; Lee,Y.-P.; Lin, M. C. J. Phys. Chem. A 2009, 113, 13260. 26. Huang, C.-K.; Xu, Z.-F.; Nakajima, M.; Nguyen, Hue M. T.;
Lin, M. C.; Tsuchiya, S.; Lee, Y.-P. J. Chem. Phys. 2012, 137, 164307.
27. Uhmann, W.; Becker, A.; Taran, C.; Siebert, F. Appl. Spectros. 1991, 45, 390.
28. Xiao, Y.; Partha, R.; Krebs, R.; Braiman, M. J. Phys. Chem. B 2005, 109, 634.
29. Chen, P. Y.; Palmer, R. A.; Meyer, T. J. J. Phys. Chem. A
1998, 102, 3042.
30. Cowan, A. J.; Portius, P.; Kawanami, H.; Jina, O. S.; Grills, D. C.; Sun, X.-Z.; McMaster, J.; George, M. W. Proc. Nat. Acad. Sci. U. S. A. 2007, 104, 6933.
31. Vasenkov, S.; Frei, H. J. Phys. Chem. A 2000, 104, 4327. 32. Garczarek, F.; Gerwert, K. Nature 2006, 439, 109.
33. Chen, S.-H.; Chu, L.-K.; Chen, Y.-J.; Chen, I-C.; Lee, Y.-P. Chem. Phys. Lett. 2001, 333, 365.
34. Chu, L.-K.; Lee, Y.-P.; Jiang, E. Y. J. Chem. Phys. 2004, 120, 3179.
35. Chu, L.-K.; Han, H.-L.; Lee, Y.-P. J. Chem. Phys. 2007, 126, 174310.
36. Chu, L.-K.; Lee, Y.-P. J. Chem. Phys. 2006, 124, 244301. 37. Chu, L.-K.; Lee, Y.-P. J. Chem. Phys. 2007, 126, 134311. 38. Chu, L.-K.; Lee, Y.-P. J. Chem. Phys. 2009, 130, 174304. 39. Chu, L.-K.; Lee, Y.-P. J. Chem. Phys. 2010, 133, 184303. 40. Chen, J.-D.; Lee, Y.-P. J. Chem. Phys. 2011, 134, 094304. 41. Huang, D.-R.; Chu, L.-K.; Lee, Y.-P. J. Chem. Phys. 2007,
127, 234318.
42. Chen, S.-Y.; Lee, Y.-P. J. Chem. Phys. 2010, 132, 114303. 43. Lin, S.-Y.; Lee, Y.-P. J. Phys. Chem. A 2012, 116, 6366. 44. Golec, B.; Chen, J.-D.; Lee, Y.-P. J. Chem. Phys. 2011, 135,
224302.
45. Su, Y.-T.; Huang, Y.-H.; Witek, H. A.; Lee, Y.-P. Science
2013, 340, 174.
46. Eberhard, J.; Yeh, P.-S.; Lee, Y.-P. J. Chem. Phys. 1997, 107, 6499.
47. Uhmann, W.; Becker, A.; Taran, C.; Siebert, F. Appl. Spec-trosc. 1991, 45, 390.
48. Nyquist, H. AIEE Trans. 1928, 617, 644. 49. White, J. U. J. Opt. Soc. Am. 1942, 32, 285.
50. Herres, W.; Gronholz, J. Comp. Appl. Lab. 1984, 2, 216. 51. Gaussian 09, Revision 7.0, Frisch, M. J.; Trucks, G. W.;
Schlegel, H. B.; Scuseria, G. E.; Robb, M. A.; Cheeseman, J. R.; Scalmani, G.; Barone, V.; Mennucci, B.; Petersson, G. A.; Nakatsuji, H.; Caricato, M.; Li, X.; Hratchian, H. P.; Izmaylov, A. F.; Bloino, J.; Zheng, G.; Sonnenberg, J. L.; Hada, M.; Ehara, M.; Toyota, K.; Fukuda, R.; Hasegawa, J.;
Ishida, M.; Nakajima, T.; Honda, Y.; Kitao, O.; Nakai, H.; Vreven, T.; Montgomery, Jr., J. A.; Peralta, J. E.; Ogliaro, F.; Bearpark, M.; Heyd, J. J.; Brothers, E.; Kudin, K. N.; Staroverov, V. N.; Kobayashi, R.; Normand, J.; Raghavachari, K.; Rendell, A.; Burant, J. C.; Iyengar, S. S.; Tomasi, J.; Cossi, M.; Rega, N.; Millam, J. M.; Klene, M.; Knox, J. E.; Cross, J. B.; Bakken, V.; Adamo, C.; Jaramillo, J.; Gomperts, R.; Stratmann, R. E.; Yazyev, O.; Austin, A. J.; Cammi, R.; Pomelli, C.; Ochterski, J. W.; Martin, R. L.; Morokuma, K.; Zakrzewski, V. G.; Voth, G. A.; Salvador, P.; Dannenberg, J. J.; Dapprich, S.; Daniels, A. D.; Farkas, Ö.; Foresman, J. B.; Ortiz, J. V.; Cioslowski, J.; Fox, D. J. Gaussian, Inc., Wallingford CT USA, 2009.
52. PGOPHER. A Program for simulating Rotational Structure; Western, C. M., Univeristy of Bristol, UK, http://pgopher. chm.bris.ac.uk (version 7.1.108, released 13 Sept. 2010). 53. Stakhursky, V.; Miller, T. A. SpecView: Simulation and
Fit-ting of Rotational Structure of Electronic and Vibronic Bands, In Proceedings of the 56thOSU International Sympo-sium on Molecular Spectroscopy; Columbus, Ohio, USA,
2001.
54. Lee, Y.-P. J. Chin. Chem. Soc. 2005, 52, 641.
55. Bahou, M.; Huang, C.-W.; Huang, Y.-L.; Glatthaar, J.; Lee, Y.-P. J. Chin. Chem. Soc. 2010, 57, 771.
56. Tyndall, G. S.; Ravishankara, A. R. Int. J. Chem. Kinet.
1991, 23, 483.
57. Yin, F.; Grosjean, D.; Seinfeld, J. H. J. Atmos. Chem. 1990, 11, 309.
58. Zhu, L.; Bozzelli, J. W. J. Phys. Chem. A 2006, 110, 6923. 59. Frank, A. J.; Turecek, F. J. Phys. Chem. A 1999, 103, 5348. 60. Davis, S. R. J. Phys. Chem. 1993, 97, 7535.
61. James, F. C.; Kerr, J. A.; Simons, J. P. J. Chem. Soc., Faraday Trans. 1 1973, 69, 2124.
62. Nandi, S.; Blanksby, S. J.; Zhang, X.; Nimlos, M. R.; Dayton, D. C.; Ellison, G. B. J. Phys. Chem. A, 2002, 106, 7547.
63. Atkinson, R.; Baulch, D. L.; Cox, R. A.; Hampson, Jr., R. F.; Kerr, J. A.; Rossi, M. J.; Troe, J. J. Phys. Chem. Ref. Data
2000, 29, 167.