оᜋܹࢺЅՆүཌϽᏰंـРҏᠵޟಋଢ଼࣏ЅූӴցҢ
ݓжᏱ
1Ȇ፳࣡
2Ȇ༰ဎϞ
3Ȇങ๙㹹
2Ȇቓ൲ӎ
4Ȇឃसි
5Ȇឃԙ
5Ȇෆԑ
1* 1ҳѮᢊσᏰᅣཾऋᏰंـܚ 2ࢇၻཾۏষོЫၐᡛܚݍ෫ҡंـϛЖ 3 ϛѵंـӴ౨ऋᏰंـܚ 4ࢇၻཾۏষོЫၐᡛܚషЫᖅᎴंـϛЖ 5ࢇၻཾۏষོЫၐᡛܚᄢȁ!ौ!
࣏Οᕣ၌РҏᠵӵചӴЫϛޟުϷҀȃಋଢ଼לоЅᎌᔖ࣏Ȃҏंـ௴ҢϤᆍϚӣޟ ᜋПݲȂѓࢂȈ(1) оశᄘ෨੧ӟᠵധᡝߒȇ(2) о៵ᜋȇ(3) ٺҢϽѲᕗᡤશ (OTC) ᇄ₩ શ (ALC) Նүȇ(4) оଢ଼ސවаේΣᡝϱоЅ (5) оཌᆄ១ߜ឴ጡጆᡆේΣᡝϱȄܻ 2002ȃ2003ȃ2005 оЅ 2006 ԑϷտоΰक़ϤᆍᜋПݲȂӓॎᜋΟ 4800 ᠵጣЅ 2473 ༁ᠵȂ ณࡣϷտភܹܻјࡌഖޟσᝉᢊ (ዢ) ڷܹޟଽࡎྩϛȃή෬ȄϷݙᜋܹࢺࡣޟӱԝၥਟȂ ๖ݎี౪РҏᠵڎԤሴ࣏Ȃܹࢺࡣᠵധσୄӵ 1 ϴ٨ጒ൜ϱȄցҢႫυཌቈϷݙՆүϛ ޟ Sr/Ca ШȂี౪РҏᠵӻኵᒵᐅјషឧЫޟݬο࣏ූӴȄ ᜰᗤԅȈРҏᠵȃᜋܹࢺȃSr/Ca ШȃූӴցҢࠉȁ!ِ!
ॱݰᡆ (acoustic tags & acoustic array)ȇ(3) ༈ಛ ޟ ཐ ᔖ Ԓ ܖ ߨ Ⴋ υ Ԓ ᡆ (transponder or non-electronic tags) ȇ (4) Ͻ Ᏸ Ѕ ҡ ސ ᡆ (chemical & biological markers)ȇ(5) ฒጣႫልก ᡆ (radio telemetry) оЅ!(6) ၥਟᓽԆܖᔬਰक ᓃԒᡆ (data storage tags (DST) or archival tags) (ᆩ֭Ȉhttp://www.fisheries.org/units/tag2008/)Ȅ ധޟҡࣀѬȃḯ෬࣏ȃූӴցҢоЅఊ တଢ଼ᄘȂᅣཾၥྛ߳ىЅᆓ౩Ϛџܖીޟၥ ଉȄᜋܹࢺᕕுٲၥଉശޢޟПݲȄ ᜋܹࢺӱԝၥਟџоҢپեॎএᡝޟҡߝȃಋଢ଼ ࣏ȃḯ෬ၯ৷ȃᘗඹຽᚔȃූӴցҢȂఊတޟ ኵ໔ȃԙߝȃԫιڷၥྛޟี้ȄѪѴȂ ӫՆүޟཌϽᏰϷݙȂᗙџо१࡚ധޟḯ෬ ᕗცѬȄ ӵΰक़ޟПݲϛȂցҢಳᚔПԒ (pop-up) ޟ DSTȂџоकᓃധޟḯ෬ၯ৷оЅᕗცၥଉȂ࿋ ᡆಳᚔധᡝࡣਗ਼юЫ७ਢȂᡆϱܚಣᑖӨᆍ ᕗცၥਟޟଉဴȂ߯џցҢཌݰ༈ଉޟПԒଉ ༈ଚڗΡഅፏȂӔ༈ӱڗӴ७ޟԝમȇܖ ӵധᡝೝӱԝоࡣȂആႆጣȂᡆϱഋၥ ਟήၷڗႫသ໌ၥਟϷݙȄᆍᡆҬࠉϐင ᔖҢڗσḯ෬ധȂԃᘂധЅᚰധ้Ȃծҥ ܻᡆᡝᑖЊσ (σघ 10 cm)ȂฒݲᔖҢڗᡝᑖၶ ωޟധᆍȄᡝၶωޱȂҬࠉᗙٺҢ༈ಛཐᔖ ԒܖߨႫυԒޟᡆȂٽԃоཌᆄ១ߜ឴ဴጆ ᡆ (CWT, coded wire tags) ܖཌଢ଼ސවа (chips) ৄේڗധᡝϱȄϽᏰܖҡސᡆശЈณ ਲ਼ᐃ American Fisheries Society 2008 ԑ 2 Тӵહ ՙ ៌ ܚ ᖞ ᒲ ޟ ധ ᜋ ሬ ं ଆ ོ (Advances in Fish Tagging & Marking Technology International Symposium, Auckland, New Zealand, 24-28 February 2008)ȂᜋܹࢺПݲޟᔖҢџϷԙ ϲσտȈ(1) Ρഅፏᡆ (satellite tags)ȇ(2) ຺
*ଉհޱбѮѕѿσԊୢᛳᆋၯѲࢲΙဴ, TEL: 02-33662887; FAX: 02-23639570; Email: wnt@ mtu.edu.tw
ޟᜋПݲȂٽԃցҢଽㅯ!(Sr)ȃᎣ!(Ba) ܖᇄ ՌณࣨϛШϚࣺӣޟӣ՝શྙశݾࡣȂџо ӵധՆүΰή੫ޟϯશဴ (Thorrold et al., 2002, 2006; Williamson et al., 2009)Ȃആႆ፴ᜊቈϷ ݙџоᒱᜋٲϯશȄѪѴȂϽᏰᜋПݲᗙѓ ࢂӣ՝શޟٺҢȂڏᓺᘈȂҡސᡝᄇܻӣ՝શ ၶؠԤҡ౩հҢΰޟᒵᐅਝᔖȂܚᜋޟ߬ဴ ஊ࡞܆ᄂޟೝᓃȇીᘈࠌӵٺҢӣ՝શਢ҆ ሯωЖᆓȂоᗗջԴՌณᕗცȄѪѴΙᆍ ᜋՆүޟПݲȂՆүޟᒉӎᜋݲȂցҢݧৢ ܖݾϽѲᕗᡤશ (OTC, Oxy-tetracycline) ܖ₩શ (ALC, Alizarin complexone) ྙశȂџӵՆ үΰלԙ༁ᆦՓܖऔՓޟᒉӎဴȄ ՆүޟЈณཌ໔ϯશȂߖԑپೝኄݿ ᔖҢڗധḯ෬ंـޟПݲϞΙȂՆүџоकᓃ ࡞ӻޟᕗცଉȂٮиӵՆүΰޟᓃ៉ܒ ޟȂڏтᜋПݲܚฒݲڥфޟȂӵՆүю ౪ޟ 31 ᆍϯશϛȂSr/Ca ШསԑឭၥଉȂ१ ࡚ധḯ෬ᕗცѬശலҢޟПݲȄՆүޟкौԙ Ϸ࣏ CaCO3Ȃҥܻ Sr ᇄ Ca ӣΠቋޟᢃπఊϯ શȂϽᏰ੫ܒࣺխȂӰԪ Sr ࡞ৠܾڥф Ca Մؖ ᑖӵՆүϛȄЫϛޟㅯᐨ࡙࣏ 8.7 × 10⁻⁵ MȂష Ыࠌ࣏ 9 × 10⁻⁷ MȂࣺ৯घ 100 ॻ (Campana, 1999)Ȃ ՄՆүΰޟ Sr/Ca ШᇄѴӵЫᡝϛޟᢄ࡙ ࠌڎԤଽ࡙ޟғࣺᜰܒ (Secor et al., 1995; Tzeng, 1996; Kawakami et al., 1998; Lin et al., 2007)Ȅ࿋ധ ܻЫਢȂՆүོю౪ଽ Sr/Ca ШȂІϞӵష Ыਢࠌོю౪ճ Sr/Ca ШȂӰԪՆүΰޟ Sr/Ca Ш џоհ࣏ᕗცޟࡾȄҥܻኺޟ੫ܒȂՆү Sr/Ca Ш ϐ င ೝ ኄ ݿ ᔖ Ң ܻ ं ـ ڍ ḯ ෬ ധ (diadromous fishes) ӵЫЅషЫᕗცޟಋଢ଼ ႆ แ Ȃ ٽ ԃ ྗ ݬ ḯ ෬ (anadromy) ޟ ᘃ 嘒 (Kalish, 1990; Howland et al., 2001; Limburg et al., 2001) ᇄనᢧ (Secor and Piccoli, 1996)ȃ६ḯ ෬ޟషЫᠵ (Tzeng, 2003; Tzeng et al., 2002, 2003; Tsukamoto and Arai 2001; Jessop et al., 2002; Shiao
et al., 2003) Ѕڍූḯ෬ (amphidromy) ޟፈߏധ
(Radtke and Kinzie, 1996; Shen et al., 1998; Shen and Tzeng, 2002)ȄӰԪՆүΰޟ Sr/Ca ШȂҢ پ१࡚ധӵషЫЅЫᕗცޟḯ෬ᕗცѬȂ ࣺ࿋౩དޟώڎȄ Рҏᠵ (Anguilla japonica)ȂӵϷᏰΰȂ឴ ܻᠵ㠦Ҭ!(Anguilliformes)ȃᠵ㠦ऋ (Anguillidae)Ȃ ࣏६ḯ෬ധ (catadromous fishes)ȂϷҀӵݍ ѕٳӴୢޟѮᢊȃϛȃᗺоЅРҏ้ӴȄР ҏᠵޟ֊ൟ՝ӵѕЊҁࢷ٨ٳઽတ৬оՙޟ (Tsukamoto, 1992, 2006ȇLiao et al., 1996, 1999ȇLiao, 2001)ȄᠵധΙҡѫΙԩ֊Ȃׇ֊ ࡣ൷ԫιȄ֊তჽϽϞࡣޟрധᆎ࣏ࠉࢩဨלᠵ (preleptocephalus)Ȃᓞσȃ٘ᡝಠߝȂбᏏԌᎠՄ एюȂԙߝΪඁЈࡣȂбᏏೝ֜ԝԙಠωޑԌб (Yu et al., 1993ȇTanaka et al., 2001)Ȃᓍࡣᡝଽቨ ё Ȃ ᓞ ω ٘ ᡝ ࡵ Ȃ ᆎ Ϟ ࣏ ࢩ ဨ ᠵ (leptocephalus)Ȅࢩဨᠵᎌӫӵࢷࢺϛհߝຽᚔޟ ᅔࢺȂ֊ൟᓍྣླྀޟѕٕၾࢷࢺ (North Equatorial Current) ܁ՙಋଢ଼ȂӔ༃ዘ܁ѕᅔ ࢺȄ4 ڗ 6 এТࡣȂپڗݍѕٳޟσചෞȂᡐ ᄘ࣏ࢺጣиആ݂ޟ࣠ይᠵ (glass eel)ȂۖڎԤ кଢ଼෬ݨޟΨȂٮஊཐڧᢄ࡙ȃྣ࡙ȃϽᏰ ڨޟ৯Ȅ࣠ይᠵೝషЫ֜Е໌Σݬοȃញ ష Ы ࡣ Ȃ ᡝ ߒ Փ શ ಠ फ ം ᅚ ี ى ȃ ԙ ࣏ ᠵ ጣ (elver) Ȅ ӵ ݬ ύ ԙ ߝ ޟ ࢲ ᆎ ࣏ ༁ ᠵ ! (Yellow eel)ȂᓍএᡝϚᘞีىȂംᅚ܁ΰ෬ಋଢ଼Ȃӵݬ ύ ϛ ූ ኵ ԑ Ȃ ้ ڗ ԙ ዣ ਢ Ӕ ᙽ ᡐ ԙ ࣏ ሚ ᠵ (Silver eel)Ȃٮ໌६ḯ෬֊ȂᖅॊήΙфȂ ׇԙڏҡࣀѬ (Ege, 1939; Tesch, 1977)Ȅ ᗶณႆўޟंـϐငජᛲΟᠵധޟҡࣀѬႆ แ (Schmidt, 1912)ȂծԤᜰᠵധӵݬύϱޟಋଢ଼ оЅѴࢷޟḯ෬࣏ٮϚ࡞఼ཿȄෆ (1984) ց ҢᒉӎᏘᜋӵ։ौྗݬޟᠵጣᡝߒΰȂо ߯ᢎᄆᠵധӵݬοୢޟḯ෬࣏ȄծٮҐ៉ ଡᙹڏྗݬϞࡣޟ࣏ȄJellyman and Tsukamoto (2002) ց Ң ོ ಳ ᚔ ޟ ၥ ਟ ᓽ Ԇ ᡆ (pop-up Archival tag)Ȃھۡӵᐬࢸσᠵ!(A. dieffenbachii) ޟ٘ΰȂᢎᄆڏ६ޟ֊ḯ෬࣏Ȃծᆍ ᡆᡝᑖЊσȂ༉ھۡӵᡝσޟᐬࢸσᠵȂ ԃݎौھۡӵᡝၶωޟРҏᠵ٘ΰȂٮϚџ ȄKuo et al. (1996) ցҢ຺ॱݰᡆ (ultrasonic transmitter tag) ଡᙹ६ࡣРҏᠵޟḯ෬࣏Ȃծ ҥܻԪᆍᜋПݲڧ३ܻᡆϱႫԱޟჰڼȂଡ ᙹޟਢζ࡞ȂՄиԝᏢά҆ӣ؏ߖຽ ᚔଡᙹȂᜋາҢ݁ິиາਢາώȄThibault et al., (2007) ෆငԙђӴ௴ҢႆฒጣႫᡆ (radio tag) ଡᙹݬύϱछࢸᠵಋଢ଼࣏ȂࣺӣПݲζᔖҢܻ ዉࢸᠵ (Westerberg et al., 2007) ڷહՙ៌σᠵ (Boubee et al., 2008) ΰȄฒጣႫᡆПݲᗶณԁȂ
ծѫࠁ३ӵωጒ൜ϱȂи҆ኄ೩ฒጣႫԝ Ꮲϗۡ՝ȂᜋζາਢາώՄи݁ິȂଡᙹ ޟਢζ࡞Ԥ३ȄܚоҬࠉԤᜰ༁ᠵӵݬύϱޟ ಋଢ଼࣏ȂܚޣϫณԤ३Ȅ ҏंـ௴ҢϽᏰޟڷ༈ಛޟᜋПݲȂپं ـݬύڷዢϱޟᠵധޟಋଢ଼࣏ȄϽᏰޟ ΝցҢՆүޟϯશಢԙȇՄ༈ಛޟࠌџᙏ ୢϷ࣏ᡝѴоЅᡝϱȄᡝѴഋϷȂк ौӵധᡝߒ७໌੧ӟȃ៵ܖ҈ࢾȂо߯ پӔਐਢџоҥѴᢎޢୢϷᜋധڷҐᜋ ധȇᡝϱࠌ௴Ңଢ଼ސවаоЅཌᆄ១ߜ឴ ጡጆᡆڷՆүᒉӎᜋПݲȄငҥоΰӨᆍП ݲޟσ໔ᜋࡣȂ໌༁ᠵӵݬύϱޟಋଢ଼࣏ ЅූӴցҢ้ᠵധḯ෬ଉޟंـȂоඪټҐ پݬύϱᠵധၥྛ߳ىЅᆓ౩ޟՃȄ
Fig. 1 The Japanese eels were released at sites of Da-pong (DP) Bay and the estuary of the Kao-ping (KP) River in southwestern Taiwan.
ਟᇄПݲ
ΙȃंـӴᘈ!
(Fig. 2a)Ȅᓺᘈငႆశᄘ෨౩ޟᠵധȂ ϱџоӵᡝߒή఼ཿޟጡጆဴȂӔਐਢџ оѴᢎ఼ཿӴᒱᜋȂٮиցҢጡጆޟಢӫџо ୢտڗএᡝޟቹԩȇીᘈశᄘ෨ᜋࡣӵᡝߒ ҡޟ༌౷Ȃσघငႆ 3 এТࡣȂ൷ོᡐுጙ Ϛ఼ȂӰԪȂၶϚᎌӫୈߝޟଡᙹȄ РҏᠵᜋܹࢺޟᄂᡛӴᘈȂ՝ܻࠒѮᢊޟ σᝉᢊЅଽࡎྩЫ (Fig. 1)ȄσᝉᢊᔻᖝѮᢊ ১ޟΙএјࡌഖܒޟዢȂԤΙএ੭બޟ໌ю οᇄѴࣺȂоЅڍএЫ໔࡞ωޟషЫ௶Σ οȂᢊϱޟᢄ࡙ۖತᆰࡻӵ 33 ~ 35 psu ϞȂష Ы௶Σοߣߖޟᢄ࡙࣏ 5 ~ 7 psuȄଽࡎྩ࣏ࠒѮ ᢊശσޟݬύȂߝ࡙Ԥ 171 kmȂݬοӴୢ༈ಛ ਐਔᠵധޟհཾୢȂݬοޟᢄ࡙ڧڗዘԲޟ ኇԤ࡞݂ᡗޟᡐϽ (0 ~ 33 psu)Ȃཐዘளޟຽᚔ ߝႀ 16.8 kmȄѪѴȂଽࡎྩݬύۻቹޟӴלᕗც ࣺ࿋ޟϚӣȂџୢϷԙЫҡේސᙴ൲ޟ૩ᐩȃँ ፴ۻ፴ȃᘇπۻ፴оЅԤࢾҲޟᐝቬ้ූӴȄ (2) ៵ݲȋ ӵϚӣޟ៵ഋ՝ήΙа៵ܖӵឥᇐΰ҈ࢾ ୈȄζΙᆍၶৠܾџоޢѴߒᢎᄆ ޟПԒȄϚႆӵငႆघέএТޟਢȂೝޟ៵ ζོӔҡȂ༌οᘾӫࡣᇄཎѴڧ༌ࡣޟᘾӫৠܾ ȂѴᢎΰϚܾୢտ (Fig. 2d)Ȅ 2. ᡝϱᜋΠȃᜋПݲ
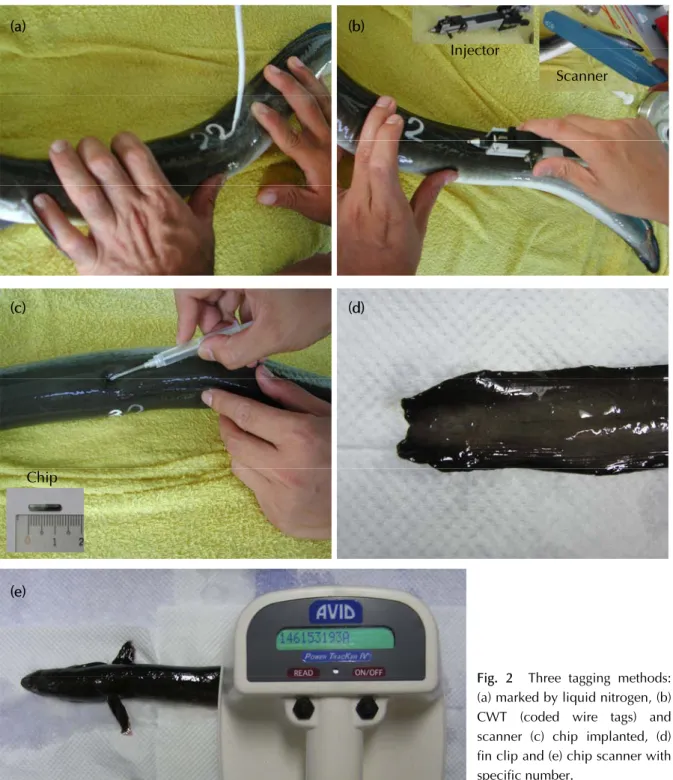
(1) ཌᆄ១ߜ឴ጡጆᡆȋ ҏंـܚ௴ҢޟᜋПݲȂϷտᇳ݂ԃή (ӵ ᜋࠉȂᠵധࣱငႆബ᎖౩)ȋ ᡆߝ࡙घ 1 mmȂџ៉ጡဴܖ׳ԩጡ ဴȄٺҢݧৢᏢᡆේΣധᡝࡣܹࢺȄӔਐਢ ց Ң ௭ ජ Ꮲ پ ᔮ ก (CWT detector: Handheld Wand Detector, NMT - Northwest Marine Technology, USA) (Fig. 2b)ȄҬࠉϐԤ୦ཾϽޟ ᡆЅ௭ජفಛȂৠܾᐇհȂџоσ໔ᜋȄ (Ι) ༈ಛޟᜋПݲ 1. ᡝѴᜋ (1) శᄘ෨੧ӟݲȋ (2) ଢ଼ސවаȋ ӑړԤ़МԅҔȃಒဴܖኵԅޟߜ឴ Ȃညܻశᄘ෨ϛȂณࡣ੧ӟӵധᡝߒ७ή ցҢݧৢᏢԤጡጆޟවаᡆේΣധᡝϱ(a) (b) (c) (d) Injector Scanner Chip (e)
Fig. 2 Three tagging methods: (a) marked by liquid nitrogen, (b) CWT (coded wire tags) and scanner (c) chip implanted, (d) fin clip and (e) chip scanner with specific number.
(Fig. 2c)ȂᠵധӔਐਢցҢ௭ජᏢᒱᜋවаᡆ (Chips detector: All Weather Extended Range Multi Tag Reader, AVID, USA ) (Fig. 2c, e)Ȅଢ଼ސවаᓺ ᘈӵܻؐএවаԤጡጆȂџоᒱᜋএᡝȂٮи џо१ፒٺҢȂծીᘈᡆ୵ቋଽ݁ȂՄи ᜋૉਢȄ ᡝϱᜋޟཌᆄ១ߜ឴ጡጆᡆоЅଢ଼ސව аȂӵݧৢׇԙиငႆ௭ජᏢޟጂᇯࡣȂᜋ џоႀ 100%Ȅ (Π) ϽᏰޟᜋПݲ — Նүᜋ 1. ࠉညၐᡛ ༁ᠵоؐϴОധᡝ१࣏அྥȂϷտо 25ȃ50ȃ 75 оЅ 100 ppm ོҡ༁ᆦՓᒉӎޟϽѲᕗᡤ શ (OTC)Ȃ໌လݧৢȄѪѴȂᠵጣоऔՓޟ ₩શ (ALC)Ȃᐨ࡙Ϸտ࣏ 15ȃ25ȃ50 Ѕ 75 ppmȂ
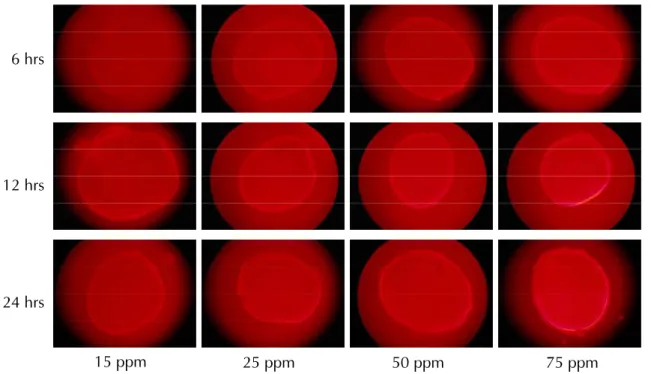
Fig. 3 The red ALC fluorescent marks exhibited by elvers which were immersed in ALC solution at different time periods (6, 12 and 24hrs) and concentrations (15, 25, 50 and 75 ppm). The tagged elvers were then reared for one month. 12 hrs 24 hrs 6 hrs 15 ppm 25 ppm 50 ppm 75 ppm ݾ 6ȃ12 Ѕ 24 ωਢȂႷىΙএТࡣែࣘധᡝڥ юՆүȂငѓৄȃंᑑࡣȂо BV فӖᘮӎа (BV-2A, wavelength: EX 400-440 nm, DM 455 nm, BA 470 nm, Nikon) оЅ G فӖᘮӎа (G-2A, wavelength: EX 510-560 nm, DM 575 nm, BA 590 nm, Nikon) Ϸտپᔮຜ OTC оЅ ALC ޟᜋਝ ݎȄ 2. Նүᜋ Ն ү ΰ ޟ ᒉ ӎ ဴ Ȃ ആ ႆ ӎ Ᏸ ᡗ ཌ ᜢ (SMZ-10, Nikon) Ȃ ๖ ӫ Ы ሚ ᐷ ݾ ޟ ΰ ഋ ӎ ྛ (HBO – 100w/2, Nikon)ȂསᒉӎᘮᜢپᢎᄆȄՄ ᜰܻՆүᒉӎᜋޟശᎌ࿋ᐨ࡙ᇄਢȂALC ฒ ፣о 15ȃ25ȃ50 оЅ 75 ppm ޟᐨ࡙ݾӵϚ ӣਢή (6ȃ12 оЅ 24 ωਢ) ࣱҡ఼ཿޟᒉ ӎᕗ (Fig. 3)Ȃծԃݎᐨ࡙ЊଽȂᒉӎᕗ࡙߫Њ ଽȂོኇӵᡗཌᜢήՆүᒉӎᜋ՝ညޟրۡ ғጂܒȇՄ OTC оϚӣޟᐨ࡙໌လݧৢȂζ џоӵՆүΰҡ఼ཿޟ༁ᆦՓᒉӎᕗ (Fig. 4)ȄҏᄂᡛϷտٺҢؐϴОധ 100 ppm ޟ OTC ݧ ৢоЅ 75 ppm ޟ ALC ݾ 12 ωਢ (Fig. 5)Ȅᒉ ӎᕗဴ࣏ᄂᡛޟଔᘈȂӵᒉӎᕗ (mark) ڗՆү ޟጢ (edge) Ϟޟୢ (Fig. 5)Ȃ࣏ܹࢺႆแ ϛധᡝܚԙߝޟഋϷȂζ൷ࡣ៉հ࣏ϷݙՆү ཌ໔ϯશޟ՝ညȄ ငႆᜋ౩ޟᠵധሯӑᎴӵᎴԱ ϛȂ้ധᡝׇӒϚڧബ᎖ޟኇȂиඈࣀΨ ࡣȂӔ໌ܹࢺȂٮи߳ഋϷᠵധհ࣏ࡣ៉Ԇ ࣀޟଡᙹᢎᄆȄҏᄂᡛี౪ȂϚ፣Ιᆍ ҰПݲȂᠵധӵᜋࡣȂႤЈޟԆࣀ֯џоႀ ڗ 99% оΰȂငႆΙএТࡣȂ༉ོԤЍኵޟএᡝ ԫιȂᐌᡝޟԆࣀһџо߳ࡻӵ 99%Ȅѓ֤ᠵ ጣᇄ༁ᠵȂӓॎܹࢺ 7273 ᠵധȄ
έȃኺҏپྛЅܹࢺኵ໔
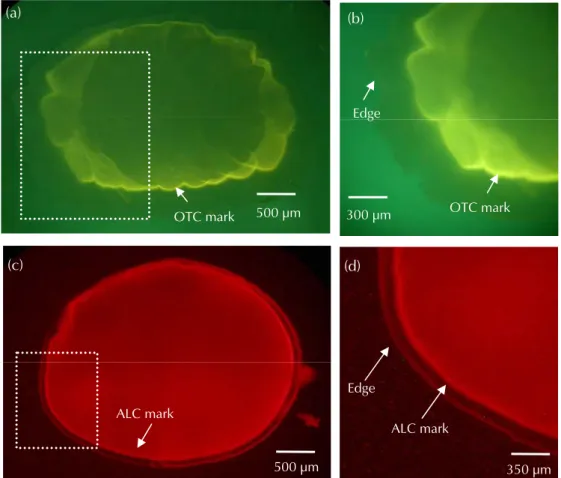
ᜋܹࢺᄂᡛܚٺҢޟᠵധԤέᆍȋ(1) Ꮄ ᠵȂӵࡎݍӴୢݬοܚਐਔޟᠵጣȂӵషЫ ޟᎴԱϛငႆ 2 ԑѾѡޟᇋᎴߝσȂӔငႆј షឧЫႽϽјԑࡣȂඪټҏंـٺҢȇ(2) ᅣҕӵ ଽࡎྩݬοٺҢ᠖ܚਐᕕޟഏҡᠵ (Table 1)ȇ (3) ᠵጣޟഋӋȂ௴ҢޟཱིԼᓞࠉྩݬοܚਐਔ ޟᠵധȄ2002~2005 ԑоЅ 2006 ԑଽࡎྩᖂॎܹ ࢺΟ 1350 оЅ 1123 (ᠵጣଶѴ) ᠵധȂσᝉᢊFig. 4 The yellow OTC fluorescent marks were showed by yellow eels which were injected with OTC solution at dosage (a)25, (b)50, (c)75 and (d)100 ppm of body weight (per kg). arrow: OTC mark.
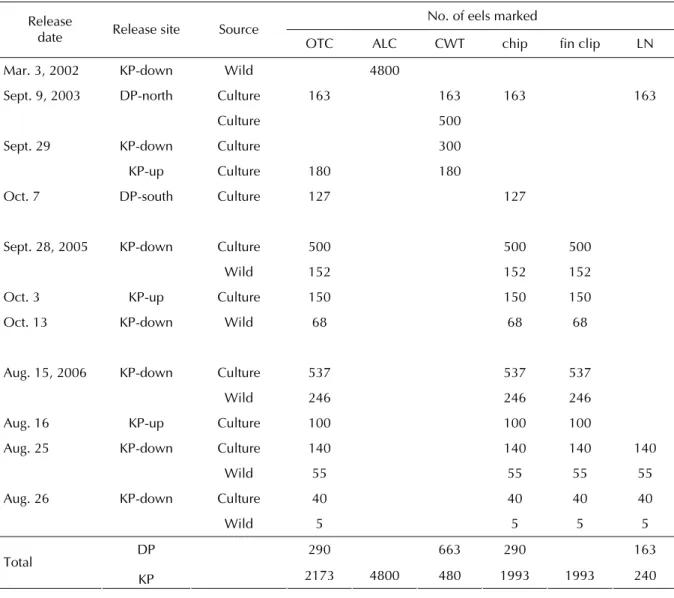
Fig. 5 Oxytetracycline (OTC) and Alizarin complexone (ALC) marks in the otoliths of Japanese eels at release. The new increments between the OTC and ALC marks and the otolith edge were deposited between release and recapture. (a) (b) (c) (d) 500 m (b) OTC mark Edge 300 m (d) 350 m Edge ALC mark ALC mark OTC mark (a) 500 m (c) 500 m
Table 1 Sources and numbers of Japanese eels Anguilla japonica marked by different methods (Oxytetracycline: OTC, Alizarin Complexone: ALC, coded wire tag: CWT, chip, fin clip, and liquid nitrogen: LN), and released at the south and north coasts of Da-Pong Bay (DP) and the upstream (KP-up) and the downstream (KP-down) of the Kao-Ping River in 2002, 2003, 2005 and 2006
No. of eels marked Release
date Release site Source OTC ALC CWT chip fin clip LN Mar. 3, 2002 KP-down Wild 4800
Sept. 9, 2003 DP-north Culture 163 163 163 163
Culture 500
Sept. 29 KP-down Culture 300
KP-up Culture 180 180 Oct. 7 DP-south Culture 127 127
Sept. 28, 2005 KP-down Culture 500 500 500
Wild 152 152 152
Oct. 3 KP-up Culture 150 150 150
Oct. 13 KP-down Wild 68 68 68
Aug. 15, 2006 KP-down Culture 537 537 537
Wild 246 246 246
Aug. 16 KP-up Culture 100 100 100 Aug. 25 KP-down Culture 140 140 140 140
Wild 55 55 55 55
Aug. 26 KP-down Culture 40 40 40 40 Wild 5 5 5 5 DP 290 663 290 163 Total KP 2173 4800 480 1993 1993 240 ᖂӓܹࢺΟ 790 ȂӨᆍᜋПݲޟܹࢺኵ໔Ѕ ܹࢺРڷӴᘈ၏ԃ Table 1Ȅҁ֯ᡝߝЅᡝ१ԃ Table 2 & 3 ܚҰȄܻ 2002 ԑ 3 ТȂӵଽࡎྩή෬ ܹࢺΟ 4800 ޟᠵጣഋӋȂӰ࣏ؠԤӱԝȂܚо ؠԤᒲݲୈࡣ៉ޟଡᙹ፡ࢥȄ ѪѴȂ࣏ΟଆРҏᠵܹࢺࡣޟᘗඹຽᚔо Ѕሴ࣏ȂٺҢΟ 2006 ԑ 8 Т 15 Рӵଽࡎྩ ή෬Ыܚܹࢺޟ 783 ᠵധ (Table 3)Ȃܹࢺࡣ ငႆ 10 Јܻ 2006 ԑ 8 Т 25 РȂӵܹࢺᘈߣߖЫ 7 এ௴ኺᘈೝᅣҕо᠖ܚਐᕕȂᖂॎ 204 ᠵധо໌ၥਟϷݙȄԪѴȂ࣏ΟଆᠵധؐЈ ശσޟᘗඹຽᚔڷПөȂ 204 ᠵധܻ࿋Јӱ ԝࡣȂငႆஅᙃၥਟ໔กकᓃࡣȂԚଶࣀΨϚٹ ޟᠵധȂӓॎԤ 195 ᠵധ (Table 3) ӵᇄ Fig. 7 c ࣺІޟЫ໌ܹࢺ (Fig. 7 d)Ȅ
ѲȃSr/Ca ШϷݙ
ᜋܹࢺࡣӔਐᕕޟᠵധȂก໔ڏᡝߝȃᡝ १ϞࡣȂڥюՆүȂငѓৄȃंᑑࡣȂցҢႫυ ཌቈ ȞEPMA; JXA-8900R, JEOLȟоؐ 10 ȝm ޟຽᚔȂ௴ऎູጣޟПԒȂϷݙՆүਯЖՍጢ ޟՆү Sr/Ca ШȂณࡣᘝڥ OTC Ϟࡣޟ Sr/Ca ᡐϽȂپϷݙܹࢺϞࡣޟᠵധಋଢ଼לȄਲ਼ᐃTable 2 Mean (± SD) total length (TL) and body weight (BW) of released Japanese eels, Anguilla japonica, in Da-Pong Bay (DP) and the upstream (KP-up) and downstream (KP-down) of the Kao-Ping River in 2002, 2003 and 2005. The recaptured rates (%) were calculated one year after release. Recapture rate (%) = recapture of tagged/ release of tagged × 100%
Mean (± SD) Release
Release site Source No. of eel released No. (%) of eel recaptured TL (cm) BW(g) date KP-down Wild 4800* 0 (0) 5.56 ± 0.24 Mar. 3, 2002
Sept. 9, 2003 DP-north Culture 163 34 (20.9) 1200 Culture 500 59 (11.8) 400 Sept. 29 KP-down Culture 300 14 (3) 400
KP-up Culture 180 0 (0) 400
Oct. 7 DP-south Culture 127 50 (39.3) 1200
KP-down Culture 500 25 (5) 69.3 ± 4.9 508.3 ± 137.6 Sept. 28, 2005
Wild 152 4 (2.6) 69 ± 4.7 505.5 ± 129.2 Oct. 3 KP-up Culture 150 1 (0.6) 68.9 ± 4.7 495.7 ± 134.6 Oct. 13 KP-down Wild 68 0 (0) 44.2 ± 11.6 116.3 ± 109.9
DP 2003 790 143 (14.6) Tzeng (1996) ޟᄂᡛ๖ݎȂषՆү Sr/Ca ωܻ 4.0× 10⁻³ȂࠌߒҰᠵധӵషЫЫಋଢ଼ȇषଽܻ 4.0× 10⁻³ȂࠌߒҰӵЫಋଢ଼ȇषӵ 4.0× 10⁻³ߣߖ ᡐଢ଼ȂࠌߒҰӵݬοಋଢ଼Ȅਲ਼ᐃՆүޟ Sr/Ca Ш ๖ݎȂџоҢپୢϷᠵധޟḯ෬࣏оЅҡࣀѬ ȂӰԪζџоᄇܹࢺਟޟᎴᠵоЅഏҡ ᠵ໌ҡࣀѬޟᡛᜌȂоЅџоҢپϷݙഏҡᠵ ޟҡࣀѬᄘȂശࡣџоᡛᜌᜋᠵധӵܹࢺႆ แϛޟḯ෬࣏Ȅ 2002 4800 0 (0) 5.56 ± 0.24 2003 480 14 (3) Total KP 2005 870 30 (3.4) 66.2 ± 10.1 458.2 ± 183.9 *Only Mar. 3, 2002 were elvers
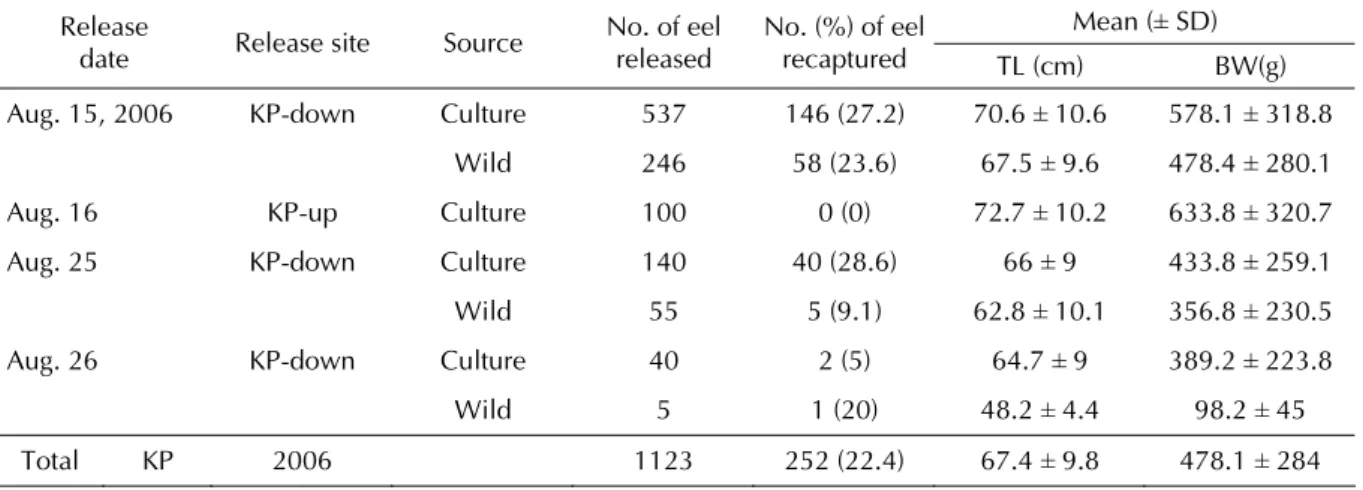
Table 3 Mean (± SD) total length (TL) and body weight (BW) of released Japanese eels, Anguilla japonica, in the upstream (KP-up) and downstream (KP-down) of the Kao-Ping River in 2006. The recaptured rates (%) were calculated ten days and one day after release. Recapture rate (%) = recapture of tagged/ release of tagged × 100%
Mean (± SD) Release
Release site Source No. of eel released No. (%) of eel recaptured TL (cm) BW(g) date KP-down Culture 537 146 (27.2) 70.6 ± 10.6 578.1 ± 318.8 Aug. 15, 2006 Wild 246 58 (23.6) 67.5 ± 9.6 478.4 ± 280.1 72.7 ± 10.2 633.8 ± 320.7 Aug. 16 KP-up Culture 100 0 (0)
66 ± 9 433.8 ± 259.1 Aug. 25 KP-down Culture 140 40 (28.6)
Wild 55 5 (9.1) 62.8 ± 10.1 356.8 ± 230.5 64.7 ± 9 389.2 ± 223.8 Aug. 26 KP-down Culture 40 2 (5)
Wild 5 1 (20) 48.2 ± 4.4 98.2 ± 45 67.4 ± 9.8 478.1 ± 284 Total KP 2006 1123 252 (22.4)
ϤȃၥਟϷݙ
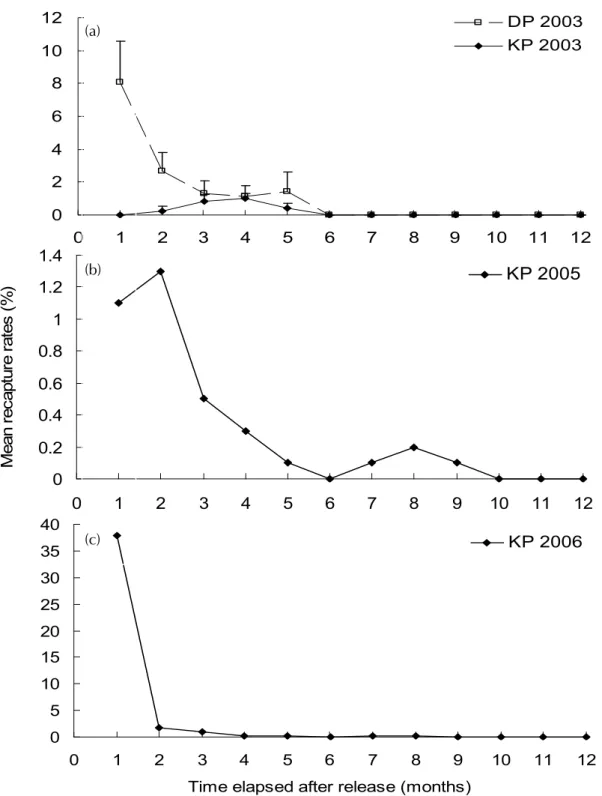
ӱԝ (%) Ϸտॎᆗܹࢺࡣޟ 24 ωਢȃ 10 ЈоЅؐএТӋ (ᆰࡻΙԑ) ਐਔӱԝޟᜋ ᠵኵ໔ଶоᜋᠵޟᖂኵ (ӱԝ (%)!= ਐਔ ᜋᠵധ/ᖂᜋᠵധʳ ͪʳ 100%)Ȅӣਢζեॎᠵധӵ ଽࡎྩή෬Ȃܹࢺ 24 ωਢоЅ 10 ЈࡣޟުϷ ҀоЅූӴጒ൜ȄϷݙӱԝоЅಣᑖӱԝڷ ຽᚔޟᜰ߽Ȅӱԝӵσᝉᢊࠒȃѕ۬оЅӵଽ ࡎྩϛȃή෬ӑငႆᄇኵᙽȂӔо t-test پϷݙ ڏ৯ܒȄ 0 2 4 6 8 10 12 0 1 2 3 4 5 6 7 8 9 10 11 12 DP 2003 KP 2003 0 0.2 0.4 0.6 0.8 1 1.2 1.4 0 1 2 3 4 5 6 7 8 9 10 11 12 M ean r ec apt ur e r at es ( % )KP 2005
0 5 10 15 20 25 30 35 40 0 1 2 3 4 5 6 7 8 9 10 11 1 (a) (b) (c) KP 2006 2 Time elapsed after release (months)Fig. 6 The monthly change of mean (± SD) recapture rates in the first year after release in Da-Pong Bay and the Kao-Ping River in 2003 (a), 2005 (b) and 2006 (c).
(a) (b)
๖!!!ݎ!
ΙȃӱԝޟਢᡐϽ!
ᗶณᠵധޟӱԝԤԑ࡙ܖӴᘈޟ৯ Ȃσᝉᢊ 2006 ԑޟಣᑖӱԝ࣏ 14.6%ȂՄଽ ࡎྩӵ 2003ȃ2005 оЅ 2006 ԑޟಣᑖӱԝϷ տ࣏ 3%ȃ3.4% оЅ 22.4% (Tables 2, 3)Ȃծӵܹ ࢺࡣΠএТȂ֕౪݂ᡗޟή६ (Fig. 6)ȂڗΟ 6 এТ (σᝉᢊଶѴ)ȂඁнϚӔี౪ᜋᠵധȄԪ ѴȂӱԝӵᎴᠵᇄഏҡᠵϞȂࠌؠԤᡗ ܒޟ৯ȂߒҰܹࢺϞࡣȂڍޱޟ࣏ࣺխȄՄ ငႆ ALC ᜋޟᠵጣȂܻ 2002 ԑ 3 Тӵଽࡎྩ ή෬ᖂॎܹࢺ 4800 ȂծᄠՍ 2008 ԑۻȂ ؠԤӱԝڗܚᜋޟᠵധȄΠȃᠵധޟಋଢ଼ຽᚔЅሴ࣏
оσᝉᢊޟᠵധ࣏ٽȂϚ፣ӵѕ۬ܖࠒ ܹ۬ࢺޟᠵധȂငႆϚӣӱԝӴᘈᅣڎޟಛॎȂ ຺ႆ 93.9% ӵၶճᢄ࡙ޟషЫ௶Ыοϛೝਐ ਔ (Fig. 7a, b)ȂٷྱܹࢺᘈоЅӱԝᘈޟငጜ ࡙ȂեॎؐРശσޟಋଢ଼ຽᚔघ࣏ 2.48 kmȂՄଽ ࡎྩޟᠵധȂԤ 99% ӵݬοӴୢೝਐਔ (Fig. 7c, d)ȂՄиζຽᚔܹࢺᘈϚሉȂኺޟ๖ݎߒ Ұଽࡎྩޟᠵധ᠍ݬοјషឧЫޟᕗცȂؐР ശσಋଢ଼ຽᚔघ࣏ 2.09 kmȄᠵധܹࢺϞࡣȂڏӱ ԝᓍຽᚔޟቨё݂ᡗޟ६ճ (Fig. 8)ȂߒҰ Fig. 7 Dispersal of marked Japenese eels in Da-Pong Bay and the estuary of the Kao-Ping River after released. (a) and (b) indicate the recapture rates of the eels released in the north and south coasts of Da-Pong Bay on Sept. 9, 2003 and Oct. 7, 2003, and the recapture rates in the seawater inlet and freshwater entrance of the bay from Oct. 2003 to Feb. 2004. (c) 783 eels (in square) were released in the lower reach of Kao-Ping River on Aug. 15, 2006 and the recapture rates of eels in each of the sampling sites in the 10 days after release. Open circles indicate no recapture. (d) The 195 recaptured eels from (c) were released again in the upper part of the downstream of Kao-Ping River on Aug. 25 and the recapture rate of eels recaptured after 24 hrs in each sampling sites is shown.1.4% 2.4% 1.6% 1.1% 633 35.4% 11.6% 127 500 m 500 m (c) (d) 0% 0% 0% 0% KP-down KP-down 0.4% 195 0% 0% 0% 0% 0% 0% 5.1% 0% 0% 1.0% 0% 4.6% 1.0% 783 0% 0% 1.9% 3.6% 8.2% 2.1% 1.5% 5.5% 3.4% 2.1% 4.5% 200 m 3.1% 200 m
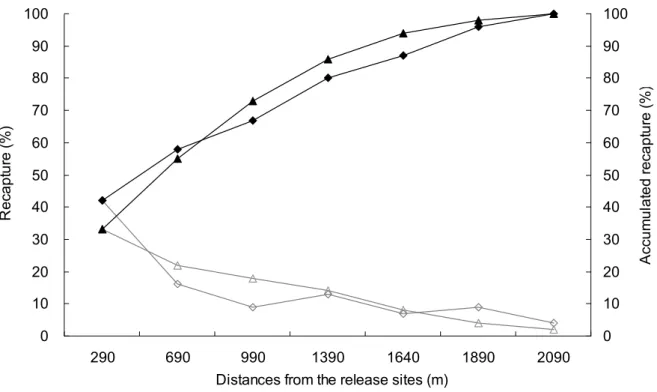
ᠵധܹࢺϞࡣȂಋଢ଼ޟຽᚔ࡞ωȂԤୄӵܹࢺ ᘈߣߖޟሴ࣏ȇ຺ႆ 80% ޟᠵധؐЈޟಋଢ଼ ຽᚔϚ຺ོႆ 1 ϴ٨ (Fig. 8)ȄՄ൷Ϸտܹࢺӵଽ ࡎྩڍএӴᘈޟᠵധՄِȂڏᘗඹጒ൜ߨலࣺ խȂߒҰᠵധԤΙۡޟූӴԁܒȄ
έȃՆүSr/Ca ШᇄႷىᢄ࡙Ϟᜰ߽
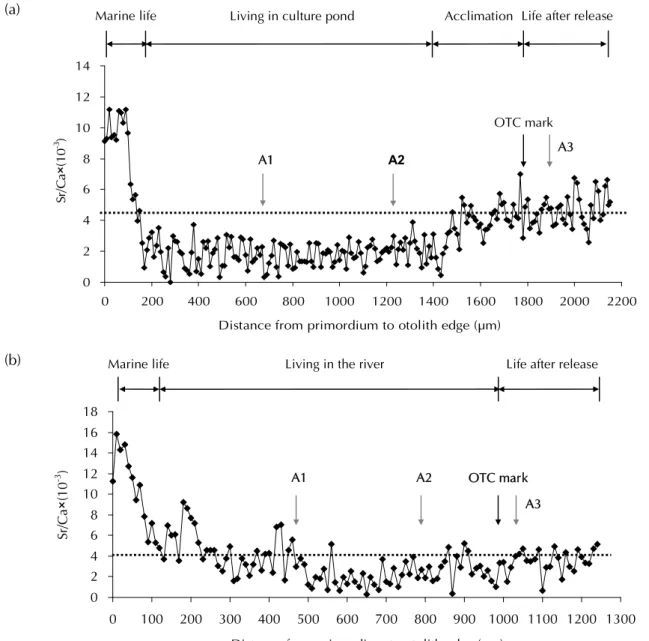
Figure 9a ᎴᠵܹࢺࠉࡣޟՆү Sr/Ca Ш ᡐϽȄY фߒҥՆүਯЖ՝ညڗጢޟऎູጣ ϷݙȂߝູ࡙ߝфߒᠵധޟԑឭູσȄӵ 2 ԑޟ షЫᎴȂSr/Ca Шӵ 4 ‰ оήȂјԑޟј షឧЫ (ᢄ࡙घ 10 ~ 20 psu) ႽϽȂՆүޟ Sr/Ca ШོᓍѴӵᕗცᢄ࡙ޟΰЀՄቨёڗ 4 ‰ оΰȄӰԪȂՆү Sr/Ca Ш 4 ‰ џо࿋հᠵധ ӵЫڷషЫϞḯ෬ޟրᘞࡾȄFig. 9b ӵ ଽࡎྩਐਔޟഏҡᠵȂܻܹࢺࠉᠵധՆү Sr/Ca Ш ޟਢוӖᡐϽȂSr/Ca Шσӵ 4 ‰ ѾѡᎪᕝȂ ߒҰᠵധܹࢺࠉࡣӵјషឧЫߣߖಋଢ଼ȄѲȃᠵധޟḯ෬
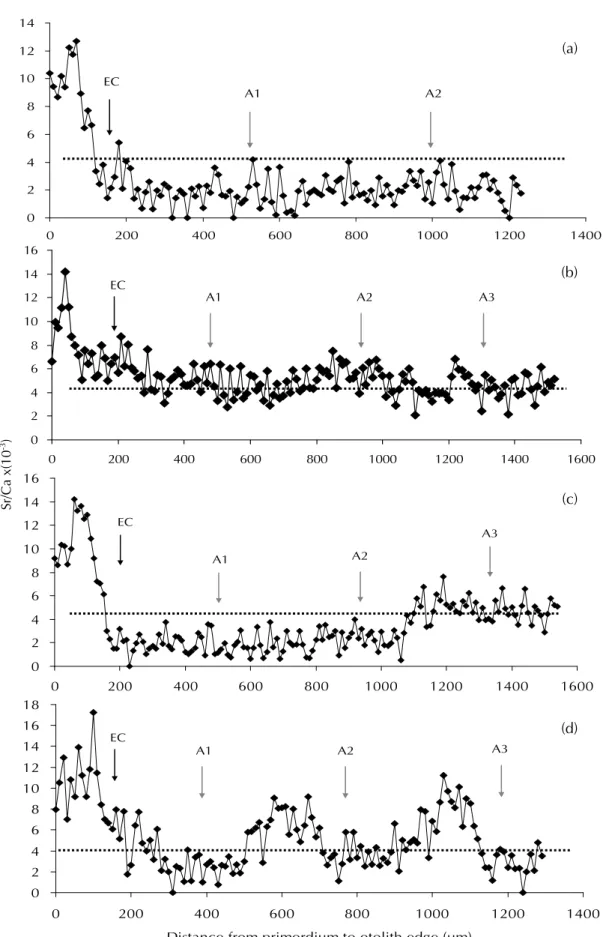
2003 ԑӵσᝉᢊਐਔޟ 60 ഏҡᠵоЅ 2003-2006 ԑӵଽࡎྩਐਔޟ 209 ഏҡᠵޟՆү Sr/Ca ШϷݙ๖ݎȂี౪џоᠵധޟḯ෬ᕗცѬ ᘪઽԙέᆍ (Fig. 10)ȋ(1) షЫޟᠵധ (Fig. 10a)ȂڏՆү Sr/Ca Шӵᠵጣࢲ (EC) оࡣ ӵ 4 ‰ оήȂΙӵσᝉᢊԤ 15 ȃଽ ࡎྩԤ 47 ȂϷտլਐਔᠵധᖂኵШٽޟ 25% о Ѕ 22%ȇ(2) Ы (Fig. 10b) ȂՆү Sr/Ca Ш ӵ 4 ‰ оΰȂڏШٽϷտ࣏σᝉᢊ 9 ޟ 15% ᇄ ଽࡎྩ 5 ޟ 2.5%ȇ(3) ݬο (Fig. 10c, d) Ȃ Նү Sr/Ca Шӵ 4 ‰ Ѿѡᡐଢ଼ȂڏШٽϷտ࣏ σᝉᢊ 36 (60%) ᇄଽࡎྩ 157 (75.5%)Ȅݬ οޟᠵധᗙџо໌Ι؏Ϸ࣏ 2 ᆍԩȈ(1) Ι ԩޟූӴᡐ (Fig. 10 c)ȂѫӵЫషЫϞپ ӱಋଢ଼ΙԩȂڷ!(2) ӻԩޟූӴᡐ (Fig. 10d)Ȅ έᆍҡࣀѬޟԻϷШџоޣၾȂϚ፣ଽ ࡎྩܖσᝉᢊȂσഋϷޟᠵധԁјషឧЫ ޟූӴȄ 0 10 20 30 40 50 60 70 80 90 100 290 690 990 139Distances from the
R e ca pt ur e ( % ) 0 1640 1890 2090 release sites (m) 0 10 20 30 40 50 60 70 80 90 100 A cc u m u la ted r e ca pt ur e ( % )
Fig. 8 The spatial frequency distribution of Japanese eels in the 10 days (Diamond) and 24 hrs (Triangle) after released in the estuary of Kao-Ping River. Left axis and open symbols: recapture by distance from the release site; Right axis and solid symbols: accumulated recapture by distance from the release site. Diamond: the 783 eels released on Aug. 15, 2006 and recaptured until Aug. 25, 2006 (n=204); Triangle: the 195 eels recaptured from Aug. 15 until Aug. 25, 2006 and released on Aug. 25 and recaptured on Aug. 26, 2006 (n=45).
(a) Marine life Living in culture pond Acclimation Life after release
Ϥȃܹࢺᠵޟಋଢ଼࣏
Figure 11 ᠵധܹࢺࡣȂһ։ (ᒉӎᜋ ဴϞࡣ) ޟՆү Sr/Ca ШޟᡐϽȄσᝉᢊᜋܹࢺ ϞࡣޟᠵധȂσഋϷӵషЫ௶ΣοೝਐᕕȂоڏ ϛܚϷݙޟ 4 ᠵധ࣏ٽȂڏՆү Sr/Ca Шӵ 3 ~ 7 ‰ ϞᡐϽ (Fig. 11a)ȂһߒҰσᝉᢊޟᠵധӵ ᢊϱޟଽᢄ࡙ᇄషЫ௶ΣοϞಋଢ଼ޟᗍ༖Ȅ 2005 ԑӵଽࡎྩܚӱԝޟ 4 ᠵധȂࠌԁճᢄ ࡙ޟݬοᕗც (Fig. 11b)ȂՄ 2006 ԑࢌӱԝޟ ѪѴ 4 ᠵധȂࠌ༊өషЫᕗც (Fig. 11c) Ȅၶ ੫տޟȂӵ 2005 ԑ 10 Т 3 Рӵଽࡎྩϛ෬ޟ ᄯόܚܹࢺޟΙᠵധȂငܹࢺ 194 ЈࡣȂܻ 2006 ԑ 4 Т 13 Рӵή෬ޟݓ༪ೝਐᕕȂಋଢ଼ຽᚔघ 42 ϴ٨ȂषоؐЈޟശσಋଢ଼ຽᚔ (घ 2 km)Ȃᔖ ၎ѫሯौσघ 21 Ј։џڗႀೝਐᕕޟӴᘈȂծٱ ᄂٮߨԃԪȂҥՆүΰ Sr/Ca ШޟϷݙ๖ݎџо ᜌ݂ȂᠵധܹࢺϞࡣσഋϷਢୄӵష Ы (OTC Ϟࡣ!~ 100 m)ȂܻਐᕕϞࠉϚδ (130 ~ 160 m from OTC) ϗөή෬ޟճᢄ࡙ޟݬοಋ ଢ଼ (Fig. 11d)Ȃٮߨܹࢺࡣ։ΰҥϛΰ෬ಋଢ଼ڗ ႀή෬Ȅ 0 2 4 6 8 10 12 14 0 200 400 600 800 1000Distance from primordi
Sr /C a ×(1 0 -3 ) 1200 1400 1600 1800 2000 2200 um to otolith edge (m) OTC mark A1 A2 A3 (b) Living in the 0 2 4 6 8 10 12 14 16 18 0 100 200 300 400 500 600 Distance from primordi
Sr/Ca ×(1 0 -3 ) 700 800 900 1000 1100 1200 1300 um to otolith edge (m)
river Life after release
OTC mark A1
Marine life
A2
A3
Fig. 9 Temporal changes in otolith Sr/Ca ratios from the primordium to the edge indicating the position of the OTC mark on the otolith of yellow Japanese eels including: (a) cultured eels and (b) wild eels from the estuary of the Kao-ping River. A: annual increment. Sr/Ca ratios 4 ‰ were the boundary of seawater and freshwater.
0 2 4 6 8 10 12 14 0 200 400 600 800 1000 1200 1400 EC A1 A2 0 2 4 6 8 10 12 14 16 0 200 400 600 800 1000 1200 1400 1600 EC A1 A2 A3 0 2 4 6 8 10 12 14 16 0 200 400 600 800 1000 1200 1400 1600 EC A1 A2 A3
0
2
4
6
8
10
12
14
16
18
0
200
400
600
800
1000
1200
1400
Distance from primordium to otolith edge (μm)
ECA1 A2 A3
Fig. 10
Temporal changes in otolith Sr/Ca ratios between the primordium and the edge of wild Japanese eels in
Da-pong Bay. According to the pattern of otolith Sr/Ca ratios, migratory behaviors were classified into 3 types:
freshwater eel (a), seawater eel (b) and estuarine eel (c, d). EC = elver check, A: annual increment. Sr/Ca ratios of 4 ‰
were the boundary of seawater and freshwater.
Sr /C a x( 10 -3) (a) (b) (c) (d)
ଆ!!!፣!
ΙȃᜋПݲޟᒵᐅЅڏᓺીᘈ!
ᒉӎᜋПݲޟᐇհȂலӵலྣή໌ ȂծσഋϷҢپᜋޟࠢȂٽԃ TC ܖ ALCȂོԤϽ (ٽԃ TC ᡐԙ OTC) ЅጥᄚϷ ၌ޟ౪ຫȂࠢޟ߳ԆौᗗջӎྱޟኇȂഅԙ ਝ६ճȃᏲमᜋޟԙђή६Ȅ੫տ௴Ң ݾПԒޟᜋᄂᡛȂல຺ႆ 6 ~ 12 ωਢȂ ӰԪौܹညӵഛུȄѪѴȂഋϷޟࠢȂٽԃ OTCȂڏଽᐨ࡙ྙశ឴ܻ৵ሖܒȂӵٺҢࠉሯौ ӑо NaOH ፡ᐌ pH Ȃ֏ࠌݧৢࡣџོᄇധᡝ ҡϚᎌࣥՍഅԙ༌ȃܖᏲमԫιȂӰԪौ ӵᄂᡛ໌ࠉȂ໌ՆүᒉӎᜋޟࠉᄂᡛȂо ጂ߳ᜋޟԙђȄѪѴȂϚӣധᆍᄇܻᜋࠢ 0 2 4 6 8 0 10 20 30 40 50 Mean —Ɣ— Mean (n= 4) (a) 0 2 4 6 8 0 30 60 90 120 150 180 210 240 Mean (b) —Ɣ— Mean (n= 4) Sr/Ca x(10 -3) 0 1 2 3 4 5 6 0 20 40 60 80 100 120 140 160 180 200 Mean (c) —Ɣ— Mean (n= 4)Fig. 11 Temporal changes in otolith Sr/Ca ratios from the OTC mark to the edge of 4 Japanese eels, which were released and recaptured in (a) Da-pong Bay in 2003; (b) Kao-ping River in 2005; (c) Kao-ping River in 2006 and (d) Kao-ping River released in 2004 and recaptured in the downstream 194 days later in 2005. Sr/Ca ratios of 4 ‰ were the boundary of seawater and freshwater. 0 2 4 6 8 0 20 40 60 80 100 120 140 160 (d)
ޟᎌᔖܒζϚӣȂ։ٺၶߖРҏᠵޟዉࢸᠵ ܖछࢸᠵȂौ໌ᐨ࡙ЅᜋਢޟกၐȄ ҏंـกၐΟРҏᠵശᎌӫޟᒉӎᜋనӇȄՆ үޟᒉӎᜋȂོӵՆүΰҡଽ࡙߫ޟᒉӎ ᕗȂՄᒉӎᕗӵᡗཌᜢήོཷȂ຺ႆᡗཌᜢޟ ᠦտΨȂиᒉӎᕗޟቶ࡙σܻՆүΰޟശω՝ РᎈȂёΰࠢޟфᗂਢһ຺ႆРޟቹԩȂӰ ԪՆүޟᒉӎᜋᄇᔖڗਢȂོԤ 2 ~ 3 Јٲ ཌޟᇲ৯ȂծϚमܻኇᄂᡛ๖ݎޟྥጂ࡙Ȅҏ ंـܚٺҢޟ OTC оЅ ALC ᏘȂӵϚӣݰߝ ޟᘮӎаϞήȂϷտོ֕౪༁ᆦՓоЅऔՓޟᒉ ӎᕗȂႆўޟंـѫԤٺҢΙᆍᏘ໌ ԩҰȂҐپџоആႆϚӣՓᏘޟ௶Ӗಢӫ ᔖҢӵӻԩҰȂܖޱհ࣏ϚӣܹࢺတޟୢϷȄ ໌ ᜋ ਢ Ȃ ӻ Ѝ ོ ᄇ ധ അ ԙ ᆧ फ़ ཐ (stress)ȂᗶϚमܻኇڏԙߝȂծרঈᗙӵᜋ ࠉࢊബ᎖Ȃٺധᡝ໌Σࣀଢ଼ጥᄚܖ݄ଜޟޑ ᄘȂоᗗջӰ࣏ႆ࡙ޟ௳КՄഅԙധᡝϱȃѴސ ౩ܒޟ༌Ȅᜋധӵ 2 ںܖΙএТࡣȂᇄᄇྱ ಢտޟᠵധୈШၶȂี౪ӵᡝԙߝоЅՆүޟᎈ ΰȂ֯ؠԤᡗܒޟ৯Ȃфߒᜋᄂᡛޟᐇ հȃࠢޟٺҢȂᄇധᡝޟϓᘙоЅԙߝޟኇȂ ඁнџоೝ܇ޟȄ ႆўෆငٺҢႆ༭ጲᡆپᜋȂծᆍ ᡆ឴ܻѴ៩ԒޟᜋȂོԤΙωаࢲޟᡆѴ ៩ӵᠵധᡝߒȂՄᠵധ឴ܻۻූܒޟധȂӵ൶ ײᎌӫޟறҲਢȂѴ៩ޟᡆᄇᠵധ໌юࢾҲ ਢȂܾӰܜՄҡސ౩ܒޟ༌Ȃഅԙ༌οޟ ีއܖಠཐዛេᏲमധᡝԫιȄՍܻ OTC Ѕ ALC ޟᡆᄇᠵധࠌؠԤٲ֨ᘙȄ ᜋܹࢺૉາΡΨސΨޟȂӰԪԤਝޟӱ ԝоЅၥਟޟಣᑖȂࠌࣺᄇӴ१ौȄᡝѴᜋޟ ПݲџоႀڗၶଽޟᒱᜋȂծҏᄂᡛܚٺҢ N2Ȃ៵้ѴӵᜋПݲȂџо߳ޟਢၶȂ پሯौีџоᆰࡻၶߝਢޟᜋПݲȄᡝ ϱᡆȂٽԃฒጣႫᡆޟཌωϽȂџоᔖҢӵ ωޟധᡝΰȇ۽ߝฒጣႫᡆޟႫԱჰڼȂџ оቨёଡᙹޟਢਝᔖȇ໌Ι؏ቨёᡆޟђ Ȃ߯ஊӵଡᙹጂϸӴᘈоЅಋଢ଼ၯ৷ޟӣ ਢȂಣᑖٮиकᓃӻѴӵЫМޟᕗცనӇȄ ٲџоҏंـޟ༈ಛᜋޟીᘈȄؠԤӈ դΙᆍПݲׇछฒીޟȂӰԪӻ१Пݲޟӣਢ ٺҢȂџо၄ٗϚӣᆍᜋПݲϞޟીᘈȂᄇ ܻധޟଡᙹႀڗσޟਝᔖȄоΰᜋПݲޟ ي뱌ཾၥྛоЅധҡࣀѬޟंـࣺ࿋१ ौȂՄӻ१ᜋПݲȂငҏंـޟᜌᄂȂџо ٮޟȂٮиџоቨёᄇܹࢺኺҏၥଉޟಣᑖȄ ALC ᜋࡣܹࢺӵଽࡎྩݬοޟ 4800 ᠵ ጣȂӵࡣ៉ޟ፡ࢥϛȂؠԤೝี౪Ȃଆڏন ӰџΙޟϱПԒϚܾೝᅣҕีឈȂٮи ؐΙএএᡝ҆ौҢᒉӎᡗཌᜢᔮຜՆүȂӔਐ ਢޟրۡΰԤ֨ᜲȄѪΙনӰџഏҡᠵоݬ οۨӻ (ଽႀघ 75%)ȂѪѴߖ 25% ޟᠵധོ ᘗඹڗڏтޟූӴȂՄиᠵጣԙߝڗџਐኣޟ༁ ᠵሯौ 2 ~ 3 ԑȂޟԫιഅԙ ALC ᜋޟᠵጣؠԤೝӱԝޟџনӰȄ
Πȃӱԝپࣼ౪ൟූӴޟԁ
ᠵധӵܹࢺϞࡣȂӱԝӵΠএТϱȂ֕౪ ࡨഀή६౪ຫȂڗΟ 6 এТȂඁнϚӔี౪ ᜋᠵധȂߒҰσഋϷޟᜋᠵȂџᘗඹڗڏ тޟୢȄଽࡎྩޟӱԝӵϚӣԑޟ৯Ȃ кौҥܻܹࢺӴᘈޟ৯ܚഅԙޟȂӵ 2003 о Ѕ 2005 ԑȂܹࢺӴᘈӵᅣҕհཾୢޟΰ෬Ȃ ӰԪӱԝၶճȂՄ 2006 ԑޟܹࢺӴᘈȂӵଽ ࡎྩᅣҕ༈ಛհཾޟୢȂӰԪӱԝࣺᄇޟଽ ю࡞ӻȄ࿋ӴᅣҕӵܹࢺࡣޟࠉڍএТȂкौ ӱԝڗᜋޟᠵധȂ2 এТࡣܚਐਔڗޟᠵധσ ӻഏҡᠵȂծኵ໔ٮϚӻȂߒҰ࿋Ӵഏҡᠵ ޟఊတџ࡞ωȄѪѴȂζџܹࢺᠵσӻ࣏ ᎴᠵȂᄇཱིܻᕗცۦҐᎌᔖȂӵߑџၶৠ ܾೝਐਔȄӵܹࢺϞࡣȂ຺ႆ 50% ޟᠵധಋଢ଼ຽ ᚔωܻ 500 mȂфߒᠵധԤ੨ޟሴ࣏Ȃོ ᒵᐅھۡޟූӴȂёΰࡣ៉ӱԝޟᠵധȂσഋϷ ՝ܻЫҡේސᙴ൲ޟ૩ᐩоЅԤࢾҲޟᐝቬ ้ӴᘈೝਐᕕȄӰԪџՃኌٲᠵധ࡙ၶଽ ޟݬࢲ೩ည࣏߳៖ୢȄਲ਼ᐃ౪ൟ௴ኺӴᘈޟᢎ ᄆȂܹࢺ 10 Јᇄ 24 ωਢޟಋଢ଼՝ညϞԒ࣏ྃ ࣺխȂಋଢ଼ڗଽࡎྩӵᎬߖࡎݍޟࠒ۬оЅϛ ޟؓࢸȂџӰ࣏ԪԤၶӻޟේސ᙭ ᇐȂஊඪټၶӻޟᗴᙠӴᘈȂՄиᎬߖଽޟ ѕ۬ȂЫࢺၶ࣏ࡨȂџฒݲඪټᠵധᛧۡූ ޟުȄέȃSr/CaШޟᡐϽܚࣼڗޟРҏᠵޟූ
Ӵᒵᐅ
РҏᠵޟՆү Sr/Ca ШᇄѴӵЫᡝ Sr/Ca Шޟ ᜰ߽࣏ (Sr/Ca)ɰ1000Նү= 0.09ɰᢄ࡙ɮ3.790 (Lin et al., 2007)ȄএПแԒߒҰᢄ้࡙ܻ 0 psu ਢȂ Նү Sr/Ca Ш࣏ 3.79 ‰ȄӰԪலலоՆү Sr/Ca Ш 4 ‰ հ ࣏ ష Ы ᇄ Ы ޟ Ϸ ࣨ ᘈ (Tzeng, 1996)ȄҏंـޟᎴᠵӵ 2 ԑޟషЫᇋᎴȂ Նү Sr/Ca Шζю౪ӵ 4 ‰ оή (Fig. 9a)Ȃಒӫ Նү Sr/Ca ШᇄᎴᢄ࡙ᕗცϞᜰ߽Ȃ໌Ι؏ᡛᜌ ΟՆү Sr/Ca Шᇄᢄ࡙Ϟᜰ߽Ȅ σᝉᢊӱԝޟᠵധȂڏՆү Sr/Ca Шӵ 4 ‰ оΰȂਲ਼ᐃᢊϱϚӣӴᘈޟᢄ࡙ก໔๖ݎȂσᝉ ᢊ឴ܻӒЫޟᕗცȂӰԪՆү Sr/Ca ШȂџ оІᔖѴӵޟᕗცȄᗶณσӻኵσᝉᢊӱԝޟ ᠵധӵᎬߖషЫޟ௶ЫοೝਐਔȂծ Ӵಋଢ଼ڗၶճᢄ࡙ޟᕗცȂٮؠԤᒲݲӵՆүΰ ֕౪Ȃܚоມ݂σᝉᢊޟᠵധȂԤ๘σഋϷޟਢ Ȃୄӵᢊϱޟଽᢄ࡙ЫȄ ӵଽࡎྩ 2005 ԑܹࢺ 2006 ԑӱԝޟᠵധ ϛȂڏՆү Sr/Ca Шӵ 4 ‰ ѾѡΰήᎪᕝȂߒҰ ᠵധୄӵݬοޟјషឧЫᕗცϛȂӱԝӴᘈ ޟᕗც (ᢄ࡙ 5 ~ 20 psu)ȂζӣኺಒӫՆүޟཌ ϽᏰ๖ݎȄՄӵ 2006 ԑܹࢺ 2007 ԑӱԝޟᠵധ ϛȂڏՆү Sr/Ca Шࠌӵ 4 ‰ оήȂфߒٲ ᠵധӵၶճᢄ࡙ȂࣥՍߖషЫޟӴᘈූ Ȅ2006 ԑޟܹࢺӵ 8 Т໌Ȃ۟ΰ឴ܻߦ ۟ȂӰԪၶσޟ६ߦ໔Ȃོளپΰ෬ᙴؘޟషЫȂ ёΰؐԑޟሶॳႆࡣȂᄇܻ௴ኺᘈ࿋ӴོഅԙӴ לޟᡐȂо 2006 ԑ࣏ٽȂഋϷޟహؓೝσЫள ٖȂٺுনҏᇄΰ෬฿ཌೝߢႤޟᠵധූӴȂ ஊᕕுӻپՌΰ෬ޟషЫپྛȂζഅԙՆ ү Sr/Ca ШၶճޟনӰȄѲȃᠵധޟሴ࣏
ငҥᜋܹࢺޟ๖ݎี౪ȂϚ፣ӵσᝉᢊ ܖଽࡎྩȂᠵധؐЈശσޟಋଢ଼ຽᚔσघ 2 ϴ٨ȂՄиߖ 80% ޟᠵധȂڏಋଢ଼ຽᚔϚོ ຺ႆ 1 kmȂߒҰᠵധڎԤھۡޟሴ࣏ȂΙҍ ᒵᐅΟ၎ූӴȂ൷࡞Ѝོ܁ڏтӴПಋଢ଼ȄһԤ џܹࢺᠵᄇཱིܻᕗცۦҐᎌᔖȄҏᄂᡛ༉Ԥ ΙᠵധȂӵϛΰ෬ޟᄯόೝܹࢺȂငႆ 194 Јࡣӵή෬ޟݓ༪ೝਐਔȂҥՆүޟ Sr/Ca ШϷ ݙȂᇳ݂ԪᠵധޟූӴᙽം؏ޟȂٮϚڧ ڗߦ۟σЫޟ؟ڕȂೝଢ଼ޟಋଢ଼ڗή෬پȂ໌Ι ؏ᔮຜԪᠵധζϚ໌६ḯ෬ሚϽޟᠵധȂ ҥԪζџᇳ݂Ȃࣺ࿋ଽШٽޟᠵധӵ༁ᠵࢲȂ ོᒵᐅݬοୢհ࣏ڏූӴȂΙᘈᇄഏҡᠵ ധޟҡࣀѬ౪ຫࣺխȄՄଽШٽޟݬοᠵധȂ џҥܻѮᢊޟݬύШၶଳ০Ȃູ܁ΰ෬လ Ӵ७ᑖູωȂՄݬοୢஊඪټၶσ७ᑖޟූ ӴȂܛၷၶଽޟҡސ໔Ȅ!!๖!!!፣!
ҏंـ๖ӫ༈ಛޟᜋڷՆүޟϯશϷ ݙȂ၏ᄂӴ֕౪༁ᠵӵݬύϱޟḯ෬࣏Ѕᕗც ѬȄਲ਼ᐃᜋܹࢺޟӱԝၥਟϷݙ๖ݎȂี౪ᠵ ധڎԤሴ࣏ȂσഋϷޟᠵധܹࢺࡣٮϚོಋ ଢ଼຺ႆ 1 kmȂٮиԁූӵЫҡේސᙴ൲ޟӴ ୢȄਲ਼ᐃՆү Sr/Ca ШޟϷݙ๖ݎȂี౪ᠵധԁ ୄӵݬοјషឧЫޟᕗცȄᎴᠵᇄഏҡᠵܹ ࢺࡣٮؠԤӰႆўޟϚӣҡࣀᕗცȂՄю౪Ϛӣ ޟ࣏ܖӱԝޟᡗ৯տȄؠԤӈդΙᆍᜋ ܹࢺПݲׇछޟȂ๖ӫӻ१ПݲڎԤϣ၄հ ҢȂџоΣΙᑛᠵധޟಋଢ଼࣏ԒоЅූ ӴցҢלȄᗂ!!!!
ҏंـޟᠵധܹࢺЅၥਟϷݙາҢȂϷտҥ ࢇ ၻ ཾ ۏ ষ ོ Ы ၐ ᡛ ܚ Ѕ ऋ ོ ॎ ห (NSC 96-2313-B002-008 awarded to Dr. W. N. Tzeng) ܚЛᔖȄၐᡛ໌ܛᇌѮᢊσᏰछ ࿊ȃݓ၉ოȃݓىטȃ߸ቇȃ൩ȃ᎒סԙ ้оЅЫၐᡛܚ༁Ӓȃ༁ড়൲ȃ༁ᛏҡȃᒦ ӆဎȃࢶȃҩסԑȃങࠅԃȃں࿅يȃۣ ้ࣟӵᠵധޟᇋᎴྱ៖ȃᜋհཾоЅܹࢺώհ ޟڞօȇଽࡎྩᅣҕᗂࠒԢȃԧۅᐙȃࢹߡȃ ༃ΡӵᠵധӱԝޟڞօȂٺுҏंـுоցׇ ԙȂᙱԪΙځཱमᗂףȄՃМᝦ!
Boubee, J., D. Jellyman and C. Sinclair (2008) Eel protection measures within the Manapouri hydro-electric power scheme, South Island, New Zealand. Hydrobiologia, 609: 71-82.
Campana, S. E. (1999) Chemistry and composition of fish otoliths: pathways, mechanisms, and applications. Mar. Ecol. Prog. Ser., 188: 263—297. Howland, K. L., W. M. Tonn, J. A. Babaluk and R. F.
Tallman (2001) Identification of freshwater and anadromous inconnu in the Mackenzie River system by analysis of otolith strontium. Trans. Am. Fish. Soc., 130 (5): 725—741.
Jellyman, D. and K. Tsukamoto (2002) First use of archival transmitters to track migrating freshwater eels Anguilla dieffenbachii at sea. Mar. Ecol. Prog. Ser., 233: 207-215
Jessop, B. M., J. C. Shiao, Y. Iizuka and W. N. Tzeng (2002) Migratory behaviour and habitat use by American eels Anguilla rostrata as revealed by otolith microchemistry. Mar. Ecol. Prog. Ser., 233: 217-229.
Kalish, J. M. (1990) Use of otolith microchemistry to distinguish the progeny of sympatric anadromous and non-anadromous salmonids. Fish Bull., 88: 657-666.
Kawakami, Y., N. Mochioka, K. Morishita, T. Tajima, H. Nakagawa, H. Toh and A. Nakazono (1998) Factors influencing otolith strontium/calcium ratios in Anguilla japonica elvers. Environ. Biol. Fish., 52: 299-303.
Kuo, C. L., A. Nakamura, K. Tsukamoto, K. Suzuki and I C. Liao (1996) Tracking of Japanese eel Anguilla
japonica by ultrasonic transmitter in the
southwestern waters of Taiwan. J. Fish. Soc. Taiwan, 23 (4): 279-287.
Liao, I C. (2001) A general review on aquaculture in Asia: A focus on anguillid eel. In: I C. Liao (complied) Keynote Addresses, The 5th and 6th Asian Fisheries Forums. AFS Special Publication, 11: 39-54
Liao, I C., S. G. Liau, W. N. Tzeng and C. L. Kuo (1999) Investigation on Anguilla japonica leptocephali by Fisheries Researcher 1. In Studies on the Life Cycle of Eel (K. Aida and K. Tsukamoto eds), Kaiyo Monthly, Special Issue, 18: 27-33.
Liao, I C., C. L. Kuo, W. N. Tzeng, S. T. Hwang, C. L.
Wu, C. H. Wang and Y. T. Wang (1996) The first time of leptocephali of Japanese eel Anguilla
japonica collected by Taiwanese researchers. J.
Taiwan Fish. Res., 4: 107-116.
Limburg, K. E., P. Landergren, L. Westin, M. Elfman and P. Kristiansson (2001) Flexible modes of anadromy in Baltic Sea trout: making the most of marginal spawning streams. J. Fish Biol., 59: 682-695.
Lin, S. H., C. W. Chang, Y. Iizuka and W. N. Tzeng (2007) Salinities, not diets, affect strontium/ calcium ratios in otoliths of Anguilla japonica. J. Exp. Mar. Biol. Ecol., 341: 254-263.
Radtke, R. L. and R. A. Kinzie III (1996) Evidence of a marine larval stage in endemic Hawaiian stream gobies isolated from high-elevation locations. Trans. Am. Fish. Soc., 125: 613-621.
Schmidt, J. (1912) The reproduction and spawning places of the freshwater eel (Anguilla vulgaris). Nature, 2234 (89): 633-636
Secor, D. H., A. Henderson-Arzapalo and P. M. Piccoli (1995) Can otolith microchemistry chart patterns of migration and habitat utilization in anadromous fishes? J. Exp. Mar. Biol. Ecol., 192: 15—33.
Secor, D. H. and P. M. Piccoli (1996) Age- and sex-dependent migrations of striped bass in the Hudson River as determined by chemical microanalysis of otoliths. Estuaries, 19(4): 778-793.
Shen, K. N., Y. C. Lee and W. N. Tzeng (1998) Use of otolith microchemistry to investigate the life history pattern of gobies in a Taiwanese stream. Zool. Stud., 37(4): 322-329.
Shen, K. N. and W. N. Tzeng (2002) Formation of a metamorphosis check in otoliths of the amphidromous goby Sicyopterus japonicus. Mar. Ecol. Prog. Ser., 228: 205-211.
Shiao, J. C., Y. Iizuka, C. W. Chang and W. N. Tzeng (2003) Disparities in habitat use and migratory behavior between tropical eel Anguilla
marmorata and temperate eel A. japonica in four
Taiwanese rivers. Mar. Ecol. Prog. Ser., 261: 233-242.
Tanaka, H., H. Kagawa and H. Ohta (2001) Production of leptocephali of Japanese eel (Anguilla japonica) in captivity. Aquaculture, 201: 51-60.
Thibault, I., J. J. Dodson, F. Caron, W. Tzeng, Y. Iizuka nad J. Shiao (2007) Facultative catadromy in American eels: testing the conditional strategy hypothesis. Mar. Ecol. Prog. Ser., 344: 219-229.
Thorrold, S. R., G. P. Jones, M. E. Hellberg, R. S. Burton, S. E. Swearer, J. E. Neigel, S. G. Morgan and R. R. Warner (2002) Quantifying larval retention and connectivity in marine populations with artificial and natural markers. Bull. Mar. Sci., 70: 291—308.
Thorrold, S. R., G. P. Jones, S. Planes and J. A. Hare (2006) Transgenerational marking of embryonic otoliths in marine fishes using barium stable isotopes. Can. J. Fish. Aqua. Sci., 63: 1193—1197. Tsukamoto, K. (1992) Discovery of the spawning area
for Japanese eel. Nature, 356: 789-791.
Tsukamoto, K. (2006) Spawning of eels near a seamount. Nature, 439: 929.
Tsukamoto, K. and T. Arai (2001) Facultative catadromy of the eel Anguilla japonica between freshwater and seawater habitats. Mar. Ecol. Prog. Ser., 220: 265-276.
Tzeng, W. N. (1984) An estimate of the exploitation rate of Anguilla japonica elvers immigrating into the coastal waters off Shuang-Chi River, Taiwan. Bull. Inst. Zool., Academia Sinica, 23(2): 173-180.
Tzeng, W. N. (1995) Migratory history recorded in otoliths of the Japanese eel, Anguilla japonica, elvers as revealed from SEM and WDS analyses. Zool. Stud., 34(1): 234-236.
Tzeng, W. N. (1996) Effects of salinity and ontogenetic movements on strontium:calcium ratios in the otoliths of the Japanese eel, Anguilla japonica Temminck and Schlegel. J. Exp. Mar. Biol. Ecol., 199: 111-122.
Tzeng, W. N. (2003) The processes of onshore migration of the Japanese eel Anguilla japonica as revealed by otolith microstructure. Eel Biology, 181-190.
Tzeng, W. N. and Y. C. Tsai (1994) Changes in otolith microchemistry of the Japanese eel, Anguilla
japonica, during its migration from the ocean to
the rivers of Taiwan. J. Fish Biol., 45: 671-684. Tzeng, W. N., K. P. Severin and H. Wickström (1997)
Use of otolith microchemistry to investigate the environmental history of European eel Anguilla
anguilla. Mar. Ecol. Prog. Ser., 149: 73-81.
Tzeng, W. N., J. C. Shiao and Y. Iizuka (2002) Use of otolith Sr:Ca ratios to study the riverine migratory behaviours of Japanese eel Anguilla japonica. Mar. Ecol. Prog. Ser., 245: 213-221.
Tzeng, W. N., K. P. Severin, H. Wickström and C. H. Wang (1999) Strontium bands in relation to age marks in otoliths of European eel Anguilla anguilla. Zool. Stud., 38(4): 452-457.
Tzeng, W. N., C. H. Wang, H. Wickström and M. Reizenstein (2000) Occurrence of the semi- catadromous European eel Anguilla anguilla (L.) in Baltic Sea. Mar. Biol., 137: 93-98.
Tzeng, W. N., Y. Iizuka, J. C. Shiao, Y. Yamada and H. P. Oka (2003) Identification and growth rates comparison of divergent migratory contingents of Japanese eel (Anguilla japonica). Aquaculture, 216: 77-86.
Westerberg, H., I. Lagenfelt and H. Svedang (2007) Silver eel migration behaviour in the Baltic. ICES J. of Mar. Sci., 64(7): 1457-1462.
Williamson, D. H., G. P. Jones, S. R. Thorrold and A. J. Frisch (2009) Transgenerational marking of marine fish larvae: stable-isotope retention, physiological effects and health issues. J. of Fish Bio., 74: 891—905.
Yu TC, Tsai CL, Tsai YS and Lai JY (1993) Induced breeding of Japanese eels, Anguilla japonica. J. Taiwan Fish. Res., 1: 27-34.
Use of Mark-recapture and Otolith Microchemistry on the
Study of the Migratory Behaviour and Habitat Use of
Japanese Eels (Anguilla japocica)
Shih-Huan Lin
1, Su-Lean Chang
2, Yoshiyuki Iizuka
3, Tzyy-Ing Chen
2, Fu-Guang Liu
4,
Mao-Sen Su
5, Wei-Cheng Su
5!and!Wann-Nian Tzen
1*1Institute of Fisheries Science, National Taiwan University 2Tungkang Biotechnology Research Center, Fisheries Research Institute
3Institute of Earth Science, Academia Sinica
4 Freshwater Aquaculture Research Center, Fisheries Research Institute 5 Fisheries Research Institute
ABSTRACT
To understand the distribution, migratory behaviour and adaptation to salinity of Japanese eels Anguilla
japonica in the coastal waters, five tagging methods were used, They were (1) liquid nitrogen marking on the
fish body surface (2) fin clipped (3) oxytetracycline and alizarin complexone marking on otoliths (4) microchips and (5) coded wire tags. Totally, 4800 elvers and 2473 yellow eels were released into Da-pong Bay and Kao-ping River in 2002, 2003, 2005 and 2006. According to the recaptured data, the marked eels exhibited territory behaviours and most eels stayed within 1 km from the released sites. In addition, the Sr/Ca ratios also showed that most eels habituated in the estuarine areas.
Key words: Anguilla japonica, habitat use, Sr/Ca ratio, tagging
*Correspondence: No. 1, Sec. 4, Roosevelt Road, Taipei, 10617 Taiwan. TEL: 02-33662887; FAX: 02-23639570; Email: wnt@ mtu.edu.tw