行政院國家科學委員會專題研究計畫 成果報告
青年型自發性脊柱側彎之脊柱柔軟度的量化分析
計畫類別: 個別型計畫 計畫編號: NSC92-2218-E-002-040- 執行期間: 92 年 08 月 01 日至 94 年 07 月 31 日 執行單位: 國立臺灣大學醫學工程學研究所 計畫主持人: 章良渭 計畫參與人員: 謝俊仁 報告類型: 精簡報告 處理方式: 本計畫可公開查詢中 華 民 國 95 年 1 月 9 日
Quantitative Determination of Spine Flexibility for Adolescent
Idiopathic Scoliosis
青年型自發性脊柱側彎之脊柱柔軟度的量化分析
計畫編號: NSC 92-2218-E-002-040- 執行期間: 92/08/01 ~ 94/12/31 主持人/執行單位: 章良渭 臺灣大學醫學院醫學工程研究所 AbstractSpinal flexibility has been used by clinicians in various medical procedures; clinicians usually misapprehend the concept of flexibility by examining patient’s “deflexibility”. The objective of this research was to determine spinal flexibility through the investigation of its relation to other patient parameters, such as growth factors, curve pattern, curve apex and curve magnitude. Ten adolescent idiopathic scoliosis (AIS) subjects were recruited. A measuring device was designed such that the corrective force could be recorded. Spinal orthoses were fabricated according to their molds and the in brace curve corrections were evaluated by their radiographs. Spinal flexibility was determined by correlation analysis of the patient parameters. The orthotic treatment prognosis was also predicted and would guide clinicians and patients to make right decisions and treatment plans.
Keywords:adolescent idiopathic scoliosis; spine flexibility: orthotic treatment. 中文摘要 臨床人員運用各種醫學方法量測脊柱的柔軟度;但臨床人員常將柔軟度誤解 為病人在檢驗時所能抵抗彎曲的能力。本研究的目的是藉由研究人體參數之間的 關係歸納而得脊柱的柔軟度,如影響成長的因子、脊柱曲線型態、曲線頂點位置 與大小。本研究有十位青年型自發性脊柱側彎的受試者參與。本研究設計一組儀 器以量測矯正力量的大小。臨床人員會依照取模後的石膏模型製作矯正背架,且 依據病人穿戴矯正背架後的 x 光片評估矯正的效果。脊柱的柔軟度可以藉由分析 人體參數之間的關係歸納而得。本研究結果可用來預測矯正背架治療的預後且提 供臨床人員和病人決定適合的治療計畫。 關鍵字:青年型自發性脊柱側彎,脊柱柔軟度,矯正背架治療 Introduction
Orthotic treatment is the most common method of non-operative treatment for idiopathic scoliosis. Ideally, spinal orthoses should be prescribed to patients with scoliosis with curves between 25° and 40°, or with curves less than 25°, who have a history of curve progression with a high risk for continuing progression. In this research, we strictly focus on the adolescent idiopathic scoliosis (AIS) since the age group from 10 to 18 has the largest population among idiopathic cases.
Clinical experience with the orthosis has led to many improvements, both in the design of the orthosis itself and in the manner that the orthosis is used. The spinal correction is related to many interconnected factors, which can be grouped into the
factors of spinal orthoses and the physical parameters of individuals. The former, the control variables and design parameters, include the shape and stiffness of the spinal orthosis, the application of pads (locations, sizes, and thicknesses of pads), patient’s compliance and the strap tension adjustment. The latter, the patient’s physical parameters, include the flexibility of the spine curves, the biomechanical properties of truncal tissues to transmit the applying forces of spinal orthosis, the locations of the major curve apexes, magnitudes of the curves, curve pattern, growth factors (gender, age), height, and weight.
The patient’s physical parameters are essential indicators for clinicians taking an effective action to correct the curves. They also provide important information to clinicians such that the prognosis of the orthotic treatment can be predicted. The more quantitative patient information, the better the clinicians can deliver the orthotic services. The patient parameters are particularly important when the patient is on the borderline of either taking non-operative treatment or taking operation. The quantitative patient parameters will improve the decision making process in choosing proper treatment procedures for clinicians and patients as well.
Spine flexibility is the most abstract parameter among all aforementioned patient parameters. It has been used to predict the operative outcome of scoliosis patients recently although clinicians usually misapprehend the concept of flexibility by examining patient’s deflection which has left the applied force unattended. Furthermore, the practice is not applicable to predict bracing outcome of scoliosis patients. In this research, we developed a method to quantify adolescent idiopathic scoliosis spine flexibility in coronal plane and to measure and use the maximum corrective force for orthotic treatment.
A quantitative determination of spine flexibility is particularly important for adolescent idiopathic scoliosis because it might relate to the prognosis of the orthotic treatment. It is worth of exploring how spine flexibility would facilitate the prediction of the prognosis for the orthotic treatment of adolescent idiopathic scoliosis. In turn, spine flexibility would provide essential information for medical teams to suggest patients when they are facing difficult decision between surgery and conservative treatment.
To investigate the factors that are related to progression of idiopathic scoliosis and the intriguing possibility of being able to use them to predict the prognosis in each patient, Lonstein J.E. et al. in 1984 reviewed 727 cases of patients with idiopathic scoliosis in whom the initial curve measured from 5 to 29 degrees. They found that scoliotic curve progression is related to the pattern and magnitude of the curve, the patient’s age at presentation, the Risser sign, and the patient’s menarchal status. In 1995, Peterson L.E. et al. used logistic regression analysis method to develop a predictive model of scoliotic spine curve progression. In 2002, Deviren V. et al. used correlation analysis to demonstrate an association between radiographic findings and the clinical presentation. Definition of flexibility in their study was the reductive percentage of Cobb angle between the standing and supine side-bending radiographs. Flexibility of the structural curve showed a high inverse correlation with curve magnitude (r=-0.7; P<0.001) and age (r=-0.6; P<0.001). Flexibility significantly decreases with increased age and curve magnitude. Although the scoliosis spine flexibility had been used in these three research, yet only curve correction (deflection) was measured. In textbooks, the flexibility was defined as the amount of deflection produced by applying a unit force. We believe the force information plays an essential role to the concept of structural flexibility only from which the maximum curve correction can be certain when given the measurement of
the maximum applied force. Unfortunately, it becomes a common practice that using no force information, clinicians examine the spinal range of motion and rely on their clinical experience to judge the spinal flexibility. In addition, to our knowledge, there was no published literature that has dealt with the quantitative prediction of scoliosis correction using the spinal flexibility.
Objective and Hypotheses
Spine flexibility in practice has been widely recognized by clinicians for various purposes such as preoperative evaluation, diagnosis, physical therapy etc.. Our hypotheses were (1) the scoliosis spine flexibility is related to the following patient parameters: patient growth factors, location of the curve apex, span of the curve, and curve magnitude, (2) the scoliosis spine flexibility can be quantitatively determined, (3) the maximum curve correction can be predicted when given the spine flexibility and the maximum corrective force.
The objective of this research was to determine spinal flexibility quantitatively by induction through the investigation of its relation to aforementioned patient parameters which can be readily available through the patient information, x-ray films and simple measurements. The prognosis then can be predicted provided the maximum pressure that the patient can tolerate is given.
Methods and Materials
Ten adolescent idiopathic scoliosis patients were included in this study. Patients were assessed and treated in National Rehabilitation Engineering Research Center (NRERC). Information was recorded from the medical chart including the patient’s gender, age, height, weight, Risser sign, vertebra rotation, and decompensation at initial treatment. The numbers of vertebra superior to the apex and inferior to the apex within the curve span were also recorded before the treatment. During molding for each patient, the magnitude of corrective force was measured. After fitting, vertebra rotation and decompensation were re-evaluated.
The structural flexibility has been used in engineering areas to specify the relation of an applied force to the corresponding deformation. The general structural flexibility f can be defined as follows,
P
f = δ , where δ is the deformation and F is the applied force. Two assumptions were made in this research, i.e., (1) The individual variations of the bone properties are ignored and (2) The orthoses are well designed such that the corrective forces remain the same as what presented in molding process.
To calculate the spinal flexibility, we simplified its definition of scoliosis spine on coronal plane as:
2 1 θ θ θ θ Cos FSin f = p − b
where f is the simplified flexibility of scoliosis spine on coronal plane;θ is the p magnitude of prebraced Cobb angle; θb is the magnitude of Cobb angle after bracing; is the magnitude of corrective force measured by force gage during the molding process;
F
1
θ is a transverse plane angle to describe the direction of F; θ2 is a coronal plane angle to describe the direction of F . A protractor and a level are simple tools to measure θ1 and θ2.
Results and Discussion
The average age when bracing began was 14.48 years (SD=2.16, range=11.08-17.42). The average height was 155.5 cm (SD=9.05, range=140-164). The average weight is 44.3 kg (SD=8.35, range=26-58). The average prebrace Cobb angle was 36.8° (SD=13.04, range=25°-66°). According to the definition and experiment data, the flexibility of each patient was calculated (Table 1).
No. Flexibility 1 3.44 2 1.30 3 1.82 4 2.13 5 8.83 6 1.94 7 5.41 8 1.80 9 5.74 10 1.07
Table 1 Patients’ Spine Flexibility calculated from experiment data
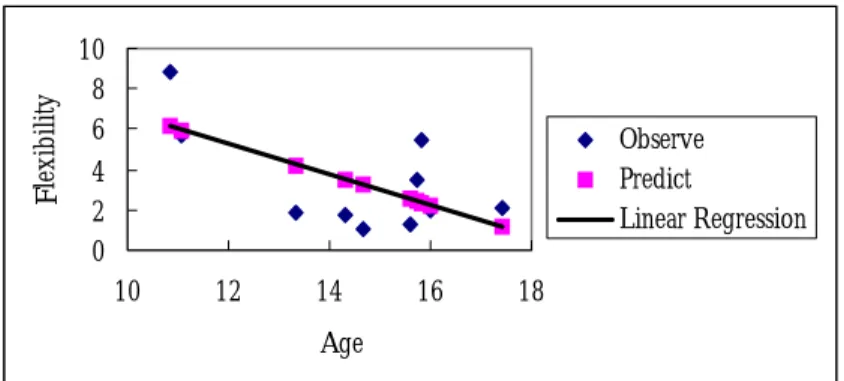
In this study, we found that the magnitude of scoliosis curves highly positively correlate with flexibility. The linear regression of each parameter is shown in Figures 1-4. 0 2 4 6 8 10 10 12 14 16 18 Age F le xi bility Observe Predict Linear Regression
0 5 10 130 150 170 Height F lex ib ility Observe Predict Linear Regression
Figure 2 Linear regression of height and flexibility
0 2 4 6 8 10 0 20 40 60 80
Prebrace Cobb angle
F lex ib ilit y Observe Predict Linear Regression
Figure 3 Linear regression of prebrace Cobb angle and flexibility
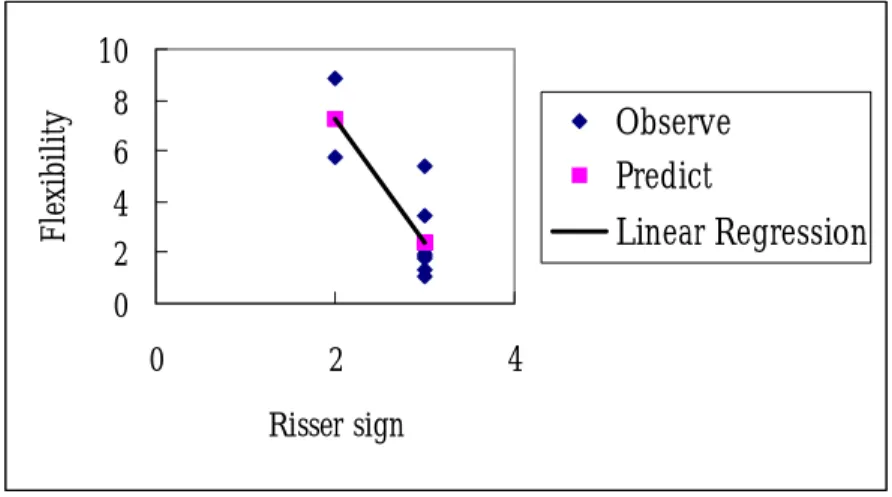
0 2 4 6 8 10 0 2 4 Risser sign F le xib ility Observe Predict Linear Regression
Figure 4 Linear regression of Risser sign and flexibility
The Pearson correlation coefficient R of age was –0.645 (Sig.=0.044); that of height was –0.626 (Sig.=0.053); that of prebrace Cobb angle was 0.871 (Sig.=0.001); and that of Risser sign was –0.82 (Sig.=0.004). The mathematical scoliosis spine flexibility model in this study was found from regression analysis and is listed as
-5.73 Risser sign
The predictive correction was calculated according to δ = fF, where F was
know ent re
Predictive Correction Experimental Correction
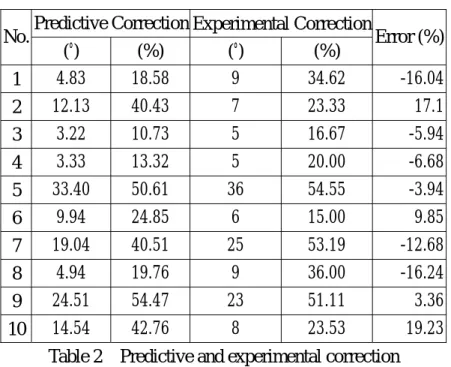
n. The predictive correction was compared with experim sults (Table 2). Statistical analyses of predictive and experimental correction are shown in Table 3. Mean error was –1.20% (S.D.=13.05%) and the prediction would give clinicians a powerful mean to assess the scoliosis. The maximum corrective forces of AIS patients reflect their tolerance of pressure.
No. Error (%) (°) (%) (°) (%) 1 4.83 18.58 9 34.62 -16.04 2 12.13 40.43 7 23.33 17.1 3 3.22 10.73 5 16.67 -5.94 4 3.33 13.32 5 20.00 -6.68 5 33.40 50.61 36 54.55 -3.94 6 9.94 24.85 6 15.00 9.85 7 19.04 40.51 25 53.19 -12.68 8 4.94 19.76 9 36.00 -16.24 9 24.51 54.47 23 51.11 3.36 10 14.54 42.76 8 23.53 19.23
Table 2 Predictive and experimental correction
N (%) Standard Deviation (%) Mean Predictive 10 31.60 Correction 16.00 E 10 32.80 15.47 xperimental Correction Error 10 -1.20 13.05
Table 3 S analys f pre and e ntal correction
eps to predict AIS patients’ correction: e
2. IS patients’ flexibility by the regression equation. tatistic es o dictive xperime
Therefore, we suggest clinicians three st
1. Apply proper corrective force to AIS patients according to patients’ pressur tolerance.
Calculate A
Correction = Flexibility × Corrective Force
The effectiveness ed by looking at
its co
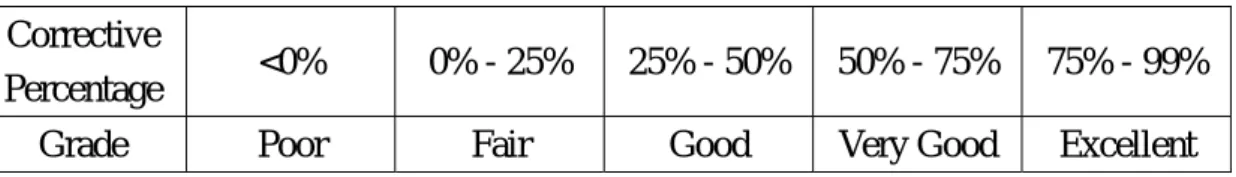
Corrective
<0% 0% - 25% 25% - 50% 50% - 75% 75% - 99% of the scoliosis orthotic treatment can be grad
rrective percentage (Table 4) in a similar manner for muscle strength test. Curve correction was divided into five grades: poor, fair, good, very good and excellent. Applied by the grading system, the prediction and experiment results of 10 AIS patients in this research were compared (Table 5).
Percentage
Grade Poor Fair Good Very Good Excellent
Table 4 C orrectio ng sy
No. Predictive Experiment urve c n gradi stem
Correction Correction
1 Fair Good
2 Good Fair
3 Fair Fair
4 Fair Fair
5 Very Good Very Good
6 Fair Fair
7 Good Very Good
8 Fair Good
9 Very Good Very Good
10 Good Fair Table 5 P tion and expe comparison in correction grading
onclusion
dy presented an adolescent idiopathic scoliosis spine flexibility model by u
redic riment
C
This stu
tilizing the definition of flexibility (curve correction/force) in engineering, by which the spine flexibility of each patient’s could be determined quantitatively. Corrective force in addition to the curve correction was included as a component of AIS spine flexibility. The magnitude of corrective force could help clinicians to design a suitable brace and avoid skin problem, which are highly dependent on patient’s tissue and pressure tolerance. The model therefore consists of AIS patients’ physical parameters (age, height and prebrace Cobb angle). The model could be used as a convenient tool for clinicians to assess AIS patients’ spine flexibility and
predict curve correction. It was found in this study that AIS patients with larger prebrace Cobb angle, smaller age, height and Risser sign had better flexibility. The results of this study would also guide clinicians to predict the grade of curve correction provided that the numerical value of the spine flexibility is given.
Refe nces
. Berven S. Kleinstueck F. Antinnes J. Smith JA. Hu SS. Predictors of
2. n JM. The prediction of curve progression in untreated
3. progression of the curve in girls who
re . Deviren V 1
flexibility and pain patterns in thoracolumbar and lumbar idiopathic scoliosis. Spine. 27(21):2346-9, 2002.
Lonstein JE. Carlso
idiopathic scoliosis during growth. Journal of Bone & Joint Surgery - American Volume. 66(7):1061-71, 1984.
Peterson LE. Nachemson AL. Prediction of
have adolescent idiopathic scoliosis of moderate severity. Logistic regression analysis based on data from The Brace Study of the Scoliosis Research Society. Journal of Bone & Joint Surgery - American Volume. 77(6):823-7, 1995.