行政院國家科學委員會專題研究計畫 成果報告
對環境視覺最佳化之全頻譜照明光及光源對生理/心理的探 討及研究
研究成果報告(精簡版)
計 畫 類 別 : 個別型
計 畫 編 號 : NSC 98-2221-E-011-024-
執 行 期 間 : 98 年 08 月 01 日至 99 年 07 月 31 日 執 行 單 位 : 國立臺灣科技大學電子工程系
計 畫 主 持 人 : 胡能忠
計畫參與人員: 碩士級-專任助理人員:張延瑞
碩士班研究生-兼任助理人員:黃尊意 碩士班研究生-兼任助理人員:梁如齊 碩士班研究生-兼任助理人員:李俊杰 博士班研究生-兼任助理人員:馮彥誠
報 告 附 件 : 出席國際會議研究心得報告及發表論文
處 理 方 式 : 本計畫涉及專利或其他智慧財產權,2 年後可公開查詢
中 華 民 國 99 年 09 月 30 日
行政院國家科學委員會專題研究計畫成果報告
中文名稱:對環境視覺最佳化之全頻譜照明光及光源對生理/心理 的探討及研究
英文名稱:A study of the physiological/psychological effects for
full spectral illuminants
計畫編號:NSC 98-2221-E-011-024 執行期限:98 年 8 月 1 日至 99 年 7 月 31 日
主持人:胡能忠 國立台灣科技大學電子系
計畫參與人員:馮彥誠、黃尊意、張延瑞、梁如齊、李俊杰、
張明珠、曾國源 國立台灣科技大學電子系 中文摘要
本研究分為兩個研究主題,第一個研究主題為利用生理訊號探討照明光於下午時 段之影響。探討不同光源的變化與人類警覺程度變化之間的關係,本研究利用腦波 (EEG)、皮膚導電係數、皮膚溫度等生理訊號來探討警覺程度的變化,藉由此實驗找出 符合個人需求的變換式光源。第二個研究主題為建構全頻譜 LED 照明及最佳視覺照明系 統,因此本研究主題包含了 LED 模組、驅動電路、控制電路與控制程式,實現高演色指 數與可調變性的照明光,並分析光源與環境之間的關係進行壁紙之喜好色實驗,並且探 討與分析影響喜好程度的關鍵。最後建議藉由皮膚電導、指溫、亮度與飽和度等因素,
做為判定最佳視覺照明光的依據,已建立符合生理/心理所需的照明系統。
關鍵詞:腦波(EEG)、皮膚導電係數、皮膚溫度、LED、全頻譜、最佳視覺照明、喜好 色
Abstract
This study has two researches. The first is using physiological signals to analyze the effect of artificial lighting in the afternoon. The significant correlation between the changing of light and human arousal level, therefore this study use Electroencephalography (EEG), skin conductance, and skin temperature to measure human arousal level from different light. By using this experiment to find out the appropriate illuminant level for each different individual, meanwhile, using the full spectral adjustable illuminant module of this study could be reached the effect of variable illuminant and become more people-friendly lighting. The second topic is creative full spectral LED illuminants and optimal visual illuminant system. Therefore it includes LED module, drive circuit, control circuit and control program, to achieve high color rendering index and adjustable illuminant. Moreover, In order to understand the relationship between light sources and environment, we carry out the preferred color experiments of wallpaper and try to discuss and analyze the key of influencing the preferred color degree.
Finally, we suggest skin conduction, finger temperature, brightness and saturation as possible factors to determine the basis of the best visual illuminant.
Keywords: Electroencephalography(EEG), skin conductance, skin temperature, LED, full
spectra, best visual illuminant, preferred color行政院國家科學委員會專題研究計畫成果報告
中文名稱:對環境視覺最佳化之全頻譜照明光及光源對生理/心理的探 討及研究
計畫編號:NSC 98-2221-E-011-024 執行期限:98 年 8 月 1 日至 99 年 7 月 31 日 執行期限:98 年 8 月 1 日至 99 年 7 月 31 日
主持人:胡能忠 國立台灣科技大學電子系
計畫參與人員:馮彥誠、黃尊意、張延瑞、梁如齊、李俊杰、張 明珠、曾國源
國立台灣科技大學電子系
結案報告內容
一、前言
自從燈泡的發明後,人類已經能夠在暗處或晚上進行許多的活動,使人們的生活更是與光源 密不可分。由於現代人生活型態改變,人們較少與室外的自然光接觸,大部分的時間,人類 皆處於室內,長時期的缺乏自然光的結果,會引起了睡眠障礙與心理問題[1,2],如憂鬱症等 等的症狀相繼出現[3];而有些人則因職務的關係,必須在深夜裡工作,而持續的光照,會改 變人類荷爾蒙的晝夜節律變化[4],進而影響日變週期(circadian system),故光源與人類生 理之影響更需要被受重視,所以照明光對人類生理與心理的影響是有效且直接,其廣泛的應 用於醫學與科學的範疇。現代人對照明的需求不再只是單純照明,應該是更人性更健康。為 了讓照明貼近人性與符合健康,依據人性的考量,不同的環境應該有不同照明光的選擇。適 當的照明與環境下所呈現的色彩,會使心理產生正向的情緒反應[5]或者是用來調節警覺程度 [6],因此光源及環境的搭配將對生理及心理產生相當的影響,所以本研究將進行環境視覺最 佳化之全頻譜照明光及光源對生理/心理的探討及研究。
二、研究目的
本研究的目的為探討不同光源的變化與人類警覺程度變化之間的關係[7],我們希望能夠 找出符合人類生理時鐘的光源,並且能夠解決下午時人們較容易瞌睡的狀況,甚至使用者不 但能夠自行切換光源狀態,漸變出不同的光源,成為人性化且對於人類有所幫助的光源模組 的產品。而在第二個研究目的為建立全頻譜 LED 照明實体與照明環境並探討影響最佳視覺照 明因素,已提出最符人性及健康的照明機制。
三、研究方法
本研究主題一之中在於探討光源對心理及生理的影響,因此將進行下午時段生理之光源實
驗以探討光線對警覺程度之影響。實驗一:下午時段生理之光源實驗設計
為了解可變換式的光源是否會影響人類警覺程度,且人們在下午產生嗜睡之狀況可否藉 由光源之改變而能有所變化[8]。
受測對象年齡平均 24.3 歲,共 5 男 4 女,且受測者作息必須正常,無不良嗜好,且無視 覺方面疾病,並且於受測期間不得食用含有咖啡因之食物。實驗光源為飛利浦 T5 14W 家用 型支架燈兩支,其中燈管有黃光、白光、晝光等三種光源,上述光源經由光源頻譜分析儀 JETI
量測得知分別為 3000K、4000K、6500K 之相對色溫。
實驗環境需於全暗的室內空間中,室內溫度固定在 24 度,並利用色溫箱作為光源的架設 區塊,受測者藉此接受光,將受測者之視網膜照度固定在 500±100Lux,在燈光全暗的情況下 讓受測者先休息 15 分鐘,用以排除其餘影響受測者清醒程度之因素,之後做 AAT(Alpha attenuation test) [9]並開始照射量測光源,接著每 15 分鐘的間隔做一次 AAT,兩次 AAT 後即 完成其一光源之實驗,依此類推,依序完成三個光源之實驗。實驗共分為兩天,第一天色溫 由低到高變化,如圖一所示,第二天色溫則由高到低變化,圖如二下所示。
圖一 Day1 實驗流程圖
圖二 Day2 實驗流程圖
判別警覺程度的依據是藉由 Scan NuAmps Version4.3 腦波量測分析軟體系統、皮膚溫度 與皮膚電阻量測儀(J+J Engineering),這兩種實驗設備來觀察受測者的警覺程度[10,11]。測量 腦電極為頂葉電極(Pz)、額葉電極(Fz)、枕葉電極(Oz、O1、O2)、中央區塊電極(Cz)、上眼動 電極(Veou)、下眼動電極(Veol)、心跳電極(EKG),其中以 Cz 作為參考電極,各電極之電阻 值皆小於 5K 歐姆,並觀測其 alpha 的變化量,同時亦利用 J+J Engineering 所生產的 I-330-C2+6 Channel 量測受測者
非主要用手之膚溫、膚電阻。
最後將數據採用 SPSS 統計分析軟體判別顯著性差異,由於研究樣本屬於相依的關係,
如同一個人受訓前與受訓後打字速度…等,而本研究為同一個受測者在同一時段照射不同色 溫的光源之警覺程度比較,因此使用成對樣本 T 檢定。本研究所討論事件為 A 色溫照射時警 覺程度是否大於 B 色溫,故採用單尾檢定來分析數值之顯著性,若 P 值< 0.05 時稱該統計分 析有顯著差異[12]。
而在研究主題二之中,我們進行全頻譜 LED 照明系統建構及喜好色實驗以探討有關照明
與環境之關係,並建構出最佳視覺照明系統。在全頻譜 LED 照明系統之中,我們建構全頻譜 LED 模組如圖三所示,脈波寬度調變控制電路以達到全頻譜調製如圖四所示及驅動 LED 定電 流電路如圖五所示。
圖三.(a)全頻譜 LED 單元 (b)全頻譜 LED 模組
圖四. 脈波寬度調變電路
圖五. LED 定電流之驅動電路
在建構出全頻譜 LED 照明光源後,我們將進行照明光與壁紙搭配的喜好色實驗,以探討
出影響人類之最佳視覺照明的因素。
實驗二:照明光與壁紙搭配的喜好色實驗
實驗架構的設計分為三個方向 1.光源 2.環境 3.受測者。光源方面有三種不同種類的燈管,
分別為 LT 1、LT 2 和 LT 3,用來照明這些預先設定好的環境。LT 1 是由色溫 2800K 的 T5 燈管所組成,呈現黃色光具有溫暖的視覺效果;LT 2 是由色溫 4500K 的 T5 燈管所組成,呈 現乳白色光具有清新的視覺效果;LT 3 是由色溫 6000K 的 T5 燈管所組成,呈現藍白色光具 有冰冷的視覺效果。
這些預先設定好的環境有 10 種不同冷暖色系的壁紙如圖六所示與 1 種校正用的壁紙所構 成,分別為 WP0、,WP1、WP2、…與 WP10,其中 WP0 為校正用的標準白壁紙,其他的 WP1~WP10 則為用來量測的各色壁紙樣本。
壁紙 1(紅色) 壁紙 2(綠色) 壁紙 3(白底黑) 壁紙 4(紅花) 壁紙 5(粉綠色)
壁紙 6(橘色) 壁紙 7(粉紅色) 壁紙 8(藍色) 壁紙 9(黃色) 壁紙 10(綠花)
圖六 10 種壁紙
在色溫箱內設置 1 種光源與 1 種環境,控制光源照度約為 500 lux 後,請 1~2 位受測者進 行喜好色實驗,以上即為一個實驗流程。受測者分別為 20~25 歲的 10 位男生與 10 位女生所 擔任,要求受測者配合在實驗前一周要有正常飲食與規律生活,使其保持在一個正常穩定的 狀態下進行實驗,達到減少實驗誤差與確保實驗品質的目標。
實驗量測方法的設計分為兩類 1.主觀認知的量測與 2.客觀認知的量測。主觀認知的量測 牽涉範圍較廣泛,不論受測者當時的情緒、觀測時間的長短、對物體的記憶色、生活的習慣、
家庭環境的差異或者是不同的年齡,都會反映在對主觀認知的判斷。將喜好程度由討厭到喜 歡分為 11 種程度,由低到高分別對應到分數-5、-4、-3、-2、-1、0、+1、+2、+3、+4、+5,
方便於實驗中進行評分。
在客觀認知的量測方面,除了記錄與監控受測者實驗時生理訊號並且量測環境參數,為 客觀認知的參考依據。生理訊號的量測是使用生理回饋儀對受測者進行量測,取得皮膚的電 導與手指溫度等參數。環境參數的量測是使用 JETI 的分光光譜儀對各種壁紙與光源進行量 測,取得近似人眼看到的亮度與色座標等參數。
在喜好色實驗中,選用 J&J ENGINEERING 生理回饋儀,型號 I-330-C2+ 6 channel,此 產品有 windows XP 作業系統的軟體介面與 USB 介面,提供更方便快速的使用空間。其 EEG 擁有 2 個 channels 供 EMG、ECG、EEG 使用與 4 個 channels 供溫度、皮膚電導、呼吸使用。
其軟體介面有顯示各種訊號、反饋信息、整合資料、列印報告的功能。其特色包含訊號連接 自動測試感測器的電極狀況,與將訊號轉換成高解析度的頻譜顯示,提供即時的訊息與操作 的便利性[13]。目前實驗僅使用指溫、皮膚電導等資料作為參考訊號。
科學量測的實驗數據多是繁雜且具獨立性,通常彼此之間沒有直接關連。故需要藉由統 計分析去進行交叉分析、整體分析與差異分析,將看似無關的資料間架起連接的橋梁。如表 一所示,在本實驗中,選用 SPSS(Statistical Analysis Software)統計分析軟體,應用其單因子 變異數分析(ANOVA)進行實驗數據的。單因子變異數分析為一維的變異數分析,是檢定在一 種因素影響的多組樣本下,某因變數的平均值是否有顯著的效果,稱之為顯著性。如果顯著 性高,表示各組間有顯著的差異,某因素對因變數是有顯著的影響。如表二所示,當變異數 相等時,可選用 TUKEY 法 Studentized Range 統計量進行所有組間平均值的配對比較,藉由 所有配對比較集合的誤差率做為實驗誤差率。由上述的實驗方法,我們可分評比出 10 種壁紙 需在那一種色溫照明下,呈現出較為喜好之感覺。
表一 樣本之變異數分析
表二 樣本之 Post Hoc 檢定
四、實驗結果與討論
實驗一:下午時段生理之光源實驗設計
z 皮膚導電率
將所有階段 AAT 閉眼時的皮膚導電率數據平均,觀察嗜睡的第一階段(AAT1),統計分
析圖表如表三所示,由表一顯示,單尾檢定已達統計上顯著之效果(p=0.006,p<0.05),趨勢 如圖七所示。
表三 皮膚導電率之成對樣本檢定表
t 自由度 顯著性(雙尾) 顯著性(單尾) 皮膚電阻
Day1-Day2 -3.22 8 0.012 0.006
A A T 1 ' A A T 2 ' A A T 3 '
0 1 2 3 4 5 6 7 8 9
L o w C C T t o H i g h C C T H i g h C C T t o L o w C C T
Skin Conductance
0 1 2 3 4 5 6 7 8 9
Skin Conductance
圖七 皮膚導電率趨勢圖
圖七顯示,整體的警覺程度呈現上升的狀態(SCR 的值與警覺程度呈正相關),但是色溫 由低到高變化與色溫由高到低變化的上升幅度有所差異,色溫由低到高變化時警覺程度上升 的幅度較大,色溫由高到低變化時警覺程度上升的幅度較小,導致這個原因的結果是因為人 類於下午時段之警覺程度會緩緩增加,且單獨比較第一階段嗜睡程度,高色溫與低色溫相比,
高色溫之光源對於提升警覺程度有較好的效果。
z 皮膚溫度
本研究於皮膚溫度參數下,統計分析圖表如表四所示,但統計上並無顯著差異(p=0.212,
p>0.05) ,趨勢圖如圖八所示。
表四 皮膚溫度之成對樣本檢定表
t 自由度 顯著性(雙尾) 顯著性(單尾) 皮膚電阻
Day1-Day2 -0.843 8 0.424 0.212
A A T 1 ' A A T 2 ' A A T 3 '
2 6 2 8 3 0 3 2 3 4 3 6
L o w C C T t o H i g h C C T H i g h C C T t o L o w C C T
Skin Temperature
2 6 2 8 3 0 3 2 3 4 3 6
Skin Temperature
圖八 皮膚溫度趨勢圖
圖八中,發現色溫由低到高變化與色溫由高到低變化中,體溫下降的幅度明顯有所差 異,色溫由低到高變化時的下降幅度偏大,表示警覺程度越趨清醒,而色溫由高到低變化時 的下降幅度偏小,表示警覺程度增加的較少。
z 腦波訊號
將所有受測者的兩天實驗分析出來的各段資料數據取平均,並計算其標準差,各個階段 與各電極的 AAC(Alpha attenuation coefficient)值列出比較,計算方式如方程式(1)式顯示 [14,15],(AAC 值與警覺程度呈正相關),照射相對色溫由低到高與照射相對色溫由高到低的 Oav(O1、O2、Oz 平均)之成對樣本檢定表如表五所示,其統計上具有顯著性差異(p=0.0075,
p<0.05),Oav(O1、O2、Oz 平均)趨勢如圖九所示。
) (
) (
open eyes
density power
average
closed eyes
density power
average
AAC −
= −
α α
(1)
表五 Oav(O1、O2、Oz 平均)之成對樣本檢定表
A A T 1 ' A A T 2 ' A A T 3 '
0 2 4 6 8 1 0 1 2 1 4 1 6
L o w C C T t o H i g h C C T H i g h C C T t o L o w C C T
AAC
0 2 4 6 8 1 0 1 2 1 4 1 6
AAC
圖九 Oav 之 AAC 趨勢圖
由圖九可知,當色溫由高到低變化時,整體的清醒程度較為平緩下降,而色溫由低到高 變化時,整體的清醒程度有大幅度的攀升,讓我們先從第一天第一個階段的低色溫開始討論 起,AAC 的值與第二天第一個階段的高色溫相比,有顯著上的差異,結果顯示與皮膚導電率 相同,照射低色溫時受測者較不清醒,反之照射高色溫時受測者較為清醒,故人類在下午感 覺嗜睡時,可藉由調製不同的色溫來達到提高警覺程度的效果。
實驗二:照明光與壁紙搭配的喜好色實驗
而在喜好色實驗之中其結果如表六所示,分別為 20 位受測者進行喜好色實驗分數的加 總,與各種壁紙所量測到的數據。從結果分析結論如下:
z 對喜好色分數進行變異數分析獲得顯著性參數,其顯著性範圍在小於 0.05 時為有效的問 卷。
z 外觀評選最好的壁紙,不論照什麼光源效果都好,雖然喜好色分數都偏高,但分數的差 距太小,造成顯著性也比較低。例如:白底黑的壁紙 3 因白底成分占大部分,故在任何
t 自由度 顯著性(雙尾) 顯著性(單尾) 皮膚電阻
Day1-Day2 -3.066 8 0.015 0.0075
光源下亮度都偏高,造成分數距小。
z 外觀評選中等以上的壁紙,喜好色分數具鑑別度,顯著性也比較高。其結果也較符合預 定的趨勢,例如:冷色系的壁紙適合搭配高色溫的光源,或者暖色系的壁紙適合搭配低 色溫的光源。
z 外觀評選最差的壁紙,不論照什麼光源效果都不好,造成喜好色分數都偏低,其顯著性 也比較低。例如:紅花壁紙 4 和綠花壁紙 10 為受測者評選外觀最差的兩款壁紙,讓受測 者有不舒服的感覺。
z 根據相關研究顯示,當警覺程度上升時,皮膚電導值會有上升而指溫會有下降趨勢[16]。
生理訊號對應高喜好色分數,有皮膚電導值上升與指溫下降的趨勢,處於 normal 與 relaxation 的範圍。假設高顯著性與高喜好色分數為最佳視覺照明的狀態,可能因喜好程 度高造成警覺程度增加,但其不至於引起緊張狀態。
z 根據研究顯示,色彩的色相、亮度與飽和度都可能造成心理層面情緒的關鍵[17,18],故 實驗中以亮度與飽和度做為評量最佳視覺照明的標準。
z 假設高顯著性與高喜好色分數為最佳視覺照明的狀態,其亮度與飽和度值相對最高。
z 目前實驗環境照度固定為 500 lux 為適當。若照度低於 300 lux 則因光線昏暗造成喜好色 分數偏低,相反地,若照度高於 750 lux 則因光線過亮造成喜好色分數偏高,兩者都會有 顯著性偏低的現象。
z 從結果中得知高顯著性與高喜好色分數的狀態,不但亮度與飽和度值相對較高,且皮膚 電導值有上升與指溫有下降的趨勢。故在忽略外觀與照度前提下,可以亮度與飽和度為 主,皮膚電導與指溫為輔做為判定最佳視覺照明光的依據。
表 3 壁紙之喜好色實驗總分
五、結論
由上述的實驗結果可了解,具有調變色光的光源對於人類警覺程度上之影響確實存在 光源 A
2800 K
光源 B 4500K
光源 C 6000K
喜好色顯著性
壁紙 1(紅色) 52 22 -13 0.000
壁紙 2(綠色) -5 33 41 0.022
壁紙 3(白底黑) 33 44 42 0.760
壁紙 4(紅花) 39 29 13 0.287
壁紙 5(粉綠色) 6 41 30 0.121
壁紙 6(橘色) 40 43 3 0.038
壁紙 7(粉紅色) 28 55 28 0.125
壁紙 8(藍色) -2 28 61 0.001
壁紙 9(黃色) 58 36 16 0.040
壁紙 10(綠花) 3 12 16 0.785
著,利用不同色溫的燈管於不同時段照射受測者,觀察受測者生理訊號之膚溫、膚電阻與腦 波各區域電極來探討警覺程度,可以發現較容易產生嗜睡的時段能夠利用較高色溫之光源來 提振精神即提高警覺程度,其中警覺程度趨勢會因為色溫增加而增加,色溫降低而降低,這 樣的結果可清楚的了解到在下午時段的警覺程度確實會因為色溫的不同而影響了生理的狀 況,故使用者可以利用這樣的一個特性,藉由光源來控制自己的精神狀況,當使用者精神狀 況較差時可選擇高色溫的光源,來達成提高警覺程度的目的。而在喜好色實驗之中,我們可 以發現主觀量測的喜好色分數,與客觀量測的亮度、飽和度、皮膚電導與指溫等數據,配合 變異數分析喜好色分數的顯著性,找出能預測人們所喜好光源的方式。顯著性高的樣本具有 高亮度高飽和度的特色,生理訊號方面有皮膚電導上升、指溫下降與警覺性提高等現象,做 為最佳視覺照明光之依據。由上述兩個實驗的結果我們可以藉由照明物之亮度、色飽和度以 及生理訊號以作判別智慧調光之依劇,以建立出符合最佳視覺照明、健康及人性的光源。
七、參考文獻
[1] Figueiro MG, Bierman A, Plitnick B and Rea MS, “Preliminary evidence that both blue and red light can induce alertness at night,” BMC Neurosci, Vol.10, pp.105(2009).
[2] 岩切、綿貫、安河內、栀原,1997,“光源色がその曝露中と暴露後に CNV の早期成分 に及ぼす影響” ,〈日本生理人類學会誌,2-3〉,pp. 139-145.
[3] 蔡佳辰,“放鬆介入對化療癌症患者其焦慮緩解之效果,”國立成功大學護理學系碩士論 文,民國九十七年。
[4] http://www.endotext.org/neuroendo/neuroendo15/
[5] Kaya N., Epps H., ”Relationship between Color and Emotion: A Study of College Students”, College Student Journal, Vol.38, pp.396-405(2004).
[6] Patricia Valdez, Albert Mehrabian, ” Effects of Color on Emotions”, journal of experimental psychology general, Vol.123, No.4, pp.394-409(1994).
[7] Mukae, H. and Sato, M., 1992, “The effect of color temperature of lighting sources on the autonomic nervous functions”, Ann. Physiol. Anthrop., VolII, No5, pp.533-538.
[8] Kaida K, Takahashi M, Haratani T, Ostuka Y, Fukasawa K, Nakata A (2006) Indoor exposure to natural bright light prevents afternoon sleepiness. Sleep 29, 462–9.
[9] Figueiro MG, Bullough JD, Bierman A, Fay CR, Rea MS, “On light as an alerting stimulus at night,” Acta Neurobiol Exp (Wars), Vol.67, No.2, pp.171-178(2007).
[10] Barry RJ, Sokolov EN, “Habituation of phasic and tonic components of the orienting reflex,”
Int J Psychophysiol, Vol.15, pp.30-42(1993).
[11] Barry RJ, Clarke AR, Johnstone SJ, Magee CA, Rushby JA, “EEG differences between eyes-closed and eyes-open resting conditions,” Clin Neurophysiol, Vol.118, pp.2765–2773(2007).
[12]楊世瑩著,SPSS 統計分析實務,第 9 章 27-30 頁,旗標出版股份有限公司,民國九十七 年。
[13] http://www.jjengineering.com/
[14] Luc. J.M. Schlangen, Leonie M. Geerdinck, “Health and Well-Being Effects of High Color Temperature Lighting,” 26th Session of the CIE, pp.D3-86-D3-89(2007).
[15]Figueiro MG, Bullough JD, Bierman A, Fay CR, Rea MS, “On light as an alerting stimulus at night,” Acta Neurobiol Exp (Wars), Vol.67, No.2, pp.171-178(2007).
[16].蔡佳辰,”放鬆介入對化療癌症患者其焦慮緩解之效果,” 國立成功大學醫學院護理學系 碩士學位論文,民國 97 年 6 月。
[17] Kaya N., Epps H., ”Relationship between Color and Emotion: A Study of College Students”, College Student Journal, Vol.38, pp.396-405(2004).
[18]Patricia Valdez, Albert Mehrabian, ” Effects of Color on Emotions”, journal of experimental psychology general, Vol.123, No.4, pp.394-409(1994).
出席國際學術會議心得報告
計畫編號 NSC 98-2221-E-011-024
計畫名稱 對環境視覺最佳化之全頻譜照明光及光源對生理/心理的探討及研究 出國人員姓名
服務機關及職稱 胡能忠 台灣科技大學電子系教授 會議時間地點 2009 9/27-10/2 雪梨
會議名稱 11th Congress of the International Colour Association (AIC) 2009
發表論文題目 Optimal selection of light-emitting diodes for synthesizing the CIE Illuminants A and D-series (壁報)
一、參加會議經過
參加 2009 國際色彩學會(AIC)會議報告 台灣科技大學電子系 胡能忠
在中華色彩學會李天任理事長之號召下,本次會議學校有文大、交大、台科大、雲科 大、亞洲大學等五校十餘位參予。九月二十八日開幕是由主辦單位澳洲南威爾斯大學邀請頗 負盛名之澳洲原住民團體,以澳洲原住民文化饗宴方式呈現澳洲原住民音樂舞蹈,以類似祈 福方式進場,其中並介紹澳洲原住民在沙漠有關漆畫之色彩,其舞蹈以手勢動作表示一些相 關之動物型態,如響尾蛇或老鷹等,跳舞中並邀請觀眾參與並模擬一些動物之形態,參與者 全為西方人。接著由主辦單位澳洲色彩學會主席 Nick Harkness 致歡迎詞並由前 AIC 主席現任 阿根廷色彩學會主席 Jose Caivano 做 AIC 成立簡介與十年間之變化。
隨後為 Invited Lecture 主講人昆士蘭大學 Justin Marshall 教授,講題為"Why are animals colorful sex and violence, seeing and signals",主要為 visual ecology, camouflage ,and display 並用 reef fish 當例子解釋。做為視覺系統至少需要兩種以上之視覺細胞才可做彩色視覺,例如 Mantis shrimp 有十二種。下午參與由英國 Glasgow Caledonian University 之 Logvinenko 教授所提之 A new colour rendering index,其與 the CIE 所提之 CRI 不同點在於:(1)不用光源之色彩空間而適 用反射物之色彩空間(2)色差距離不是用 Euclidian distance 而是用 spherical distance。另一廠與 我的研究領域較密切的是由紐西蘭之 Manukau Institute of Technology 之 Chalmers 教授所提有關 LED 混光方法例如用紅、綠、藍、琥珀色其平均演色指數為 86.1,若用寬帶之四、五、六、
七色 LED,其相關之平均演色指數分別為 91、94、94、92,而相關之色溫為 3519K、3467K、
3478K、3492K。為本研究仍侷限於固定頻譜與我們所探討之動態頻譜與不同,同時也未提篩 選 LED 之方法。
第二天參與有關 Colour Imaging and Observer Acceptance 方面之報告。首先,法國 University of Nantes 之 Abhijit Sarkar 教授對 the CIE 2006 model 與 196010o標準觀察者做不同年齡之比 較,發現長波長前者之預估不正確 。另一場由 Colour Imaging scientist 之 Dr. Imai 講題 為"Multi-dimensional visualization of color quality metrics for spectral estimation "其重點在於最佳 化之決定與所定義之價值含數有關,故衡量尺度(metrics)有四種分別為:(1)color difference equation, such as in CIELuv, (2) goodness-of-fit coefficient mean-squared-error, (3) Metamerism
index, (4)weighted metrics。不同之衡量尺度有不同之優缺點或者可以將上述四個衡量尺度已 不同之加權數作組合。本日下午有會員大會,討論有關台灣入會之問題,以前一直未獲通過 之原因為條文上規定"一個國家只能有一個代表",故以前被中國大陸反對,此次在獲得現 任主席與前任主席 Caivano 建議下修改章程,拿掉"一個國家只能有一個代表'之規定後台 灣終於加入 AIC。也很慶幸能在此時此刻見證此歷史之一頁。
二、與會心得
綜觀整個研討會所設之議題均相當有趣且實用,可惜台灣研究者大多沒有著墨於這些議 題。尤其是有關 LED 照明方面是台灣全力推展,但相關業者與學者卻很少參加 CIE 研討會 這個具全球性之照明會議。
OPTIMAL SELECTION OF LIGHT-EMITTING DIODES FOR SYNTHESIZING THE CIE ILLUMINANTS A AND D-SERIES
NENG-CHUNG HU1, HORNG-CHING HSIAO1
,CHIN-CHUAN WU
11
DEPARTMENT OF ELECTRONIC ENGINEERING AND INTELLIGENT BUILDING RESEARCH CENTER
NATIONAL TAIWAN UNIVERSITY OF SCIENCE AND TECHNOLOGY 43 KEELUNG ROAD, SEC 4, TAIPEI, TAIWAN. R.O.C.
ABSTRACT
Instead of using LEDs of same full width half maximum(FWHM) equally spaced in visible region 400-700 nm for synthesizing the spectral power distribution (SPDs) of the CIE illuminants A and D-series, optimal selection of mixed types of LEDs is presented for synthesizing these illuminants with better synthesis metrics such as goodness-of-fit coefficient (GFC) and color rendering index (CRI).
Keywords: CIE illuminants A and D, LED, Spectral power distribution.
CONTACT
E-MAIL: [email protected]
INTRODUCTION
Many photometry facilities are equipped with different types of standard lamps, such as CIE Illuminant A or D-series, for calibration or calculation of CRI. Control and maintenance of these sources is very inconvenient and expensive. Thus an LED-based spectrally tuneable source has been developed for synthesizing1, these SPDs of the illuminants or CRI2.
To imitate these illuminants, the equi-space method is to place LEDs with arbitrary peak wavelengths and FWHM 20 nm equally in 400-700nm1. This method is quite straightforward but doesn’t involve optimal selection of LEDs. This is also not practical since some LEDs are not available. Meanwhile the LEDs with different FWHMs can not be included, such as the phosphor-converted (p-c)LEDs, and how to select the optimal LEDs for imitating the CIE illuminants will be unknown. The way to use LEDs with different FWHMs and p-c LEDs collected from commercial companies will be much practical and flexible. In this case, the method of LEDs with equi-distance can not be applied and an optimal algorithm with less LEDs to achieve specified synthesis metrics tailored for implementation of the SPDs of the above illuminants is presented.
SPECTRAL SYNTHESIS ERROR AND OPTIMAL ALGORITHM
The SPD of an illuminant to be imitated, denoted byE
( ) λ
, is synthesized by M number of LEDs as ˆ ( )E λ
=( )
1 M
i i i
c d λ
∑= (1)
,where the synthesis coefficients of the SPD of an illuminant can be obtained by3
( T) 1
C
=AA
−AE
=A E
+ (2)The synthesis coefficients are required to be positive, where
1(1), 1(2) 1(61)
(1), (2) (61)
M M M
d d d
A
d d d
⎡ ⎤
⎢ ⎥
= ⎢ ⎥
⎢ ⎥
⎣ … ⎦
is the matrix
whose entries are sampled spectra of the LEDs with size M×61, and
E
is the sampled SPD vector of size 61 if every spectrum is sampled in every 5 nm from 400nm to 700nm.A
+, a matrix of size M×61, is a kind of pseudo inverse matrix ofA
. For each spectrum to be imitated by the set of LEDs, the difference between the synthesized SPD denoted by ˆEi and the original SPD denoted by
E
iis given in matrix form asEi−Eˆi = −(I A A ET +) i.Optimal selection of LED sets means to have both minimal norm of ˆi i
E −E and positive synthesis coefficients of ˆ
Eiowing to unrealizable negative coefficients. To have positive synthesis coefficients and minimal number of LEDs, the pruning process is adopted resulting in an optimal LED set3. To implement the CIE illuminants A and D-series, each individual optimal LED set for each SPD of the illuminant is obtained consequently by the optimal method mentioned above. Then the union set of these obtained optimal LED sets will be the optimal set for imitating all the SPDs of the illuminants..
LED SIMULATIONS
Computer simulations for the optimal selection of LEDs compared with the one with LEDs equally spaced in visible range are performed. The types of the LEDs involved are assumed to be Gaussian shape and with FWHMs 20nm, and the various types of LEDs collected from the website of some LED companies.
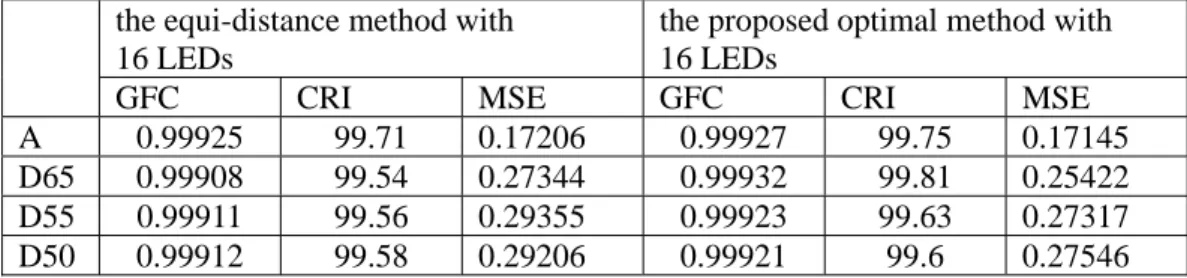
For equi-distance method the number of LEDs is given first, say L, then the distance between two adjacent LEDs is 300/(L-1). This distance can not be larger than the FWHM of the LEDs. For example L=16, the distance is 20nm equal to the FWHM of the LEDs. Using these LEDs to synthesize the CIE illuminants A and D-series, the GFC , CRI and MSE are shown in Table 1. By the proposed method, we placed an LED with FWHM 20nm every 5 nm in 400-700nm resulting 61 LEDs, then select the best 16 LEDs among the 61-LED pool according to the above optimal algorithm. The associated metrics to synthesize the SPDs of the illuminants are shown in Table 1 .From this table, the MSE is reduced 5% in average for the proposed method. The corresponding selected LEDs are shown in Table 2 which shows quite different LEDs being used. A better result will be obtained for the proposed method if the LEDs selected from 150-LED pool obtained by placing an LED in every 2 nm instead of 5 nm.
Table 1. Synthesis metrics of the equi-distance method and the proposed optimal method
the equi-distance method with 16 LEDs
the proposed optimal method with 16 LEDs
GFC CRI MSE GFC CRI MSE
A 0.99925 99.71 0.17206 0.99927 99.75 0.17145
D65 0.99908 99.54 0.27344 0.99932 99.81 0.25422 D55 0.99911 99.56 0.29355 0.99923 99.63 0.27317 D50 0.99912 99.58 0.29206 0.99921 99.6 0.27546
Table2 16 LEDs of the equi-distance method and 16LEDs of the proposed optimal method
16 LEDs of the equi-distance method (nm)
400 420 440 460 480 500 520 540 560 580 600 620 640 660 680 700 16 LEDs the proposed optimal method 16 LEDs (nm)
400 420 440 455 475 495 515 535 555 575 590 615 635 655 680 700 Commercial LEDs for simulation
The set of LEDs motioned above is Gaussian-like shapes and equal FWHM, called a fixed type LED set.
Thus the equally spaced method can be applied. Unlike this, the proposed method can be applied to the LED
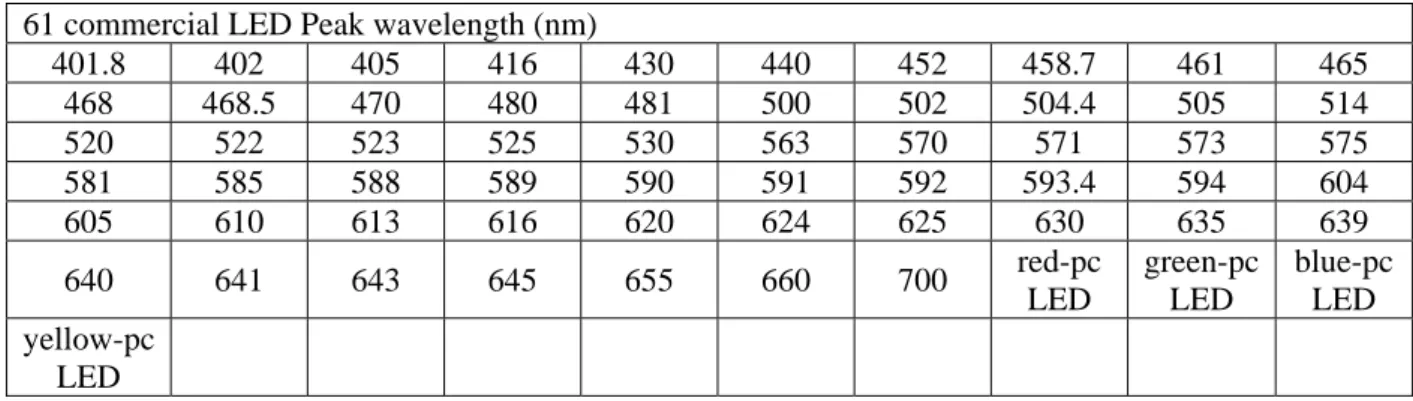
called a mixed type LED set. We use a set of commercial LEDs collected from the website of some LED companies together with the 61-LED pool as a mixed type LED set shown in Table 3.
By applying the proposed method to the 61 commercial mixed LEDs shown in Table 3, we obtain 12 LED set shown in Table 4 to have GFC>0.999. The corresponding GFC, CRI, and MSE are shown in Table 5.
By comparing Table 1 with Table 5, the mixed type LED set has better performance than the fixed type LED set in terms of LED number and mean-squares-error.
Table 3. 61 commercial mixed LEDs
61 commercial LED Peak wavelength (nm)
401.8 402 405 416 430 440 452 458.7 461 465 468 468.5 470 480 481 500 502 504.4 505 514 520 522 523 525 530 563 570 571 573 575 581 585 588 589 590 591 592 593.4 594 604 605 610 613 616 620 624 625 630 635 639
640 641 643 645 655 660 700 red-pc
LED
green-pc LED
blue-pc LED yellow-pc
LED
Table 4 12 commercial LEDs selected by the proposed method.
Peak
wavelength 401.8nm 430nm 465nm 480nm 500nm 581nm FWHM 30nm 30nm 30nm 30nm 30nm 30nm
Peak
wavelength 610nm 635nm 655nm 700nm blue-pc LED
yellow-pc LED FWHM 40nm 50nm 50nm 45nm NA NA
Table 5. Synthesis metrics of the mixed type LED set selected by the proposed methods.
The proposed 12 LEDs
GFC CRI MSE A 0.99964 99.891 0.12024 D65 0.99938 99.825 0.22562 D55 0.99939 99.817 0.24222 D50 0.99937 99.819 0.24644
CONCLUSION
Optimal selection of different types of LEDs for synthesizing the CIE illuminant A and D-series is proposed which is better than the equi-distance LED arrangement method in terms of synthesis metrics, MSE, LED number, and limitation of LED type. The selected LEDs can be integrated in one light source for light box which commonly contains the illuminants A and D-series different light sources.
REFERENCES
1. I. Fryc, S. W. Brown, G. P. Eppeldauer, and Yoshi Ohno, “LED-based spectrally tunable source for radiometric, photometric, and colorimetric Applications.” Optical Engineering 44(11), 111309,(November 2005)
2. A. Zukauska et al, ”Optimal of white polychromatic semiconductor lamps.” Appl. Phys. Lett. 80, 234(2002)
3. N. C. Hu, C. C Wu, S. F. Chen, and H. C. Hsiao, “Implementing dynamic daylight spectra with light-emitting diodes.” Applied Optics Vol. 47, Issue 19, pp. 3423-3432 (2008)
無研發成果推廣資料
98 年度專題研究計畫研究成果彙整表
計畫主持人:胡能忠 計畫編號:98-2221-E-011-024-
計畫名稱:對環境視覺最佳化之全頻譜照明光及光源對生理/心理的探討及研究
量化成果項目 實際已達成
數(被接受 或已發表)
預期總達成 數(含實際已
達成數)
本計畫實 際貢獻百
分比
單位
備 註 ( 質 化 說 明:如 數 個 計 畫 共 同 成 果、成 果 列 為 該 期 刊 之 封 面 故 事 ...
等)
期刊論文 0 0 100%
研究報告/技術報告 0 0 100%
研討會論文 1 1 100%
論文著作 篇
專書 0 0 100%
申請中件數 0 0 100%
專利 已獲得件數 0 0 100% 件
件數 0 0 100% 件
技術移轉
權利金 0 0 100% 千元
碩士生 6 4 120%
博士生 1 1 100%
博士後研究員 0 0 100%
國內
參與計畫人力
(本國籍)
專任助理 0 0 100%
人次
期刊論文 0 0 100%
研究報告/技術報告 0 0 100%
研討會論文 0 0 100%
論文著作 篇
專書 0 0 100% 章/本
申請中件數 0 0 100%
專利 已獲得件數 0 0 100% 件
件數 0 0 100% 件
技術移轉
權利金 0 0 100% 千元
碩士生 0 0 100%
博士生 0 0 100%
博士後研究員 0 0 100%
國外
參與計畫人力
(外國籍)
專任助理 0 0 100%
人次
其他成果 (無法以量化表達之成 果如辦理學術活動、獲 得獎項、重要國際合 作、研究成果國際影響 力及其他協助產業技 術發展之具體效益事 項等,請以文字敘述填 列。)
貢獻一份力量促成台灣照明學會並被推為 Division 6 技術小組之召集人,於產 業與學界間推動有關照明光與生物之影響的交流。
成果項目 量化 名稱或內容性質簡述
測驗工具(含質性與量性) 0
課程/模組 0
電腦及網路系統或工具 0
教材 0
舉辦之活動/競賽 0
研討會/工作坊 0
電子報、網站 0
科 教 處 計 畫 加 填 項
目 計畫成果推廣之參與(閱聽)人數 0
國科會補助專題研究計畫成果報告自評表
請就研究內容與原計畫相符程度、達成預期目標情況、研究成果之學術或應用價 值(簡要敘述成果所代表之意義、價值、影響或進一步發展之可能性)、是否適 合在學術期刊發表或申請專利、主要發現或其他有關價值等,作一綜合評估。
1. 請就研究內容與原計畫相符程度、達成預期目標情況作一綜合評估
■達成目標
□未達成目標(請說明,以 100 字為限)
□實驗失敗
□因故實驗中斷
□其他原因 說明:
2. 研究成果在學術期刊發表或申請專利等情形:
論文:□已發表 □未發表之文稿 ■撰寫中 □無 專利:□已獲得 □申請中 ■無
技轉:□已技轉 □洽談中 ■無 其他:(以 100 字為限)
稍和原計畫不同處是利用一個時段有三種可變色溫照明光對午後暈睡之影響,與固定色溫 照明光不同。另一部份做視覺最佳化探討,兩者有初步具體之成果,目前正撰寫論文。前者 因是一種不同概念之照明光,應可申請專利。
3. 請依學術成就、技術創新、社會影響等方面,評估研究成果之學術或應用價 值(簡要敘述成果所代表之意義、價值、影響或進一步發展之可能性)(以 500 字為限)
學術成就與技術創新:日本學者有利用陽光証實對午後昏睡有改善,然只對窗戶邊者才有 效。故本計畫利用本團隊所研發之智慧可變頻譜高演色性 LED 燈之三種色溫高中低溫照明 光,著重在高色溫照明光對午後昏睡之改善。如此可行性比利用陽光高。創新點是一般探 討照明光對人之影響,一個時段只用一個色溫做探討有所不同,基於人之適應性我們認為 定色溫照明對人影響不會久,故應用不同色溫之照明光。
應用價值:一般辦公室或學校若能改用類似照明光,使上班族或學生有較高之警覺度,應 可提高工作效率或學習率。另一題目為視覺最佳化,利用所得之指標,可做為智慧照明光 挑選最符合人視覺之依據。
進一步發展:一般討論之高色溫為 6、7000K,是否色溫越高警覺度也越高?影響程度為何?