2018年12月7日 台灣.台南
1
Effects of Wake Meander on Fatigue Lives of Offshore Wind Turbine Jacket Support Structures
Bryan Nelson
*, Yann Quéméner, Tsung-Yueh Lin R/D Section, Research Department, CR Classification Society
[email protected]
Abstract
This study evaluated, by time-domain simulations, the fatigue lives of several jacket support structures for 4 MW wind turbines distributed throughout an offshore wind farm off Taiwan’s west coast. An in-house RANS-based wind farm analysis tool, WiFa3D, has been developed to determine the effects of the wind turbine wake behaviour on the flow fields through wind farm clusters. To reduce computational cost, WiFa3D employs an actuator disk model to simulate the body forces imposed on the flow field by the target wind turbines.
WiFa3D simulations were performed for a range of environmental conditions, which were then combined with preliminary site survey metocean data to produce a long-term statistical environment. The short-term wind loads on the wind turbine rotors were calculated by an unsteady blade element momentum (BEM) model of the target 4 MW wind turbines. The fatigue assessment of the jacket support structure was then conducted by applying the Rainflow Counting scheme on the hot spot stresses variations, as read- out from Finite Element results, and by employing appropriate SN curves. The fatigue lives of several wind turbine support structures taken at various locations in the wind farm showed significant variations with the preliminary design condition that assumed a single wind turbine without wake disturbance from other units.
Keywords: Offshore wind turbine, wake effects, jacket foundation, actuator disk, fatigue analysis.
I. Introduction
One of the more obvious challenges faced by Taiwan’s wind farms are the extreme loads exerted on the wind turbine and support structures during typhoons [1, 2], which strike the island, on average, four times every year [3]. However, the authors previously showed that fatigue damage due to Taiwan’s prevailing North Easterly trade winds can be just as significant a design problem [4]. This previous study considered the long term environmental loads exerted on the jacket support structure of a single wind turbine during its 20- year design life, and highlighted the sensitivity of the fatigue life to the degree of fluctuation (standard deviation) of the wind loads, as well as the importance of appropriately orienting the jacket foundations according to prevailing wind conditions. This previous study did not, however, consider the exacerbated fatigue loading caused by unsteady wind farm wake effects, such as wake shadowing and wake meandering [5]. These turbine-turbine interactions would certainly be prevalent in the MOEA’s “Thousand Wind Turbines” project, which is the motivation behind the design and implementation of the present study.
II. Problem definition
Phase I of the Formosa I Offshore Wind Farm (Figure 1), located about 3 km off Taiwan’s west coast, consists of two Siemens SWT-4.0-120 turbines, which were installed in October, 2016. Phase II, scheduled for 2019, will add another 120 MW, originally planned to be in the form of an additional thirty SWT-4.0-120 turbines. Our study therefore adopted a scaled down version of the 5 MW reference wind turbine proposed by Jonkman et al. [6]. This turbine model was selected due to the availability of the turbine’s geometrical and operating specifications, making it a very popular model for benchmark studies, with a wide range of experimental and numerical data available for validation purposes. Our target turbine has a rotor diameter of 120 m, and a rated rotor speed of ω = 12.1 rpm at rated wind speed U = 11.4 m/s.
Figure 1. Formosa I Offshore Wind Farm, showing the proposed locations of all 32 Siemens SWT-4.0-120 wind turbines In order to investigate the effects of the exacerbated fatigue loading due to unsteady wind farm wake effects, such as wake shadowing and wake meandering, we focused on wind turbines in three general flow regions of the wind farm, namely along the upstream edge (no wake effects, only ambient wind turbulence considered), at mid-farm (both ambient and single wake turbulence considered, taking into account wind direction and lateral deflection of single wake), and along the downstream edge (highly turbulent coalescence of multiple wakes). The locations of these three flow regions were determined from flow field computations of the entire farm, described in Section V.
III. Short-ter m ti me domain wind states The concept of wind turbulence is explained in DNV [7]
as “the natural variability of the wind speed about the mean wind speed U10 in a 10-minute period” for which the short- term probability distribution for the instantaneous wind speed U can be assumed to be a normal distribution” with standard deviation . The short-term ambient wind states in the present study were modeled on the IEC 61400-1 Normal Turbulence Model (NTM) [8], for which the standard deviation of the wind speed for a given U10 is calculated by:
2018年12月7日 台灣.台南
(1)
where Iref is the reference turbulence intensity, taken as 0.16, in accordance with the requirements of the MOEA [9] that the wind turbines installed in the Formosa I Offshore Wind Farm must be IEC 61400-1 Class IA compliant
To generate more realistic short-term wind states, we employed our previous [4] approach of calibrating the wind speed fluctuations against real on-site data by applying a regression analysis to the wind speed spectra (Figure 2), and then reconstructing the signals (Figure 3, top). The wind speed fluctuations were then randomised (Figure 3, bottom) by randomising the phases of the component harmonics.
Finally, the signals were scaled so as to produce a signal which conforms to the IEC’s NTM.
Figure 2. Regression curve fit for PSD of real wind data
Figure 3. Reconstructed PSDs of real wind data, with corresponding (top) and randomised (bottom) phases
The increased turbulence in the downstream wakes was modelled by means of an analytical model proposed by Larsen [10, 11], which has been shown to reasonably predict the added turbulence in the far wake [12]:
(2)
where S is the distance from the wake-generating upstream wind turbine non-dimensionalised by the rotor diameter D, and is the upstream wind turbine’s thrust coefficient. The total turbulence intensity at a downstream turbine is then given by:
where is the ambient turbulence and is the wake- added turbulence intensity from the ith upstream wind turbine.
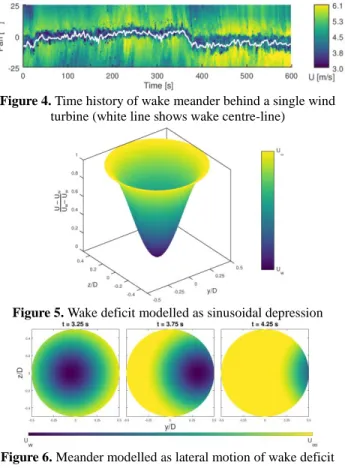
For the mid-farm case, we also considered the effects of wake meander, which is a lateral motion of the wake. To this end, we implemented a Dynamic Wake Meander (DWM) model [13]. In the absence of local data, the meandering of the wake was derived from wake spectral characteristics obtained from lidar plots in Reference [13] (Figure 4).
The lateral motions of the wake model were generated using the same method employed to generate the short-term wind states, i.e. by applying a regression analysis to the spectra of the wake centre-line (white line in Figure 4) and then reconstructing the signals with randomised phases, so as to produce a fully stochastic wake centre-line time series.
The wake diameter, velocity deficit, and meander characteristics were then scaled according to the ambient wind speed and the distance from the upstream wind turbine, with scaling factors determined from Wifa3D simulation results, together with data obtained from reference [13]. The wake velocity deficit at the target mid-farm wind turbine was modelled as a sinusoidal depression (Figure 5), which was translated horizontally (Figure 6) according to the stochastic- ally generated wake centre-line time series.
Figure 4. Time history of wake meander behind a single wind turbine (white line shows wake centre-line)
Figure 5. Wake deficit modelled as sinusoidal depression
Figure 6. Meander modelled as lateral motion of wake deficit Finally, we generated three months of short-term wind conditions by Monte Carlo simulation, with the wind speeds and directions based on local wind statistics (Figure 7).
Figure 7. Wind rose off the Chiayi coast [14]
(3)
2018年12月7日 台灣.台南
3 IV. Short-ter m time do main wind loads
For the large number of time-domain wind load calculations to be carried out over the simulated life times of the wind turbine support structures, we employed an unsteady blade element momentum method (UBEM). Due to its maturity, the BEM is a very popular tool for the design and analysis of wind turbines [15]. The “blade element” concept discretises the rotor into a number of 2D airfoil sections, such that the total rotor thrust and torque may be determined by integrating the airfoil elements’ lift and drag characteristics along the length of the rotor blades and multiplying by the number of blades :
(4) where is the blade section chord length, is the relative inflow velocity, and is the angle of relative inflow.
Our UBEM model includes a wind shear profile, as well as a simple, potential flow-based rotor-tower model, both of which are described in more detail in [4], and have been validated against full, unsteady, RANS-solver simulation.
Finally, as environment-monitoring technology grows ever more sophisticated, wind turbine control systems are able to exploit feed-forward (predictive) control strategies for power regulation. To investigate how such predictive control strategies affect the aerodynamic loading imposed on the mid-farm wind turbines by the meandering wake, we allowed the wind turbine rotor speed of our mid-farm model to be dictated by two different reference velocities, namely: the wind speed at the nacelle (feed-back control) and the rotor- averaged wind speed (feed-forward control).
V. Wind far m flow field computation CR recently collaborated with National Taiwan University to develop an in-house, RANS-based wind farm simulation tool, called WiFa3D, which uses a Semi-Implicit Method for Pressure Linked Equations (SIMPLE) algorithm to solve the unsteady, incompressible Reynolds-averaged Navier-Stokes (RANS) equations:
(5)
with the Reynolds stress, represented by the final term in (5), resolved by the two-equation - turbulence model:
(6)
where is the turbulence kinetic energy, and is the rate of dissipation of turbulence energy.
The effects of the wind turbines on the flow field through the wind farm are modelled by means of actuator disks, which makes it possible to investigate the flow field throughout a wind farm without the associated computational expense of resolving the Navier-Stokes equations around the individual wind turbine rotors. The so-called actuator disk is defined by the swept region of the rotor in space, and a body force
distribution representing the aerodynamic characteristics of the rotor is assigned within this virtual disk. The reaction forces of the rotor on the fluid (equal and opposite to the aerodynamic loads on the rotor) may then be imposed on mesoscale RANS [16] or LES [17–19] models of the entire computational domain of a wind farm. The WiFa3D code has been validated against experimental and computational data from Horns Rev [20].
VI. Fatigue assessment
A structural finite element model (FEM) of the unit was built using beam elements. It included the tower, the mass of the rotor-nacelle assembly, the jacket, and the four piles, for which the interaction with the soil was reproduced using nonlinear elastic spring connectors. Figure 8 shows the FEM of the offshore wind turbine’s jacket support structure. The computation time required to conduct the static FEA was around 0.5 s per time step, which would require several weeks of computations for the millions of wind induced load cycles to simulate during a 20-year design life. To facilitate more rapid fatigue life assessments, a faster approach was adopted which derived from FEA results the Closed-Form (CF) expressions of the nominal stresses at the jacket structure’s tubular joint connections as a function of two global load parameters (Figure 8, left), namely: the amplitude and direction of the wind-induced overturning moment at the mudline (OTMWind and βWind). The details of the calibration and validation of the CF expressions were presented in [4].
Figure 8. Offshore wind turbine support structure Finite Element Model and CF expressions for load parameters at the mudline The present study focused on the highly stressed K-joint 'K3b' (Figure 8, middle) connected to the most exposed legs in view of the predominant NNE/NE wind directions (Figure 8, right). The hot spot stresses were then calculated at eight spots around the circumference of the intersection of the brace and chord, according to DNV GL [21] formulations.
The CF expressions were then employed to convert the wind load fluctuations of each statistically determined 10- minute short-term condition into hot spot stresses. The stress range distribution was obtained by the Rainflow stress cycle counting method, and the fatigue damage was calculated from the ‘T’ class S-N curve provided by DNV GL [21].
VII. Results
Based on local wind speed and wind direction statistics (Figure 7), flow field computations were performed over a range of wind speeds from 6 m/s to 18 m/s for the three pre- vailing wind directions, namely N, NNE, and NE (Figure 9), which together account for 87% of all wind conditions. (Note
2018年12月7日 台灣.台南 that the other 13% of wind speeds fall below the target wind
turbine cut-in wind speed.)
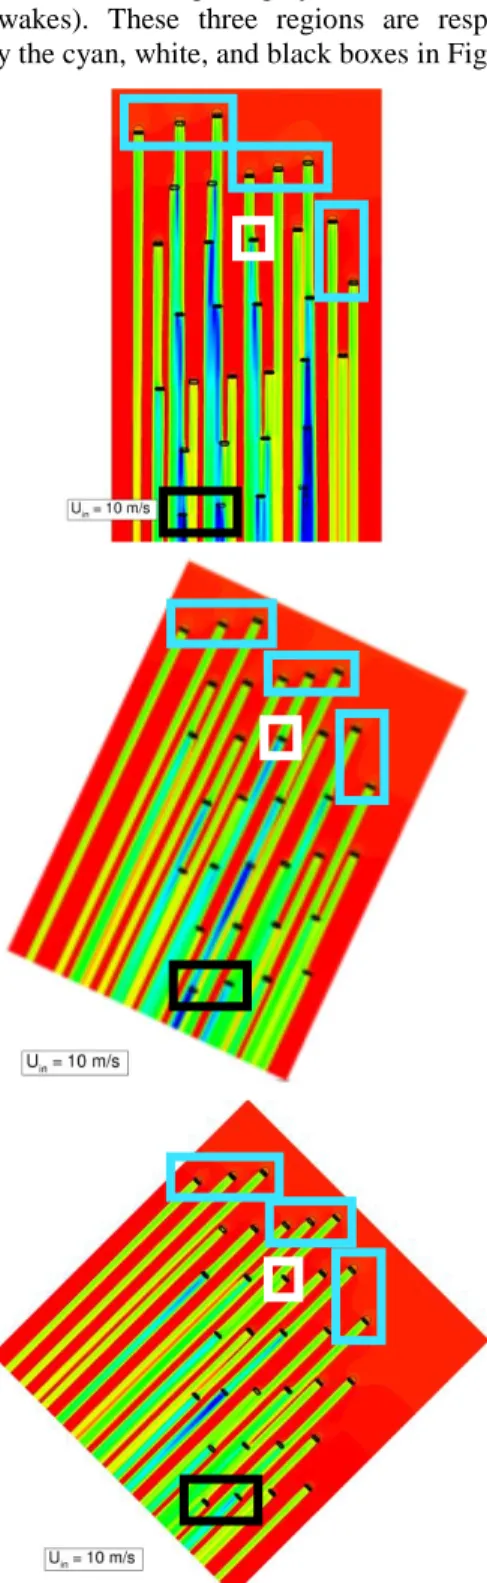
From these simulations, we selected three wind turbines which satisfied the three general flow regions described in Section II, namely along the upstream edge (no wake effects, only ambient wind turbulence considered), at mid-farm (both ambient and single wake turbulence considered, taking into account wind direction and lateral deflection of single wake), and along the downstream edge (highly turbulent coalescence of multiple wakes). These three regions are respectively demarcated by the cyan, white, and black boxes in Figure 9.
Figure 9. Flow field through target OWF computed by WiFa3D at three predominant wind directions, shown for for U = 10 m/s. The cyan, white, and black boxes demarcate the three regions of interest.
The WiFa3D results further served to provide the inlet flow speeds for each of the wake-affected downstream wind turbines for each of the simulated flow conditions. These results were then used to infer the relationship between free stream (ambient) and downstream flow parameters.
However, RANS-based actuator disk models have been shown to significantly underpredict the turbulent kinetic energy in the downstream wakes [22]. For this reason, we elected to adopt an empirical model on which to base our downstream wake turbulence calculations. Larsen’s model (Equation 2) is very straightforward, requiring as input just the non-dimensionalised distances between turbines and the thrust coefficients of the wake-generating upstream turbines, which were interpolated from the target turbine thrust curve for the upstream turbine’s inlet wind speed, as obtained from the WiFa3D simulations.
Figure 10 shows the fatigue damage inflicted at the considered K-joint's crown toe by each of the 13290 simulated 10-minute short-term conditions which make up the three-month simulated life time. It is clear that there is a small jump in the fatigue damage of the upstream turbine (red markers) at ambient wind speeds higher than 11 m/s (recall that the rated wind speed for this turbine is 11.4 m/s). The fatigue damage incurred at the mid-farm wind turbine shows a very similar trend to that of the upstream turbine, except that the mid-farm turbine case which adopts the rotor- averaged wind speed as its reference value appears to have a slightly higher incurred damage. On the other hand, the downstream turbine (blue markers) incurs a far more pronounced increase in damage, but only at ambient wind speeds above 14 m/s.
Figure 11 shows the accumulated (in 1 m/s bins) fatigue damage distribution, which more clearly shows the increased fatigue damage incurred by the mid-farm turbine case which adopts the rotor-averaged wind speed as its reference value, while reiterating the similar trends between the upstream and mid-farm case which adopts the wind speed at the nacelle as its reference value. Furthermore, it can once again be observed that the distribution of accumulated fatigue of the downstream turbine is the lowest for wind speeds lower than 14 m/s. This is due to the wake velocity deficit at the downstream turbine. Then, for wind speeds around 15 m/s, the accumulated fatigue damage of the downstream wind turbine is around 30% higher than that of the upstream turbine. This is primarily due to the larger wind fluctuations produced by the wakes of the upwind turbines.
What is surprising, however, is the incurred fatigue damage for the mid-farm case which adopts the rotor- averaged wind speed as its reference value, especially when contrasted against the case which adopts the wind speed at the nacelle. The binned damage results in Figure 11 show that, for all considered wind speeds, the “rotor-averaged wind speed” case incurs more damage than the “nacelle wind speed” case, especially around the wind turbine’s nominal wind speed. It is also surprising how closely the “nacelle wind speed” case’s results resemble those of the upstream wind turbine, with slightly less damage incurred at low wind speeds, and slightly more damage at higher wind speeds.
2018年12月7日 台灣.台南
5 Figure 10. Fatigue damage evaluation for three-month simulated life time (13290 × 10-minute conditions)
Figure 11. Accumulated fatigue damage distribution for three-month simulated life time.
The reason for the increased fatigue damage at the mid- farm and downstream wind turbines is due to the sensitivity of the fatigue life to the degree of fluctuation (standard deviation) of the wind loads [4]. In this paper, we have discussed the wake added turbulence imparted to the flow by the upstream turbines, such that the standard deviation of the flow speed within the wake is higher than that of the ambient flow. At mid-farm, wind turbines experience even higher fluctuations in flow velocity as the inflow condition alternates between ambient wind and turbulent wake, i.e. due to the lateral motion of the meandering wake.
Figure 12 illustrates the degree of fluctuation of the wind loads by plotting the standard deviation of the overturning moments for each of the simulated 10-minute short-term conditions against the corresponding ambient wind speeds.
The relationships between the load fluctuations of the four cases correspond well with those of the incurred damage results in Figure 10, namely: very similar trends between the upstream and mid-farm cases, where the results for the “rotor- averaged wind speed” case are higher, and the results for the
“nacelle wind speed” case are slightly lower at lower wind speeds and marginally higher at higher wind speeds; a sudden increase in load fluctuation at nominal wind speed for the upstream and mid-farm cases; and a sudden increase in load fluctuation at around 14 m/s for the upstream case, with significantly higher load fluctuations at higher wind speeds.
To explain the pronounced increase in fatigue damage at ambient wind speeds of around 12 m/s at the upstream and mid-farm wind turbines, and around 14 m/s at the downstream wind turbines, we present Figure 13, which plots the mean overturning moments against ambient wind speeds.
Figure 12. Standard deviation of overturning moments for three- month simulated life time (13290 × 10-minute conditions)
Figure 13. Mean of overturning moments for three-month simulated life time (13290 × 10-minute conditions)
Just as in a typical wind turbine thrust curve, the overturning moment values for the upstream wind turbines peak at the target turbine’s nominal wind speed of 11.4 m/s, at which point the pitch control system is activated. The moments for the downstream turbine clearly show how the reduction in wind speed due to the wake effects (wake velocity deficit) results in a delay of the blade pitch control of about 3 m/s. That is to say that wind turbines along the downstream edge of the wind farm only receive their rated wind speed of 11.4 m/s (the wind speed above which the blade pitch control is activated) at an ambient wind speed of around 14 m/s. As for the sudden increase in fatigue damage at the onset of blade pitch control, this is quite counterintuitive since the purpose of pitching the blade is to reduce the aerodynamic loading on the rotor by reducing the effective angle of attack. However, a secondary consequence of this action is that the blade is now operating in a steeper (more sensitive) region of its lift curve, whereas the load fluctuations on the unpitched blade are, in fact, somewhat relieved by the onset of flow stall. This increased sensitivity to changes in angle of attack combined with exacerbated load fluctuations due to unsteady wind farm wake effects results in a sharp increase in fatigue damage for pitched rotor blades.
This “sensitive region” may also explain the increased fatigue damage incurred by the mid-farm wind turbine which adopts the rotor-averaged wind speed as its reference value.
Typically, the rotor averaged wind speed will be considerably higher than that at the nacelle, such that this feed-forward controlled wind turbine will have a higher rotor speed, which consequently reduces its effective angle of attack to within a steeper (more sensitive) region of its lift curve, thereby
2018年12月7日 台灣.台南 resulting in higher load fluctuations for identical fluctuations
in inlet wind speed. On the other hand, basing the wind turbine rotor speed on the wind speed at a single point (such as at the nacelle) introduces significant variability to the unit’s inlet conditions, resulting in more erratic, not to mention lower, generated output power.
Finally, the total fatigue damages for the three-month simulated life times are summarised in Table 2, which clearly shows the exacerbated fatigue damage at the downstream and mid-farm (especially the rotor averaged wind speed case) wind turbines. However, we see that reducing the rotor speed of the mid-farm turbines can reduce the incurred damage by around 13%, although this comes at the cost of lower and more erratic generated output power.
Table 2. Total fatigue damage results
Location Damage Exacerbation
Upstream 0.00454 ~
Downstream 0.00495 +9%
Mid-farm (rotor-averaged) 0.00524 +15%
Mid-farm (nacelle) 0.00457 +1%
Conclusions
This study evaluated, by time-domain simulations, the fatigue lives of three jacket support structures for 4 MW wind turbines distributed throughout an offshore wind farm off Taiwan’s west coast. Flow field computations were performed for a range of environmental conditions via an in-house RANS-based wind farm analysis tool, WiFa3D, which employs actuator disks to simulate the body forces imposed on the flow field by the target wind turbines. These results were combined with an empirical model to determine the downstream flow parameters.
A long-term statistical environment, based on local offshore wind data, was generated by Monte Carlo simulation, and the short-term environmental loads on the wind turbine rotors were calculated by an unsteady blade element momentum (BEM) model of the target 4 MW wind turbines. Finally, fatigue assessment of the jacket support structures was conducted by applying the Rainflow Counting scheme to the hot spot stresses variations, as read-out from Finite Element results, and by employing appropriate S-N curves.
The exacerbated fatigue loading due to unsteady wind farm wake effects was found to impact the fatigue lives of the downstream turbines, with a 9% increase in fatigue damage over the three-month simulated lifetimes of the far downstream units, and a 15% increase in the fatigue damage of the mid-farm units. Furthermore, these downstream turbines were found to be especially sensitive to load fluctuations around their local rated conditions, where pitch control is activated to, ironically, reduce aerodynamic loading.
Acknowledgement
This research was partially supported by the BSMI Project 1D171061207-153.
References
[1] T.Y. Lin, Y. Quéméner, “Extreme Typhoon Loads Effect on the Structural Response of Offshore Meteorological Mast and Wind Turbine”, 35th International Conference on Ocean, Offshore and Arctic Engineering, OMAE2016, 19-24 June, 2016, Korea.
[2] B. Nelson, T.Y. Lin, Y. Quéméner, H.H. Huang, C.Y. Chien,
“Extreme Typhoon Loads Effect on the Structural Response of an Offshore Wind Turbine”, Proceedings of 7th PAAMES and AMEC2016, 13-14 Oct., 2016, Hong Kong.
[3] FAQ for typhoons. Central Weather Bureau. www.cwb.gov.tw [4] B. Nelson, Y. Quéméner, T.Y. Lin, H.H.Huang, C.Y. Chien,
“Calibration of Long-Term Time-Domain Load Generation for Fatigue Life Assessment of Offshore Wind Turbine”, 36th International Conference on Ocean, Offshore and Arctic Engineering, OMAE2017, 25-30 June, 2017, Norway [5] The Wake Effect: Impacting turbine siting agreements. North
American Clean Energy.
http://www.nacleanenergy.com/articles/15348/the-wake-effect- impacting-turbine-siting-agreements (21 September 2017) [6] J. Jonkman, S. Butterfield, W. Musial, and G. Scott., Definition
of a 5-MW Reference Wind Turbine for Offshore System Development. Technical Report. NREL/TP-500-38060. 2009.
[7] DNVGL-OS-J101: Design of Offshore Wind Turbine Structures [8] IEC, Wind turbines − Part 1: Design requirements, IEC
International Standard 61400-1, 2005.
[9] Ministry of Economic Affair of Taiwan (R.O.C.), "風力發電離 岸系統示範獎勵辦法", Taiwan, 2012.
[10] G.C.Larsen, J. Højstrup, H.A. Madsen, Wind Fields in Wakes, EUWEC ’96, Gothenburg, 1996.
[11] European Wind Turbine Standards II, ECN-C-99-073, 1999 [12] D. J. Renkema, “Validation of wind turbine wake models. Using
wind farm data and wind tunnel measurements.” MSc Thesis, TU Delft, Netherlands, 2007
[13] Larsen, G. C., Madsen, H. A., Bing¨ol, F., Mann, J., Ott, S., Sørensen, J. N., Okulov, V., Troldborg, N., Nielsen, M., Thomsen, K., Larsen, T. J., and Mikkelsen, R., “Dynamic Wake Meandering Modeling,” Tech. Rep. R-1607(EN), Risø National Laboratory, Technical University of Denmark, Roskilde, 2007.
[14] 工業技術研究院綠能與環境研究所
http://www.twtpo.org.tw/professional/wind.aspx?kind=Sea [15] M. Hansen, Aerodynamics of Wind Turbines, 2nd Ed.,
Earthscan, London, UK, 2007.
[16] Sørensen, J.N.; Shen, W.Z., Numerical modeling of Wind Turbine Wakes. J Fluids Eng 2002, 124, 393–399
[17] Troldborg, N. Actuator Line Modeling of Wind Turbine Wakes.
Ph.D. Thesis, Technical University of Denmark, Lyngby, 2008.
[18] Troldborg, N.; Sørensen, J.N.; Mikkelsen, R. Numerical Simulations of Wake Characteristics of a Wind Turbine in Uniform Flow Wind Energy 2010, 13, 86–99.
[19] Lu, H., Porté-Agel, F., “Large-Eddy Simulation of a Very Large Wind Farm in a Stable Atmospheric Boundary Layer,” Phys Fluids, 2011, 23, 065101
[20] K-C Lee, “A wake model for Wind Turbine Power Prediction”, MSc Thesis, National Taiwan University, 2018
[21] DNVGL-RP-C203: Fatigue design of offshore steel structures [22] C. Heschl, W. Sanz, I. Lindmeier, G. Clauss, “Validation of
scale-adaptive and elliptic relaxation turbulence models applied to flow around buildings”, The Fifth International Symposium on Computational Wind Engineering (CWE2010), Chapel Hill, NC, USA, May 23-27, 2010