Towards Optimal Resource Allocation of Virtualized Network Functions for Hierarchical Datacenters
Chih-Chiang Wang, Ying-Dar Lin, Fellow, IEEE, Jang-Jiin Wu, Po-Ching Lin, Ren-Hung Hwang
Abstract—Telecommunications service providers (TSPs) used to provide network functions to end users with dedicated hard- ware, but they are resorting to virtualized infrastructure for reducing costs and increasing flexibility in resource allocation.
A representative case is the Central Office Re-architected as Datacenter (CORD) project from AT&T, which aims to deploy virtualized network functions (VNFs) over 4,000 central offices across the U.S. However, there is a wide spectrum of options for deploying VNFs over the central offices, varying from highly distributed to highly centralized manners. The former benefits end users with short response time but has its inherent limitation on utilizing geographically dispersed resources, while the latter allows resources to be better utilized at a cost of longer response time. In this work, we model the TSP’s virtualized infrastructure as hierarchical datacenters, namely hierarchical CORD, and provide a resource allocation solution to strike the optimal balance between the two extreme options. Our evaluations reveal that in general, the 3-tier architecture incurs the least cost in case of deploying VNFs under moderate or loose delay constraints. Furthermore, the margin of improvement on the resource allocation cost increases inversely with the overall system utilization rate. Our results also suggest that as heavy request load overwhelms the network infrastructure, the relevant VNFs shall be migrated to lower-tier edge datacenters or to some nearby datacenters with superior network capacity. The evaluations also demonstrate that the proposed model allows highly adaptive VNF deployment in the hierarchical architecture under various conditions.
Index Terms—NFV, hierarchical CORD, resource allocation, optimization.
I. INTRODUCTION
O
VER the years, telecommunications service providers (TSPs) used to deploy dedicated hardware to provide end users with network services [1]. Such deployment is inflexible because the network functions are strictly confined to the hardware and their deployment locations and quantities cannot be dynamically adjusted on demand. As a result, upgrading network functions usually means replacing old hardware with new one, which incurs significant expenditures to the TSPs.These problems together have thwarted the TSPs’ pace of adopting new services. Network function virtualization (NFV) [2] happens to be an appealing solution to these problems.
In NFV, network functions are decoupled from underlying
C. C. Wang is with Department of Computer Science and Information Engineering, National Kaohsiung University of Science and Technology, Kaohsiung, Taiwan, 80778, e-mail: [email protected].
Y. D. Lin is with Department of Computer Science, National Chiao Tung University, Hsinchu, Taiwan, 300, e-mail: [email protected].
J. J. Wu, P. C. Lin and R. H. Hwang are with Department of Com- puter Science and Information Engineering, National Chung Cheng Uni- versity, Chiayi, Taiwan, 62102, e-mail: [email protected], {pclin, rhh- wang}@cs.ccu.edu.tw
hardware and become virtualized software instances, namely virtualized network functions (VNFs). This solution allows VNFs to be dynamically instantiated and placed wherever appropriate upon demand. The infrastructure of computation, networking and storage consists of only commodity hardware and is shared by all the VNFs in service to bring down the TSPs’ capital expenditures. The automatic service orchestra- tion of the VNFs also reduces the operational expenditures of the infrastructure.
An NFV-enabled TSP can allocate resources of datacenters in its network hierarchy to serve as the NFV infrastructure [3].
Such datacenters are named NFV datacenters [4]. The resource allocation may take place in the tiers from central offices (COs) to network operations center (NOC). A question arises immediately: How should the TSP allocate its NFV datacenter resources to support network functional demands across the network hierarchy? There is a wide spectrum of options for such resource allocation, varying from highly centralized to highly distributedmanners. With a highly centralized resource allocation scheme, user traffic is forwarded to and served in a centralized NFV infrastructure, e.g., the NOC, the concept similar to the idea of cloud computing. The advantage is that resources in the centralized NFV infrastructure can be easily shared among users on demand and efficiently utilized from the perspective of statistical multiplexing. However, users are likely to experience long latency when served by the centralized VNFs due to the long distance from them to the centralized infrastructure. The long latency will undermine the utility of VNFs because the expected end-to-end latency through network functions is usually in the order of only a few milliseconds.
In contrast, pushing VNFs close to the users will signifi- cantly shorten the latency, a concept similar to the idea of edge computing. A representative case is the Central Office Re- architected as Datacenter (CORD) project from AT&T, which aims to deploy VNFs such as virtual customer premises equip- ment (vCPE) over 4,000 central offices across the U.S. [5], [6].
However, resources that are scattered over the geographically dispersed COs may not be well utilized by the demands of users from different regions. For example, resources in one CO may be over-utilized even when those in other COs are under- utilized. Soares et al. [7] summarize the features of existing approaches to realizing service functions in datacenters of TSPs.
In between the two extreme network architectures, the highly-centralized and the highly-distributed ones, there exists a spectrum of hierarchical architecture design whereby a TSP can allocate its datacenter resources hierarchically for NFV
usage [8]. In this regard, if VNFs in a tier of datacenters near to users cannot process the user traffic (e.g., because they are too over-utilized to meet the required delay constraints), the traffic will be forwarded upstream to the VNFs in the next higher tier of datacenters for further processing. Therefore, such hierarchical design strikes a balance between service latency and resource utilization. The aforementioned designs are compared in Table I.
TABLE I
COMPARISON OF DESIGNS OF RESOURCE ALLOCATION FORNFV DATACENTERS.
Design highly-centralized highly-distributed hierarchical
Latency long short adapted
Utilization high low adapted
Flexibility low low high
We expect the need of allocating NFV resources across the datacenter hierarchy adaptively according to the delay con- straints of network functions. Intuitively, if the delay constraint is loose, it is preferable to allocate VNFs in a higher tier of the hierarchy for better resource sharing and utilization; otherwise, it is preferable to allocate VNFs in a lower tier of the hierarchy for shorter end-to-end latency. Therefore, given a set of desired network functions to be offered, an optimal resource allocation plan is important for determining how much hardware capacity in each datacenter should be allocated for VNF deployment with the objective of minimizing the overall deployment cost subject to the required constraints of user-perceived latency.
Although there have been a number of research studies of NFV resource allocation [9]–[12], the issue of NFV resource allocation for hierarchical datacenters is still rarely addressed in literature so far.
To address the above issues, we model the hierarchical NFV datacenters of a TSP as a tree structure in which the leaf nodes represent the COs and the root node represents the NOC. This hierarchy is named hierarchical CORD. Given the total capacity of virtual machine (VM) resources, we would like to minimize the cost of deploying VNFs across the hierarchy while meeting the end-to-end delay constraints of user traffic. Unlike prior related work which addressed allocation of VNFs in networked servers within a confined area (e.g., in a datacenter), this work minimizes the cost of deploy- ing VNF instances across the hierarchy of datacenters. Since two adjacent datacenters in our model may be hundreds of kilometers away from each other, keeping the user-perceived end-to-end latency within the required delay constraint is more challenging than that in prior studies.
The contributions of this work are summarized as follows:
• This work features the modeling of resource allocation and latency in hierarchical NFV datacenters, which were rarely addressed in prior studies.
• We provide a solution to finding the optimal resource allocation plan, which minimizes the cost of deploying VNF instances across the hierarchy of datacenters. We also discuss the implications of the obtained numerical results to the TSP operators in several issues.
The rest of this work is organized as follows. In Sec- tion II, we will review existing work about NFV modeling and optimization. In Section III, we describe the model and the assumptions used through this work. We then formulate the optimization problem as well as provide an algorithm for solving the problem in Section IV. In Section V, we evaluate the problem from the perspectives of six issues and study the implications of the obtained numerical results to the TSP operators. We conclude this work and point out future work in Section VI.
II. RELATEDWORK
NFV has attracted significant interest in recent years due to its agility to adopt new technology and its flexibility in on-demand deployment of network functions. European Telecommunications Standards Institute (ETSI) has given an overview of NFV infrastructure in [13] and has introduced several use cases of NFV in [14]. Well known examples of NFV applications include virtualization of CPE and evolved packet core (EPC) of TSPs [15], to name a few. We refer the readers to a comprehensive survey in [3] for details about the recent progress of NFV development and the research challenges.
A major topic in the field of NFV research is allocation and orchestration of VNF instances to provide satisfying network services according to user demands. Existing studies usually formulated problems of this type as an optimization problem given a set of resources (e.g., host and link capacity) within a network region, and solved them for an objective (e.g., minimizing the total cost) subject to certain constraints (e.g., constraints on end-to-end delays and order of VNF execution) [16]. Because the problems associated with NFV resource allocation are known to be NP-hard, they are usually solved with certain heuristic or meta-heuristic algorithms to speed up the computation time. Such optimization solving techniques have been applied to VNF placement and traffic engineering problems as well.
Herrera et al. surveyed resource allocation methods in NFV [16]. They divided such allocation into three stages: chain composition, forwarding graph embedding, and scheduling.
Due to the high complexity of optimizing all the three stages at the same time, most existing solutions deal with only one stage in their problem definition. If more than one stage are to be optimized, a solution may optimize multiple stages in a coordinated fashion. In such a coordinated fashion, the result from a stage is prepared to optimize the next stage, or all the stages are optimized in one step; otherwise, each stage is optimized independently. Moreover, the service requests may be assumed to be known a priori and scheduled in advance (i.e., the offline problem), or arrive on demand (i.e., the online problem). In the latter problem, VNFs may be recomposed, remapped and rescheduled when new requests arrive. In this regard, our work, by simplifying the embedded forwarding graph and chain composition, provides a trackable model for accessing optimal resource allocation of VNFs in hierarchical CORD.
Besides the works covered in [16], we also notice the following studies related to this work. Chase et al. used
stochastic optimization to minimize the cost of processing, storage and bandwidth and to address the uncertainty of VM and bandwidth demands [17]. It is quite straightforward to extend the optimization of VM placement to VNF placement.
Mohammadkhan et al. addressed the issue of network function placement and service routing simultaneously with mixed inte- ger linear programming (MILP), with respect to the constraints of link capacity and flow delay [18]. Qu et al. also formulated VNF scheduling and traffic steering as an MILP problem of minimizing the latency of the overall VNF schedule [19].
Wang et al. jointly optimized the three stages in NFV resource allocation [20]. They also formulated the problem as MILP, and used heuristic algorithms such as greedy algorithms to get a near optimal solution. However, none of the prior studies consider the case in which VNFs may be deployed across datacenters in the hierarchical network architecture of TSPs.
The key challenge of deploying VNFs in hierarchical NFV datacenters is to find the optimal resource allocation which meets user demands. To the best of our knowledge, there is still rare work in literature to address this issue so far. A few recent studies employed hierarchical orchestration of network services in NFV systems to address various architectural challenges. In [21], Abu-Lebdeh et al. optimized the placement of VNF orchestrator in NFV systems. In [22], Garay et al. pro- posed a service model which enables hierarchical orchestration of NFV-based network services. In [23], the authors presented a case of using two layers of NFV orchestrators to offer network service across two administrative domains. In [24], Bernardos et al. proposed a platform to offer service orches- tration over multiple domains in 5G wireless communication system. Krishnaswamy et al. proposed a method to partition the VNF types according to their latency sensitivity [8]. The more latency sensitive a VNF is (e.g., eNodeB), the closer shall the VNF be deployed to users. The work in [8] defined a utility function to determine the partition of VNF types based on the operating cost and the latency, and attempted to minimize the utility usage subject to several constraints such as the placement policy. However, some constraints in that work are policy-based and not defined precisely, and it also lacks rigid performance modeling of the partition. Moreover, the hierarchy of datacenters are just layered, rather than a tree- like structure in a TSP network. Thus, a study in resource allocation for hierarchical NFV datacenters based on rigid performance modeling is strongly desired.
Compared with existing studies, this work is the first attempt to model the architecture of hierarchical CORD to provide network functions to end users, subject to specific delay constraints. We demonstrate the effectiveness of hierarchical CORD in reducing the cost of VNF deployment and the optimal strategies to deploy VNFs across the hierarchy.
III. MODEL ANDPRELIMINARIES
Our model is targeted to a generic NFV system which allo- cates resources from a network of geographically distributed datacenters to perform network functions for and on behalf of subscriber networks in specific regions. The allocation of datacenter resources is in unit of virtual machines (VMs) with
different configurations and cost rates. We consider that for efficient resource pooling, the datacenters are inter-connected, via dedicated data links, into a tree-structured, NFV-service- oriented network. On the lowest level of the tree resides the designated local datacenter for each subscriber region. It is possible for the NFV system to serve the NFV requests at their designated local datacenter, or to route the requests, upward through the NFV network, to one of their “ancestor”
datacenters to receive the requested network function service.
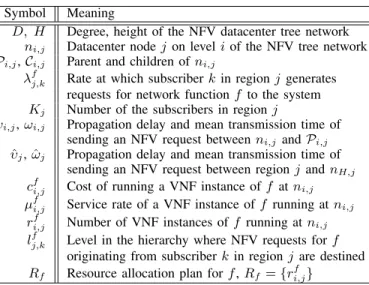
The mathematical notations used to build the NFV system model are introduced below and summarized in Table II.
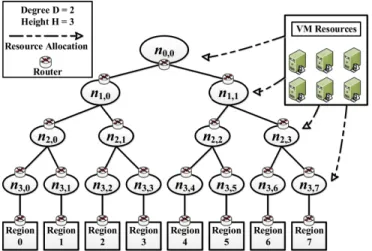
For ease of illustration, in the rest of this work we limit our discussion to a perfect tree-like network structure, but the proposed modeling and analytic techniques, with slight modification, can surely be applied on arbitrary hierarchical network structures. As illustrated in Fig. 1, a set of datacenters participating in the NFV system are connected into a perfect tree-structured network of degree D and height H. More specifically, we denote the datacenter set by V = {ni,j| i, j ∈ Z ∧ i ∈ [0, H] ∧ j ∈ [0, Di)}, where ni,j means datacenter j on level i of the tree network and nH,j is the designated local datacenter for region j. The parent of nx,y in the tree is Px,y = nx−1,by/Dc, x ∈ [1, H]; the children of nx,y are Cx,y = {nx+1,j | j ∈ [Dy, D(y + 1))}, x ∈ [0, H − 1].
We use cfi,j to denote the cost of running a VNF instance of network function f at ni,j, assuming that each such instance serves requests one at a time from the front of its queue of infinite size and that the service times of each such instance follow an exponential distribution with parameter µfi,j. In the rest of this paper, µfi,j will be referred to as the service rate of a VNF instance of f running at ni,j. Finally, arrivals of requests for f to the NFV system are modeled by Poisson processes with different rates: Sλf = {λfj,k | j, k ∈ Z ∧ j ∈ [0, DH) ∧ k ∈ [0, Kj)}, where λfj,kdenotes the rate at which subscriber k in region j generates requests for f to the system, λfj =PKj−1
k=0 λfj,k, and Kj is the number of the subscribers in region j.
TABLE II MATHEMATICAL NOTATIONS
Symbol Meaning
D, H Degree, height of the NFV datacenter tree network ni,j Datacenter node j on level i of the NFV tree network Pi,j, Ci,j Parent and children of ni,j
λfj,k Rate at which subscriber k in region j generates requests for network function f to the system Kj Number of the subscribers in region j
υi,j, ωi,j Propagation delay and mean transmission time of sending an NFV request between ni,j and Pi,j
ˆ
υj, ˆωj Propagation delay and mean transmission time of sending an NFV request between region j and nH,j
cfi,j Cost of running a VNF instance of f at ni,j
µfi,j Service rate of a VNF instance of f running at ni,j
ri,jf Number of VNF instances of f running at ni,j
lfj,k Level in the hierarchy where NFV requests for f originating from subscriber k in region j are destined Rf Resource allocation plan for f , Rf = {rfi,j}
Fig. 1. NFV system model.
We now characterize the attributes of the data links that make up the NFV system model. Since NFV requests are routed through the NFV network via dedicated data links, the variation in the propagation delay of such a data link is relatively insignificant in our constrained optimization problem as compared with other components such as the transmission times and the processing delays. Therefore, we consider that the propagation delay of sending an NFV request over the link between ni,jand Pi,jcan be described by a deterministic value υi,j.
To make the model trackable for analytical formulations, we assume that the amount of time required by the link between ni,j and Pi,jto transmit an NFV request is exponentially dis- tributed with mean ωi,j. Similarly, the propagation delay and the transmission time of sending an NFV request between a subscriber in region j and its designated local datacenter nH,j
are modeled by a deterministic value ˆυj and an exponentially distributed random variable with mean ˆωj. Data transmission within a subscriber region or a datacenter is dismissed from the model. The primary purpose of our system model is to assess the optimal resource allocation plan for NFV deployment over a set of tree-structured hierarchical datacenters. To this end, we denote a resource allocation plan for network function f by Rf = {rfi,j}, where rfi,j indicates the number of VNF instances that each possible datacenter ni,jallocates to running f .
IV. PROBLEMFORMULATION
In the NFV resource allocation problem we want to compute an optimal (minimal-cost) resource allocation plan for deploy- ment of specific network functions across an NFV system with respect to a desired service performance. In this section, we first derive, based on the aforementioned model, the user- perceived response time of a single flow of NFV requests as the desired performance metric. We then use this performance metric to formulate a constrained optimization problem which captures the fundamental performance-cost tradeoff of the optimal NFV resource allocation plan.
A. User-Perceived Response Time of a Single Flow
Consider a flow of NFV requests, f lowfj,k, which is routed from its source, subscriber k in region j, towards the destination na,b, which is also the level-lj,kf ancestor of the source in the tree, 0 ≤ lj,kf ≤ H. The user-perceived response time of f lowj,kf is the sum of the overall routing delay plus the processing delay experienced by f lowfj,k. f lowfj,k must traverse through a sequence of data links which connect region j, datacenter nH,j, datacenter nH−1,bj/Dc, . . ., and the level-lfj,k ancestor into a path. Hence, with the assumptions of Poisson arrivals and exponentially distributed transmission times, we can abstract the routing process of f lowfj,k as an (H − lj,kf + 1)-stage open tandem network of (H − lfj,k+ 1) M/M/1 queues. Then, we arrive at the following results:
Lemma 1:The utilization of the data link between region j and its designated local datacenter is defined by
ρ0j = ωˆjP
∀fλfj · pf, λfj =PKj−1
k=0 λfj,k (1) where pf is the average bandwidth consumed per request for network function f .
Lemma 2:The utilization of the data link between datacenter ni,j and Pi,j is defined by
ρ0i,j= ωi,jP
∀fλ0fi,j· pf (2) where λ0fi,j =P(j+1)DH−i−1
x=jDH−i
PKx−1
y=0 λfx,y· [lx,yf < i]. Note that [lx,yf < i] is 1 if lfx,y < i, and 0 otherwise.
Lemma 3: The overall propagation delay experienced by f lowfj,k is
P Dj,kf = υˆj+Pl
f j,k+1
x=H υx,bj/DH−xc (3)
Lemma 4: The overall mean routing delay experienced by f lowfj,k is
N Dfj,k= P Dj,kf +1−ρωˆj0 j
+Pl
f j,k+1 x=H
ωx,bj /
DH−xc
1−ρ0
x,bj / DH−xc
(4) The next step is to compute a comprehensive expression of the processing delay by an M/M/m queue model. Firstly, we need to define the number of VNF instances of f running at the destination nx,y, say rfx,y. Then, the mean user-perceived response time of f lowfj,kis the sum of the associated routing delay plus the processing delay. We obtain the following results:
Lemma 5: The overall arrival rate of requests for f that arrive at na,b and are served by the VNFs therewithin is defined by
λ00fa,b= P(b+1)DH−a−1 x=bDH−a
PKx−1
y=0 λfx,y· [lx,yf == a] (5)
Lemma 6:The processing delay experienced by the requests for f at nx,y is
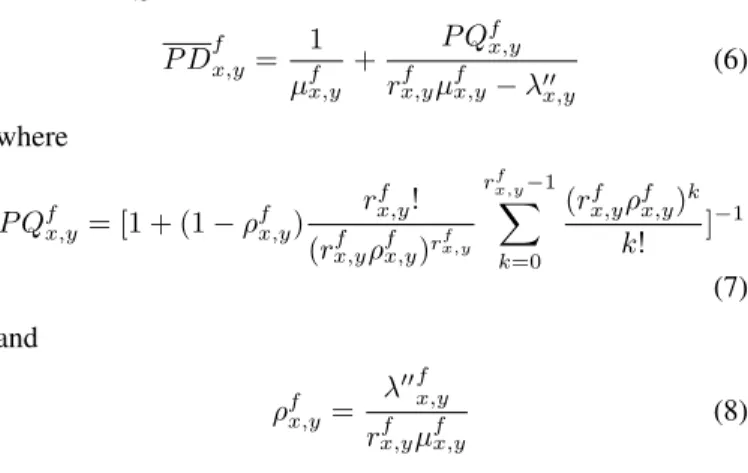
P Dfx,y= 1 µfx,y
+ P Qfx,y
rfx,yµfx,y− λ00x,y (6) where
P Qfx,y = [1 + (1 − ρfx,y) rfx,y! (rx,yf ρfx,y)rfx,y
rfx,y−1
X
k=0
(rfx,yρfx,y)k k! ]−1
(7) and
ρfx,y= λ00fx,y rfx,yµfx,y
(8)
Lemma 7: The mean user-perceived response time experi- enced by f lowj,kf is
P Lfj,k= N Dfj,k+ P Dfa,b (9) B. Constrained Optimization for NFV Resource Allocation
TSPs are expected to provide network functions to sub- scribers with a bounded service latency. In specifics, many network functions such as intrusion detection, firewall, content delivery, etc., are especially time sensitive and each must guarantee response within a specified time constraint. From this perspective, we set the optimization target of our NFV re- source allocation problem as to minimize the overall resource allocation cost with respect to specified delay constraints of various network functions, rather than to minimize the overall service latency with respect to cost constraints.
A resource allocation plan specifies the cost of running a VNF instance of f at each datacenter ni,j, namely cfi,j, as well as the number of VNFs of f running at ni,j, namely rfi,j, for all possible f . Given such a resource allocation plan, the overall cost is simply the sum of all possible products of cfi,jri,jf . The objective function of our NFV resource allocation problem is to minimize the overall cost incurred by the resource application plan:
minX
∀f H
X
i=0 Di−1
X
j=0
cfi,jrfi,j (10) The aforementioned objective function is subject to two common performance constraints as follows. The Constraint function I says that the mean user-perceived response time of every possible flow should be under a target number. The Constraint function II ensures that the data link has enough bandwidth to transmit the NFV requests.
Constraint function I:
P Lfj,k≤ tj,k, ∀j ∈ [0, DH), ∀k ∈ [0, Kj), ∀f (11) Constraint function II:
X
∀f
λ0fi,j· pf < Bi,j (12)
where tj,k denotes the timing constraint imposed on f lowfj,k while Bi,j denotes the bandwidth capacity of the data link between ni,j and Pi,j.
C. Algorithm for the Solution
The optimization problem formulated in the previous section can be viewed as packing resources into a finite number of datacenters with respect to given delay constraints. This sort of resource allocation problem resembles the classic bin-packing problem which has an NP-hard computational complexity, so we use a heuristic algorithm named particle swarm optimiza- tion (PSO) on Matlab to speed up the solving process. In this algorithm, the allocation of VMs in the hierarchical datacenters and the assignment of subscribers to the VMs are represented as the status of a particle. The algorithm begins with a set of candidate particles, and then randomly adjusts the candidate particles to search for the globally best particle that results in the lowest cost according to the cost function F . PSO algorithm has inner loops going through the candidate particles of size p and one outer loop of t iterations. The complexity of PSO algorithm is O(p × t × log(p) × comp cost), where comp cost, the main computational cost in the evaluation of the objective function, has the complexity of Θ(|f |×H ×DH), where |f | denotes the number of offered network functions.
Note that PSO algorithm is a meta-heuristic algorithm which can search very large spaces of candidate solutions. Meta- heuristics like PSO are expected to find an optimal or near- optimal solution quickly, but they do not guarantee an optimal solution is ever found. The detail of this algorithm is listed as follows:
1: P ← P article Initialization();
2: globalBest ← pBest ← the best p ∈ P ;
3: for i = 0 to max iterations do
4: for p ∈ P do
5: v ← v + c1 ∗ rand ∗ (pBest − p) + c2∗ rand ∗ (globalBest − p);
6: p ← p + v;
7: end for
8: for p ∈ P do
9: if F (p) is better than F (pBest) and p satisfies the delay constraint then
10: pBest ← p;
11: end if
12: end for
13: if F (pBest) is better than F (globalBest) then
14: globalBest ← pBest;
15: end if
16: end for
In this algorithm, v determines how the current particle p is adjusted, and it is set to 0 initially. c1and c2 are the personal learning coefficient and the global learning coefficient, and they are set to 1.5 and 2 arbitrarily. max iterations is arbitrarily set to 200.
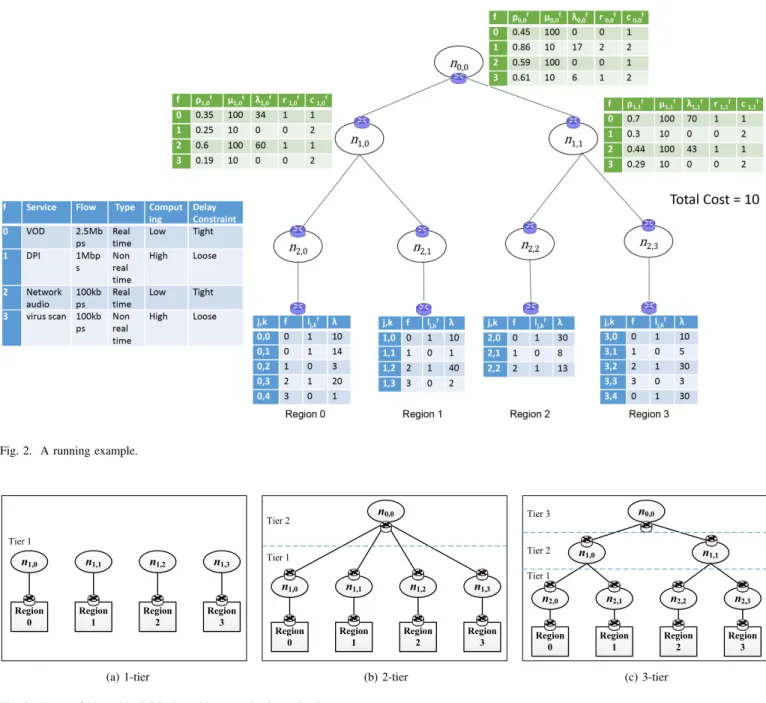
Fig. 2 illustrates a running example of VNF allocation in a hierarchical datacenter architecture where seven NFV datacen- ters are connected into a 3-tier tree network to collaboratively process traffic and offer network functions to subscribers. In
this example, the NFV operates across four regions, namely Region 0 ∼ 3. Each region is accompanied with a table which describes the request load initiated by the subscribers therein.
For instance, the row labeled with (j = 0, k = 0) in Region-0 table indicates that Subscriber 0 in Region 0 generates requests for network function 1 (f = 1) at a rate of 10 (λ = 10) and that these requests are served by the ancestor on level 1 (lfj,k = 1), i.e., datacenter n1,0. Each datacenter is also accompanied with a table which describes all the request load being processed therein. For instance, the row labeled with (f = 0) in the table adjacent to n1,0 indicates that a flow of requests for network function 0 (f = 0) arrive at n1,0 at a rate of 34 (λf1,0 = 34) and that n1,0 runs one VNF instance (rf1,0 = 1) of network function 0 (f = 0) which offers a service rate of 100 (µf1,0 = 100) at a cost of 1 (cf1,0 = 1). The leftmost table in Fig. 2 shows attributes of the four offered network functions such as VOD and DPI. For simplicity, in this example we do not assume any delay constraints. The total cost is P
∀f
PH i=0
PDi−1
j=0 cfi,jri,jf , where cfi,j is given in the example and ri,jf is calculated in the optimal solution.
The total cost is 10 after optimization – the optimal solution suggests deploying 2 VNF instances with cost 2 in n1,0, 2 VNF instances with cost 2 in n1,1, and 3 VNF instances with cost 6 in n0,0.
V. EVALUATION ANDIMPLICATIONS
In this section we compare three types of hierarchical CORD architectures, from 1-tier to 3-tier as illustrated in Fig. 3, and discuss the cost minimization strategies for running VNF instances in the hierarchy and their implications to the TSP operators. In specifics, we evaluate the VNF allocation in the hierarchy from the perspectives of six major issues in the following subsections. In the first subsection, we compare the costs of allocating VNFs in the three types of architectures under various conditions. In the remaining subsections, we focus on the VNF deployment in the 3-tier architecture, which has the lowest cost in general. If not otherwise mentioned, in the evaluations we use the parameter values listed in Table III by default. For simplicity, we assume that in all the evaluations but the last, there is only one VNF in the deployment instead of multiple VNFs or service chains. We also assume an equal request rate from each subscriber and an equal service rate of each VNF instance. To simplify the notations, we use Λ to denote the aggregated request arrival rate from a total of five subscribers in each region, and µ to denote the service rate of each VNF instance in the evaluations.
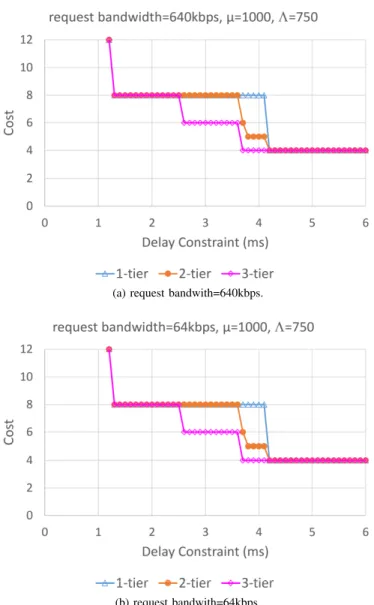
A. System Cost in Three Types of Hierarchical CORD First, we evaluate the system cost under various delay constraints against three factors: request bandwidth, service rate, and arrival rate. In Fig. 4 we first compares such cost of VNF deployment (i.e., the required number of VNF instances) in the 1-tier, 2-tier, and 3-tier hierarchical CORD architectures with different request bandwidths (640kbps vs.
64kbps). As presented in Fig. 4, when the delay constraint becomes loose, the NFV requests are redirected to the upper
TABLE III
DEFAULT PARAMETER VALUES IN THE EVALUATIONS. parameter default value
µ 1000
Λ 750
ˆ
vj 0.1ms (20km)
vi,j(2-tier) 2.5ms (500km) vi,j(3-tier) 1.25ms (250km)
cfi,j 1
request bandwidth 640kbps/NFV request ˆ
ωj 0.0012ms (10Gbps) ωx,y 0.012ms (1Gbps)
tiers; thus, the cost will be reduced. However, even though the request bandwidth in Fig. 4(a) is ten times larger than that in Fig. 4(b), both cases have identical costs. This result implies that the backbone bandwidth is not a bottleneck for the request bandwidths. Thus, here we focus on exploring the impact of the other two factors, and leave the detailed study about the impact of request bandwidth to Section V-E. We have also evaluated the three architectures with a larger bandwidth setting (request bandwidth = 2.5Mbps) while keeping the remaining settings the same. The results look identical to Fig. 4(a).
If we look into Fig. 4, when the delay constraint is between 2.6ms and 4.1ms, the cost in the 3-tier architecture is around 25% lower than that in the 2-tier architecture. The reason is that the NFV requests cannot be redirected to the highest tier in the 2-tier architecture due to the longer propagation delay (i.e., 2.5ms, in contrast to 1.25ms in the 3-tier architecture), while they can be redirected to the second tier in the 3- tier architecture. When the delay constraint is tighter than this interval, the optimal deployments in the three types of architectures yield the same cost because the VNF instances are all deployed in the lowest tier. Note that when the delay constraint is looser than this interval, the optimal deployment costs of the three types of architectures are still the same.
It appears strange at first glance because the VNFs could be deployed in the upper tiers for better resource sharing.
However, if we consider Eq. 8 in Section IV-A, there should be a sufficient number of VNF instances deployed (i.e., 4 in this case) to handle the incoming requests. In other words, the optimal deployment cost cannot be lower than that of deploying the required number of VNF instances for the given offered load, even though all the VNF instances can be all deployed in the highest tier in an architecture. Certainly, this result is based on the assumption that the deployment cost of a VNF instance is the same at all tiers.
Suppose the service rate µ of the VNF is reduced to 200 and the other two factors remain the same as those in Fig. 4(b).
Fig. 5 presents the optimal cost of VNF deployment in this case. It is noted that the processing time in the VNF alone is 5ms, not to mention the propagation delay between adjacent tiers. Thus, the x-axis in this figure starts from 5.2ms because a lower delay constraint cannot be satisfied. When the delay constraint is less than 8.0ms, the trend of the cost is similar to that in Fig. 4(b). That is, the cost in the 3-tier architecture is lower than the 2-tier one in the middle interval (from 6.7ms
Fig. 2. A running example.
Region 3 n1,3 Tier 1
Region 2 n1,2
Region 1 n1,1
Region 0 n1,0
(a) 1-tier
Tier 2
Tier 1
Region 3 n1,3
Region 2 n1,2
Region 1 n1,1
Region 0 n1,0
n0,0
(b) 2-tier
Tier 1
Region 3 n2,3
Region 2 n2,2
Region 1 n2,1
Region 0 n2,0
n0,0
n1,0 n1,1
Tier 2 Tier 3
(c) 3-tier Fig. 3. Types of hierarchical CORD architectures in the evaluations.
to 6.9ms) of delay constraints. When the delay constraint is between 7.0ms and 7.9ms, the three types of architectures have the same cost. Although the VNF instances in the 2- or 3-tier architecture could be deployed in the upper tiers to reduce the cost, the budget for the server latency would become tighter due to the additional network latency in the upper tiers. Thus, the 2- or 3-tier architecture does not have an edge over the 1-tier architecture until the delay constraint is larger than 7.9ms. The 2- or 3-tier architecture has a lower cost again with a longer delay constraint. However, even if all the VNF instances are deployed in the highest tier in either the 2- or 3-tier architecture, the total arrival rate from the four underlying regions are 3,000. Given that the utilization ρfx,y should be smaller than 1 for a stable queue, rfx,y in Eq. 8 is at least 16, which is the lower bound of the cost.
If we reduce the arrival rate Λ to 200 while keeping the
other two factors the same as those in Fig. 4(b), the cost of deployment is presented in Fig. 6. Given a high service rate and low arrival rate in this case, the cost of deployment can be as low as 1 with loose delay constraints in the 2- or 3-tier architecture, but the cost in the 1-tier architecture must be at least 4 to serve the requests in the four regions. The parameter settings result in the largest cost reduction among the cases in this subsection.
According to the above evaluations, we conclude that the cost in the 2- or 3-tier hierarchical architecture is lower than that in the 1-tier architecture with a moderate or large delay constraint. The advantage of the 2- or 3-tier architecture is particularly obvious in the case of a low arrival rate and high service rate. The cost is up to four times lower in the scenario of four regions. However, if the arrival rate is high and the service rate is low, the 2- or 3-tier architecture may not be
(a) request bandwith=640kbps.
(b) request bandwith=64kbps.
Fig. 4. Cost of VNF deployment for different request bandwidths in three types of hierarchical CORD.
Fig. 5. Cost of VNF deployment in three types of hierarchical CORD (with lower service rate).
preferable to the 1-tier architecture until the delay constraint is large enough. Although the 2-tier architecture is good enough
Fig. 6. Cost of VNF deployment in three types of hierarchical CORD (with lower arrival rate).
for most delay constraints, the 3-tier architecture is better with moderate delay constraints. Thus, the implications to TSP operators is that the cost of VNF deployment is the lowest in the 3-tier architecture, which is recommended in practice. As a result, we consider only the 3-tier architecture in the following evaluations.
B. Heavy Tail vs. Heavy Head
In this evaluation, we observe in which tiers the VNF instances can be optimally deployed in the 3-tier architecture with various delay constraints, as presented in Fig. 7. Note that two or more optimal solutions with the same cost may be derived due to the randomness in the PSO algorithm. In the figures starting from Fig. 7, if a VNF instance can be deployed in either a lower tier or an upper tier in the optimal solutions given a delay constraint, we prefer the solution in which the instance is deployed in an upper tier in order to leave the resources in a lower tier for VNFs with tighter delay constraints. Another reason is that the datacenter in an upper tier usually has abundant resources for VNF allocation.
According to this figure, the deployment of VNF instances tends to move from a lower tier (i.e., heavy tail) to an upper tier (i.e., heavy head) as the delay constraint becomes loose.
The VNF instances are all deployed in the lowest tier when the delay constraint is less than 2.6ms. As the delay constraint is loosen, some instances start to be deployed in tier- 2, and finally deploying all in tier-3 becomes feasible when the delay constraint is larger than 4.6ms. The total number of VNF instances (i.e., the deployment cost) with a delay constraint larger than 3.6ms is just one third of that with a delay constraint of 1.2ms. Thus, the deployment cost can be reduced significantly if the NFV requests can be redirected to an upper tier due to a loose delay constraint. Note that the costs with the delay constraints larger than 3.6ms are all 4, whether the VNF instances are deployed in tier-2 or tier-3. In the former deployment, two instances are deployed in each of the two datacenters of tier-2; in the latter, four instances are in the datacenter of tier-3. Both deployments are optimal. The
difference is in the network latency and server latency to be discussed in the next subsection.
Also note that the number of VNF instances (i.e., the cost) is at least 4 in this evaluation according to Eq. 8 for the default parameter setups. If the cost is to be reduced further, the arrival rate should be even lower or the service rate should be higher.
Moreover, if the propagation delay between the datacenters in adjacent tiers is short, it will be easier to meet the delay constraint in the 3-tier architecture as if the delay constraint were looser; thus, more VNF instances can be deployed in an upper tier to reduce the system cost.
Fig. 7. Number of VNF instances deployed in each tier for various delay constraints in the 3-tier architecture.
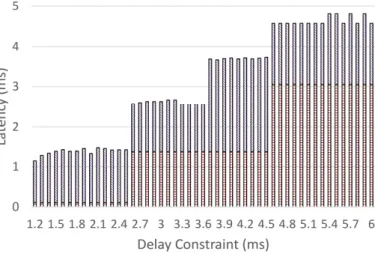
C. Network Latency vs. Server Latency
To identify the source of latency, we contrast the network latency with the server latency with various delay constraints in the 3-tier architecture in Fig. 8. If we compare Fig. 7 and Fig. 8, we will find that the network latency increases when the VNF instances are deployed in the upper tiers. The intervals of delay constraints in which the instances are deployed in each of the three tiers are consistent in both figures. The instances start to be deployed in tier-2 when the delay constraint is larger than 2.6ms; thus, the network latency is 1.25ms longer than when the instances are deployed in tier-1. The network latency is fixed when the instances are all deployed in tier-2. However, to reduce the cost with a loose delay constraint, the number of instances is reduced when the delay constraint is larger than 3.6ms. Thus, the server latency is increased, even larger than the network latency in this deployment. The implication is that it is better to deploy the VNF with a loose delay constraint to the upper tiers because multiplexing gain could effectively reduce the number of VNF instances deployed, thereby also reducing the system cost.
There are two more interesting observations. First, the number of VNF instances deployed when the delay constraint is 1.2ms is 1.5 times larger than that when the delay constraint is 1.3ms in Fig. 7, but the difference of server latency with the two delay constraints is not that much in Fig. 8. This result is because the server latency depends not only on the number of VNF instances, but also the utilization of the VNF instances
Fig. 8. Network latency vs. server latency in the 3-tier architecture.
according to Eq. 7. It is the different utilization that results in the difference in server latency. Second, although the number of VNF instances are the same in both tier-2 and tier-3 (i.e., 4) when the delay constraints are larger than 3.6ms in Fig. 7, the server latencies in tier-2 and tier-3 are different with those delay constraints according to Fig. 8. Note that the four VNF instances are in two datacenters when they are deployed in tier-2, but in only one datacenter when they are deployed in tier-3. The request arrivals are split into two datacenters in the former case. The utilization will be adjusted in Eq. 7 to meet the delay constraints. These factors together make the server latencies different in both cases.
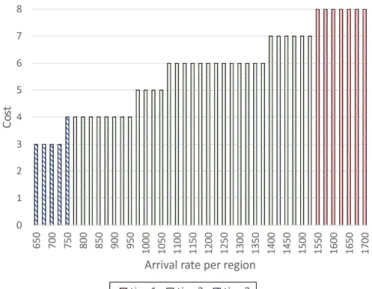
D. Popular VNFs with High Arrival Rate
If some VNFs are popular with high arrival rates, the cost of deploying them will be apparently increased. To focus on the impact of high arrival rates, we assume the delay constraint is very loose by setting it to 100ms. Fig. 9 presents this tendency because more VNF instances are needed to satisfy a high arrival rate, even if the instances are deployed in the same tier.
Eq. 8 also manifests this tendency. According to this figure, the VNF instances are all deployed in tier-3 to reduce the cost when the arrival rate is less than or equal to 750. When the arrival rate becomes larger, more instances are deployed in tier-2, and finally all the instances are deployed in tier-1 when the arrival rate exceeds 1500. The VNF instances are deployed downwards in the hierarchy when the arrival rate increases due to the bandwidth constraint in the upper tiers. The implication to the TSP operators is that it is preferable to deploy popular VNFs in the highest tier in the beginning, and then migrate them to a lower tier when the link capacity cannot be satisfied.
An algorithm to determine how to migrate the VNF instances is necessary for future work.
E. VNFs with Large Bandwidth Request
To study the impact of requests with high bandwidth de- mands on the cost of deployment, we assume the aggregated arrival rate Λ from each region is 200 and the service rate µ is
Fig. 9. Total cost with various arrival rates.
40 to simulate a higher arrival rate and lower service rate than the previous evaluations. Fig. 10 presents the number of VNF instances in each tier for various request bandwidths, which are also larger than those in the previous evaluations. As the request bandwidth increases, the traffic will be redirected to the lower tiers because the aggregated request bandwidth from the subscribers will overwhelm the link capacity in the upper tiers.
Specifically, when the request bandwidth is larger than or equal to 5Mbps, all the VNF instances will be deployed in tier-1.
However, the cost of deployment just increases slightly in the lower tiers. This result is consistent with that in Fig. 4, which presents that the request bandwidth has relatively less impact on the overall cost than the other factors such as the arrival rate and the service rate. The implication to the operators is that if the request bandwidth to a VNF type is expected to be large (e.g., in streaming applications), it would be preferable to deploy such VNFs in the lower tiers or to enlarge the link capacity in the upper tiers.
Fig. 10. Number of VNF instances with various request bandwidths.
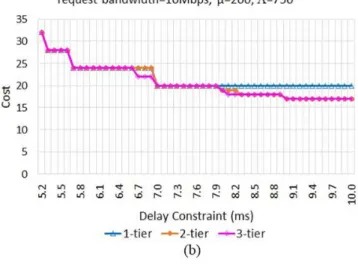
To further examine the impact of requests with high band- width demands in a high-speed network environment, we set
request bandwidth and link capacity to 10Mbps/NFVrequest and 40 Gbps, respectively, re-run the experiments of Sec- tion V-A, V-B, V-C, and V-D, and plot the results in Fig. 11.
As shown in Fig. 11-(a) to 11-(e), the first five experiments yield similar results as those obtained previously in Section Section V-A, V-B, and V-C since the optimal system set- tings are about the same when the system utilization rate is low. In the last experiment as well as in the experiment of Section V-D, we gradually tune up the request arrival rate and measure the resultant deployment cost until the delay constraints can no longer be satisfied. The results of these two experiments yield a same conclusion that the optimal system setting tends to migrate more VNFs to lower-tier datacenters as the request load gradually overwhelms the system. These results also demonstrate that the use of a high-speed network infrastructure leads to a great boost in the maximum amount of request load that hierarchical CORD can process in time – with the aid of the high-speed network infrastructure, it is possible for high-tier resources to process more request load without violating the given delay constraints.
F. Two VNFs with Different Delay Constraints
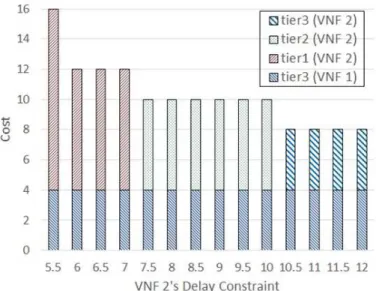
We observed in the previous evaluations that it is preferable to deploy VNFs with a loose delay constraint in the upper tiers. However, in a realistic deployment, it will be common that more than one VNF is deployed in the system. Thus, we assume two VNFs in this evaluation, and see whether the deployment of one VNF will engender a different observation for the deployment of the other.
Suppose µ = 1000, Λ = 750 and the request bandwidth is 640kbps for one VNF, VNF1, and µ = 200, Λ = 150 and the request bandwidth is 64kbps for the other, VNF2. Let the delay constraint of VNF1 be fixed and as loose as 30ms, and that of VNF2 is variable. As presented in Fig. 12, the instances of VNF1 are all deployed in tier-3 and its cost is fixed. When the delay constraint of VNF2 is increasing, the deployment of VNF2 is shifted gradually from tier-1 to tier- 3. This observation is consistent with that in Section V-B, no matter whether VNF1 is deployed or not.
The following are the major observations and key findings of this work: (1) As heavy request load overwhelms the network infrastructure or the delay constraint is tightened, the model reacts by migrating the relevant VNFs to lower-tier datacenters. (2) Given sufficient amount of aggregate request load, the 3-tier architecture incurs the least cost in case of deploying VNFs under moderate or loose delay constraints.
(3) The 1-tier (highly distributed) architecture is especially favored by VNFs with low service rates which are serving a high rate of NFV requests. (4) The effect of server latency on the NFV system performance, as compared with that of network latency, becomes more significant as the delay constraint is loosened. When this happens, the deployment of VNF instances tends to be a heavy-head-like distribution over the hierarchical datacenters. (5) It is preferable to deploy popular VNFs in a higher tier and bandwidth-intensive VNFs in a lower tier for sake of reducing the overall resource allocation cost. Note that the setups of the request arrival
Fig. 11. Results of re-running the experiments of Section V-A, V-B, V-C, and V-D with request bandwidth = 10M bps/N F V request and link capacity = 40Gbps.
Fig. 12. Cost of two VNFs with various delay constraints.
rate, the mean service time, etc., are just relative numbers used to represent different scenarios (e.g., a popular network function which, on average, requires a long service time) for the evaluation purpose. In general, the observed trends persist for different setups.
VI. CONCLUSION
Between the two extreme options of highly distributed and highly centralized deployments of VNFs for TSPs, this work presents an optimal solution to deploy VNFs in a hierarchi- cal CORD architecture. This solution can deploy the VNFs wherever appropriate, either to satisfy the delay constraint or to reduce the cost. The evaluations demonstrate that the 3- tier architecture is slightly preferable than 2-tier and mostly preferable than 1-tier with moderate or loose delay constraints.
This preference is particularly significant when the request arrival rate is low or the service rate is high. If the delay constraint of one VNF is loose, it is preferable to deploy its instances in the higher tier to reduce the overall cost, but the amount of possible cost reduction is subject to the arrival rate and the service rate. The lower the arrival rate or the higher the service rate, the larger amount of cost reduction is possible. The maximum reduction possible is from the number of regions in the 1-tier architecture to 1 in the 3- tier architecture. If the requests are heavy (i.e., high arrival rate or large request bandwidth) in the 3-tier architecture, the VNF instances may be deployed in the lower tiers to reduce network latency or have large link capacity to reduce the cost of deployment. The observation still holds if more than one VNF is deployed.
For simplicity, we do not consider the use of service function chains in the modeling so far, even though they are being realized. Nonetheless, this work still demonstrates the value of the hierarchical CORD architecture for flexible deployment of VNFs, as well as the solution to the optimal deployment. A more complicated model with service function chains will be left to future work.
REFERENCES
[1] P. Quinn and J. Guichard, “Service Function Chaining: Creating a Service Plane via Network Service Headers,” IEEE Computer, vol. 47, issue 11, pp. 38-44, Nov. 2014.
[2] ETSI, “Network Functions Virtualisation – Introductory White Pa- per,” SDN and OpenFlow World Congress, https://portal.etsi.org/nfv/nfv white paper.pdf, Oct. 2012.
[3] R. Mijumbi, J. Serrat, J.-L. Gorricho, N. Bouten, F. D. Turck and R. Boutaba, “Network Function Virtualization: State-of-the-Art and Re- search Challenges,” IEEE Commu. Surveys and Tutorials, vol. 18, no. 1, pp. 236–262, First Quarter 2016.
[4] What is an NFV Data Center?, https://www.sdxcentral.com/nfv/
definitions/nfv-data-center-introduction, accessed on Aug. 1, 2017.
[5] AT&T, “Central Office Re-architected as Datacenter (CORD):
White Paper,” http://xosproject.org/wp-content/uploads/2015/04/
Whitepaper-CORD.pdf, June 2015.
[6] L. Peterson, A. Al-Shabibi, T. Anshutz, S. Baker, A. Bavier, S. Das, J. Hart, G. Palukar and W. Snow, “Central Office Re-architected as Datacenter,” IEEE Communications Magazine, vol. 54, issue 10, pp. 96–
101, Oct. 2016.
[7] J. Soares, C. Gonc¸alves, B. Parreira, P. Tavares, J. Carapinha, J. P. Barraca, R. L. Aguiar and S. Sargento, “Toward a Telco Cloud Environment for Service Functions,” IEEE Communications, vol. 53, issue 2, pp. 98-106, Feb. 2015.
[8] D. Krishnaswamy, R. Kothari and V. Gabale, “Latency and Policy Aware Hierarchical Partitioning for NFV Systems,” IEEE Conference on Network Function Virtualization and Software Defined Network (NFV- SDN), Nov. 2015.
[9] P. Wang, J. Lan, X. Zhang, Y. Hu and S. Chen, “Dynamic Function Composition for Network Service Chain: Model and Optimization,”
Computer Networks, vol. 92, part 2, pp. 408-418, Dec. 2015.
[10] M. C. Luizelli, L. R. Bays, L. S. Buriol, M. P. Barcellos, L. P. Gaspary,
“Piecing Together the NFV Provisioning Puzzle: Efficient Placement and Chaining of Virtual Network Functions,” IFIP/IEEE International Symposium on Integrated Network Management (IM), 2015.
[11] A. M. Medhat, G. Carella, C. L¨uck, M.-I. Corici and T. Magedanz, “Near Optimal Service Function Path Instantiation in a Multi-Datacenter Envi- ronment,” International Conference on Network and Service Management (CNSM), Nov. 2015.
[12] A. Gupta, M. F. Habib, P. Chowdhury, M. Tornatore and B. Mukherjee,
“On Service Chaining using Virtual Network Functions in Network- enabled Cloud Systems,” IEEE International Conference on Advanced Networks and Telecommunications Systems (ANTS), Dec. 2015.
[13] ETSI, “Network Functions Virtualisation (NFV); Infrastructure Overview,” ver 1.1.1, http://www.etsi.org/deliver/etsi gs/NFV-INF/001 099/001/01.01.01 60/gs NFV-INF001v010101p.pdf, Jan. 2015.
[14] ETSI, “Network Function Virtualisation (NFV); Use Cases,” ver.
1.2.1, http://www.etsi.org/deliver/etsi gr/NFV/001 099/001/01.02.01 60/
gr NFV001v010201p.pdf, May 2017.
[15] V. Nguyen, A. Brunstrom, K. Grinnemo and J. Taheri, “SDN/NFV-based Mobile Packet Core Network Architectures: A Survey,” IEEE Commu.
Surveys and Tutorials, to appear.
[16] J. G. Herrera and J. F. Botero, “Resource Allocation in NFV: A Comprehensive Survey,” IEEE Trans. Network and Service Management, vol. 13, no. 3, pp. 518–532, Sept. 2016.
[17] J. Chase, R. Kaewpuang, W. Yonggang and D. Niyato, “Joint Virtual Machine and Bandwidth Allocation in Software Defined Network (SDN) and Cloud Computing Environments,” IEEE International Conference on Communications (ICC), June 2014.
[18] A. Mohammadkhan, S. Ghapani, G. Liu, W. Zhang, K. K. Ramakrishnan and T. Wood, “Virtual Function Placement and Traffic Steering in Flexible and Dynamic Software Defined Networks,” IEEE International Workshop on Local and Metropolitan Area Networks (LANMAN), Apr. 2015.
[19] L. Qu, C. Assi and K. Shaban, “Delay-Aware Scheduling and Resource Optimization with Network Function Virtualization,” IEEE Trans. Com- munications, vol. 16, no. 9, pp. 3746–3758, Sept. 2016.
[20] L. Wang, Z. Lu, X. Wen, R. Knopp and R. Gupta, “Joint Optimization of Service Function Chaining and Resource Allocation in Network Function Virtualization,” IEEE Access, vol. 4, pp. 8084–8094, Nov. 2016.
[21] M. Abu-Lebdeh, D. Naboulsi, R. Glitho, C. W. Tchouati, “NFV Or- chestrator Placement for Geo-Distributed Systems,” 2017 IEEE 16th International Symposium on Network Computing and Applications, 2017.
[22] J. Garay, J. Matias, J. Unzilla, E. Jacob, “Service Description in the NFV Revolution: Trends, Challenges and A Way Forward,” IEEE Communications Magazine, vol. 54, no. 3, pp. 6874, March, 2016.
[23] ETSI, “Network Functions Virtualisation (NFV); Management and Or- chestration; Report on Architectural Options,” July, 2016.
[24] C. J. Bernardos, B. P. Ger, M. Di Girolamo, A. Kern, B. Martini, and I.
Vaishnavi, “5gex: realising a Europe-wide multi-domain framework for software-defined infrastructures,” Transactions on Emerging Telecommu- nications Technologies, vol. 27, no. 9, pp. 12711280, September, 2016.
CHIH-CHIANG WANG is an associate professor at National Kaohsiung University of Science and Technology in Taiwan. He received his Ph.D. from North Carolina State University in 2007. His re- search interests are in the general areas of distributed systems, network protocols, software-defined net- working, and wireless networks.
YING-DAR LIN is a distinguished professor at National Chiao Tung University (NCTU). He re- ceived his Ph.D. from UCLA in 1993. He was a visiting scholar at Cisco in 2007−2008. He directs the Network Benchmarking Lab (NBL), an approved lab of the Open Networking Foundation (ONF).
His work on ”multi-hop cellular“ has been highly cited and standardized. He is an IEEE Distinguished Lecturer, and ONF research associate, and serves on several editorial boards. He co-authored Computer Networks: An Open Source Approach (McGraw- Hill, 2011).
JANG-JIIN WU received his B.S. and M.S. degree in computer science and information engineering from National Chung Cheng University, Chia-Yi, Taiwan, in 1996 and 1998, respectively. In August 2001, he joined the National Yuan-Li Senior High School, Taiwan, as a teacher. He is currently pur- suing the Ph.D. degree at National Chung Cheng University, Taiwan.
PO-CHING LIN ([email protected]) received his Ph.D. degree in computer science from National Chiao Tung University, Hsinchu, Taiwan, in 2008.
He joined the faculty of the Department of Computer and Information Science, National Chung Cheng University, Taiwan, in August 2009. His research interests include network security, network traffic analysis, and performance evaluation of network systems.
Ren-Hung Hwang received his Ph.D. degree in computer science from University of Massachusetts, Amherst, Massachusetts, USA, in 1993. He joined the Department of Computer Science and Informa- tion Engineering, National Chung Cheng University, Chia-Yi, Taiwan, in 1993, where he is now the Dean of the College of Engineering and distinguished professor of the Department of Computer Science and Information Engineering. He is currently on the editorial boards of Journal of Information Science and Engineering and The Scientific World Journal (Computer Science area). He is also a co-author of the textbook ”Computer Networks: An Open Source Approach” (www.mhhe.com/lin), with Ying- Dar Lin and Fred Baker (McGraw-Hill, 2011). He received the IEEE Best Paper Award from IEEE IUCC 2014 and the IEEE Outstanding Paper Award from IEEE IC/ATC/ICA3PP 2012. He was the guest editor of IEEE Network, special issue on ”Open Source for Networking: Development and Experimentation,” IET Communications, special issue on WiMAX Integrated Communications and the program chair of International Symposium on Pervasive Systems, Algorithms, and Networks (ISPAN), 2009. His current research interest is in Internet of Things, Cloud Computing, and Software Defined Networks. Prof. Hwang is a senior member of IEEE.