A Study of Rainfall Changes and Thresholds of Extreme Rainfall Events in the Lienhuachih Area of Central Taiwan
Shiang-Yue Lu,
1)Ming-Yuan Sun,
2,3)Hui-Hsueh Huang
1)【 Summary】
Hydrological fluctuations tend to greatly vary, and rainfall characteristics have recently been significantly affected by influences of global warming worldwide. Rainfall changes and the occur- rence of extreme events have received more attention because of their great impacts on ecosystem operations, agricultural activities, and design of hydraulic structures. Rainfall types, regimes, and long-term changes, and thresholds of extreme events were analyzed for the Lienhuachih area in this study using rainfall records from April 1928 to December 2016. Rainfall is unevenly distrib- uted in the annual cycle with about 85.8% of amount and 68.8% of rainy days concentrated from April to September. Therefore, the wet season in the study area was defined as being from April to September rather than from May to October as in most other parts of Taiwan, owing to heavier spring rains. The Lienhuachih area has a mean annual rainfall of about 2409.0 mm and rainfall- days of about 144.6 d. An analysis of long-term rainfall changes showed a decreasing trend of about 28.0, 29.2, and 17.6 mm decade
-1, for the annual total, and wet and dry seasons, respectively.
Rainfall-days also showed a steadily decreasing trend of about 4.6, 2.3, and 2.4 d decade
-1for the annual total, and wet and dry seasons, respectively. Thresholds for extreme rainfall and drought were roughly 600 mm d
-1and 65 consecutive days of no rainfall, respectively, as estimated by quantities from the Extreme Value Type I frequency analysis of 50-yr return period. The decreasing trend for both rainfall amounts and rainfall-days and the more-frequent occurrence of extremely torrential rainfall indicate that rainfall will increasingly become temporally concentrated in the study area. This phenomenon may bring about greater difficulties for water resources management.
Key words: rainfall type, long-term change, threshold of extreme rainfall events, Lienhuachih.
Lu SY, Sun MY, Huang HH. 2018. A study of rainfall changes and thresholds of extreme rainfall events in the Lienhuachih area of central Taiwan. Taiwan J For Sci 33(4):251-62.
1)
Division of Watershed Management, Taiwan Forestry Research Institute, 53 Nanhai Rd., Taipei 10066, Taiwan. 林業試驗所集水區經營組,10066台北市南海路53號。
2)
Liukuei Research Center, Taiwan Forestry Research Institute, 198 Chung-Shing Village, Liukuei, Kaohsiung 84443, Taiwan. 林業試驗所六龜研究中心,84443高雄市六龜區中興村198號。
3)
Corresponding author, e-mail:smy@tfri.gov.tw 通訊作者。
Received November 2017, Accepted September 2018. 2017年11月送審 2018年9月通過。
研究報告
蓮華池地區降雨變遷及極端降雨事件門檻值之研究
陸象豫
1)孫銘源
2,3)黃惠雪
1)摘 要
近年來受到暖化的影響,世界各地水文事件的變動範圍日益擴大且降雨特性亦明顯的改變。由於 降雨量雨分布的變化與極端降雨事件對生態系運作、農業活動和水利工程構設計有顯著的影響,因此 格外受到關注。本報告藉由分析蓮華池地區1928年4月至2016年12月的降雨記錄,探討該地區的降雨 型態、時間分布、長期變化趨勢以及極端降雨事件閾值。蓮華池地區年平均降雨量約2409.0 mm,降 雨天數約為144.6天。由於在時間上分布相當不平均且春雨雨量較豐,致85.8%的年降雨量以及68.8%
的年降雨日數集中於4至9月;因此該地區的濕季訂為4至9月,而非台灣其他多數地區的5至10月。長 期的降雨變化分析顯示,蓮華池地區全年度、濕季及乾季降雨量均呈遞減趨勢,降幅每10年分別約為 28.0、29.2與 17.6 mm。降雨天數亦呈減少趨勢,全年度、濕季及乾季的降幅每10年分別約為4.6、2.3 與 2.4 天。以極端值一型分佈函數經頻率分析所求得50年回歸週期日降雨量及連續無降雨天數,作為 該地區極端降雨與極端乾旱的閾值,獲知該地區日降雨量需大於600 mm及連續65天無降雨方達到極端 降雨與乾旱的門檻。降雨量和降雨日數的減少趨勢以及超大豪雨事件越趨頻繁,顯示蓮華池地區降雨 在時間上分布日趨集中,此現象將使水資源經營管理日顯棘手。
關鍵詞:降雨型態、長期變遷、極端降雨閾值、蓮華池。
陸象豫、孫銘源、黃惠雪。2018。蓮華池地區降雨變遷及極端降雨事件門檻值之研究。台灣林業科學 33(4):251-62。
INTRODUCTION
Due to the impacts of global warming, abnormal weather phenomena around the world are occurring more frequently than they occurred in the past, and therefore the terms
“climate change” and “extreme weather” are often mentioned. Climate is a general term for the long-term average of meteorological phenomena in a region. Meteorology refers to the physical phenomena of a region’s atmo- spheric conditions, and is usually the amount or characteristic of physical factors such as air temperature, pressure, humidity, wind speed and direction, and solar radiation in the stratosphere. These factors constitute re- gional climate elements. The “average state”
of each meteorological factor is the mean of
the statistic, and the average temperature and rainfall are often used to describe the climatic pattern of a region. Extreme weather refers to phenomena of severe anomalies or rare occurrences of meteorological events. The magnitudes of these meteorological factors are extremely low or high or have never ap- peared in the historical records of a region and are inversely related to their occurrence.
Extreme weather events are generally based
on a region’s long-term weather records and
must be consistent with the definition of sta-
tistical extremes. Although there is no strict
definition of an extreme weather event, it is
generally considered to be in the highest and
lowest 2.5% range of historical records, or its
quantity is greater than the level of the 50-yr return period. To judge or study extreme cli- mate, one must have long-term and stable ob- servation data and then only can put forward convincing persuasion (Alexander et al. 2006, Katz 2010).
Hydrologic systems are sometimes im- pacted by extreme events, such as severe storms, floods, and droughts. Those impacts can have profound influences on almost all event series in our lives. In addition, char- acteristics of precipitation, i.e., the amount, type, and distribution in space and time, play important roles in ecosystem operations, agri- cultural activities, social structures, economic development, meteorological applications, and the design of hydraulic structures. There- fore, studies of regional precipitation and its changes are important for a variety of agricul- tural, hydrological, and meteorological appli- cations. Many studies have indicated that the regional heterogeneity in the amounts of pre- cipitation and magnitudes of temperature are significantly changing, and extreme events of both temperature and rainfall are occurring more frequently through the years in low- elevation areas of Taiwan, most likely due to the influences of global warming. In addition, consecutive days of no rainfall have also in- creased throughout the entire island, and this phenomenon combined with the frequently occurring extreme weather events have made water supply and watershed management more severe in Taiwan (Hsu and Chen 2002, Wang 2004, Wang et al. 2008). Hilly lands, which have elevations ranging 100~1000 m and occupy about three-tenths of the total area of Taiwan, are believed to be experienc- ing the same situations but with little study or direct evidence to prove that. Therefore, historical rainfall records of the Lienhuachih meteorological station, a typical meteorologi- cal station of hilly land in central Taiwan,
were examined to analyze the tendency of the magnitude of rainfall changes and thresholds of extreme rainfall and drought. Hopefully, the results will be useful for the effective management of water resources and ecosys- tems in the future.
MATERIALS AND METHODS Site description
The Lienhuachih area (Fig. 1) com- monly refers to the experimental forest of the Lienhuachih Research Center of the Taiwan Forestry Research Institute (TFRI) and its vicinity. Its blurred boundary is generally equivalent to that of Taomi Village which is about 600 ha in area and administrated by Yuchih Township. However, if we expand the scope of its area, the entire Shuili Creek watershed can also be considered as the Lien- huachih area. Elevations of the Lienhuachih area range 610~920 m. The main land use types are forests, orchards, betel nut planta- tions, tea plantations, and villages. There is a meteorological station managed by the TFRI located at the Lienhuachih Research Center at 120°54’E, 23°56’N and 744 m in eleva- tion. This station is classified as a second rank meteorological station for agricultural use.
Rainfall, air temperatures (including the daily average, maximum, and minimum tempera- tures), relative humidity, solar radiation, and wind velocity and direction are monitored (Lu et al. 2000). The yearly average temperature is about 21.0℃, and the average yearly total rainfall is about 2400 mm. Other climatic conditions can be referenced from Lu et al.
(2000).
Materials
Historical rainfall records of the Lien-
huachih station were used for an analysis of
the long-term tendency of change and fre-
quency in this study. Records of rainfall date back to April 1928. Records before 1993 were manual records monitored by a standard rain- fall gauge with resolution of 0.1 mm, because there were no automatic monitoring systems available at that time. For the manual records, daily rainfall records were observed at 09:00 each day. Automatic records were monitored by a tipping bucket rain-gauge with a resolu- tion of 0.5 mm, and the daily rainfall is the total rainfall amount within a day (0:00 to 24:00). Different measurement resolutions will not influence measured rainfall amounts because it is believed that loss to evaporation
in the bucket and that in the standard rainfall gauge did not significantly differ.
Long-term change analysis
In dealing with seasonal rainfall varia-
tions, annual records were divided into wet
and dry seasons, because on the long-term av-
erage about 79% of precipitation falls within
the wet season in Taiwan (WRA 2002). If the
rainfall amount exceeded 0.1 mm d
-1, then
that day was considered a rainy day, and the
number of rainy days in each month was cal-
culated. The monthly average rainfall, rain-
fall-days, and the average of the entire dataset
Fig. 1. Location of the Lienhuachih area.
were calculated. Departure was considered the difference in the yearly amount (rainfall and rainfall-days) with the average of the en- tire dataset. Departure diagrams (annual, wet season, and dry season rainfall and rainfall- days) were drawn to compare pattern shifts and differences to illustrate changes through time for both rainfall and rainfall-days.
Frequency analysis
In determining threshold quantities of extreme rainfall and consecutive days of no rainfall for drought, the Extreme Value Type I (EVI) probability distribution function was used in this study. The EVI distribution is often used as an approximation to model the maxima of long (finite) sequences of random variables.
Extreme values of hydrologic variables are of interest for frequency analyses, and also storm rainfalls are most commonly modeled using this distribution function (Tomlinson 1980).
The probability function is:
F(x) = exp{-exp[-(x - μ) /α]};
where F(x) is the accumulative probabil- ity for variable x,
α = 6
0.5s / π = 0.7796 s, and μ = Ave(x) - 0.5572α, with s as the standard deviation (SD).
The magnitude of X
Tof a hydrologic event for a different return period (T) can be esti- mated by
X
T= μ + αy
T,
with y
T= -ln[ln(T/(T - 1))].
The first step in studying extreme hydro- logic events involves selecting a sequence of the largest or smallest observations from a da- taset. In this study, the annual maximum 24-h rainfall and the annual driest period were established by selecting the largest rainfall amounts and the greatest number of consecu- tive days with no rainfall in each year from historical records. Then the means, SDs, fre- quency factors (factors used in the frequency
analysis which are functions of the return pe- riod and the type of probability distribution), and other parameters were calculated from the equations described above (Chow 1953, Lu 2016).
RESULTS
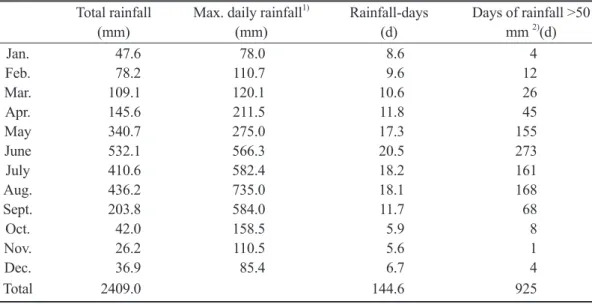
Rainfall characteristics and regimes The average monthly rainfall, the record- ed maximum daily rainfall, rainfall-days, and number of days which had daily rainfall ex- ceeding 50 mm are tabulated in Table 1. It can be noted that rainfall in October is relatively low and in April is relative high compared to values in other parts of Taiwan (Lu et al.
2000, Chen and Chen 2003). About 85.9% of the annual rainfall, 67.5% of rainy days, and 94.1% of days with daily rainfall exceeding 50 mm were concentrated from April to Sep- tember. Therefore, we defined the wet season in the study area as occurring from April to September rather than from May to October as it is generally defined in Taiwan (Wang 2004, Lu 2016). This kind of temporal distri- bution is related to the rainfall mechanism in spring, the presence of southwesterly flow in higher elevations, the cold, dry northeasterly flow in low elevations, and the effects of the spring transition and barrier effects of the Central Mountain Range.
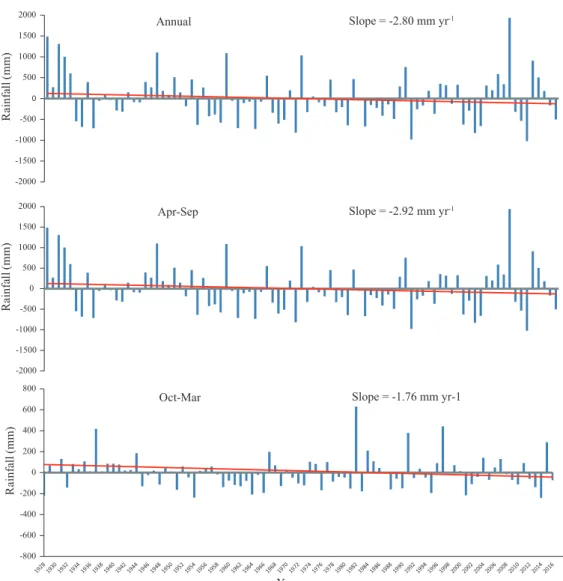
Analysis of long-term changes in rainfall
Long-term changes in rainfall and
rainfall-days from 1928 to 2016 in the Lien-
huachih area are shown in Figs. 2 and 3,
respectively. Departure diagrams of rainfall
amounts showed a declining tendency for
annual, wet-season, and dry-season values
during the study period. Rainfall amounts
showed great fluctuations from year to year
(annual rainfall ranged 1410.0~4302.5 mm,
that in the wet season ranged 1043.0~4002.0
mm, and that in the dry season ranged 97.5~969.7 mm) with a decreasing tendency of about 28.0, 29.2, and 1.7 mm decade
-1, for the annual, and wet and dry seasons, respec- tively. A greater decline in the rainfall amount was found in the wet season, while there was only a minor decrease in the dry season, and the decline in the annual rainfall amount was attributed to the significant decrease in quan- tity in the wet season.
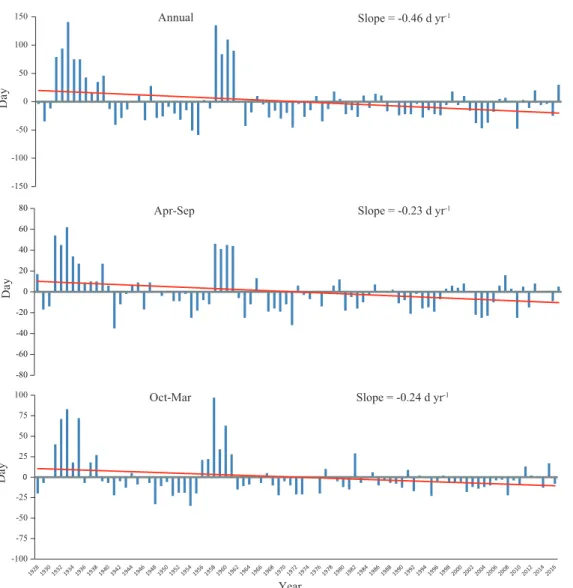
The Lienhuachih area has a mean annual value of 145 rainfall-days for the past 89 yr with great variations ranging from 286 (in 1993) to 86 d (in 1995), a difference of more than half a year. Long-term changes in rain- fall-days showed a steadily decreasing tend in the Lienhuachih area. Annual rainfall-days showed the largest declining rate (slope = -0.46 d yr
-1), where rainy days in the wet sea- son showed the least reduction (slope = -0.23 d yr
-1). It was noted that rainfall-days showed 2 peaks in the 1930s and 1950s. It is difficult to explain the reason for the appearance of these 2 peaks, and reasons for the decrease
in rainfall-days are complicated and unclear.
Most scientists ascribe this phenomenon to global warming, aerosols, and sand storms (Liu et al. 2002).
The threshold of extreme rainfall amounts Following the procedures of the EVI frequency analysis, the estimated quantities of daily rainfall for the 2-, 5-, 10-, 50-, and 100-year return periods were 209.5, 337.4, 422.1, 608.6, and 687.4 mm, respectively.
From the definition of extreme rainfall, 24-h or daily rainfall must exceed 600 mm before it can be identified as an extreme rainfall event in the Lienhuachih area. However, the threshold of extreme rainfall is a blurred value and changes from region to region.
The estimated threshold is relatively high compared to that in most other places in the world, but this illustrates that Taiwan is an area with abundant rainfall.
There were 6 rainfall events which reached the extreme rainfall threshold in recorded history in the Lienhuachih area.
Table 1. Average monthly rainfall and rainy days in the Lienhuachih area (1928~2016) Total rainfall Max. daily rainfall
1)Rainfall-days Days of rainfall >50
(mm) (mm) (d) mm
2)(d)
Jan. 47.6 78.0 8.6 4
Feb. 78.2 110.7 9.6 12
Mar. 109.1 120.1 10.6 26
Apr. 145.6 211.5 11.8 45
May 340.7 275.0 17.3 155
June 532.1 566.3 20.5 273
July 410.6 582.4 18.2 161
Aug. 436.2 735.0 18.1 168
Sept. 203.8 584.0 11.7 68
Oct. 42.0 158.5 5.9 8
Nov. 26.2 110.5 5.6 1
Dec. 36.9 85.4 6.7 4
Total 2409.0 144.6 925
1
The maximum daily rainfall in historical records.
2
Total days of daily rainfall exceeding 30 mm in historical records.
0
-2000 -1500 -1000 -500 500 1000 1500 2000
R ai nf al l ( m m )
Annual Slope = -2.80 mm yr
-1-2000 -1500 -1000 -500 0 500 1000 1500 2000
R ai nf al l ( m m )
Apr-Sep Slope = -2.92 mm yr
-1-800 -600 -400 -200 0 200 400 600 800
R ai nf al l ( m m )
Year
Oct-Mar Slope = -1.76 mm yr-1
Fig. 2. Long-term linear trends of rainfall amounts for the Lienhuachih area.
They occurred on 14 June 1976, 19 August 1990, 31 July to 1 August 1996, 3 to 4 July 2004, 14 to 15 September 2008, and 8 to 9 August 2009 and all occurred during periods when typhoons were hitting Taiwan. There are 22 rainfall events which can be classified as extremely torrential rain in the historical records. It was found that the occurrence of torrential rains was more frequent after 2004 as shown in Fig 4. This phenomenon indi- cates that the frequency of heavy rainfall has recently increased.
The threshold of extreme drought events
When determining the longest period
of consecutive days of no rainfall, the hy-
drological year was selected to run from No-
vember to September of the following year,
by considering that it may occur in a period
that occurs in 2 calendar years. In addition,
the threshold amount for rainy days was se-
lected as rainfall amount exceeding 0.5 mm
in a day, not only because this quantity would
have no contribution to streamflow (Lu and
Tang 1995) but also for consistency with the
record’s resolution. The average consecutive days of no rainfall in historical records of the Lienhuachih area was 35.0 d with a range of 16~86 d. The most and fewest consecutive days of no rainfall amount exceeding 0.5 mm occurred in 1948 and 1938, respectively.
If consecutive no-rainfall days followed the EVI distribution, then the estimated quantities of consecutive days without rainfall for the 2-, 5-, 10-, 25-, 50-, and 100-year return periods would be 38.3, 48.7, 55.5, 64.2, 70.6, and 77.0 d, respectively. The
extreme drought threshold estimated by the 50-yr return period from the EVI distribution was about 70 d. If we considered that the distribution of consecutive days with no rainfall followed a normal distribution, the estimated threshold would be about 65 d.
DISCUSSION Rainfall characteristics
Rainfall mechanisms in the Lienhuachih area can roughly be classified as frontal rain,
Slope = -0.46 d yr
-1-150 -100 -50 0 50 100 150
D ay
Annual
0
-100 -75 -50 -25 25 50 75 100
D ay
Year
Oct-Mar Slope = -0.24 d yr
-1-80 -60 -40 -20 0 20 40 60 80
D ay
Apr-Sep Slope = -0.23 d yr
-1Fig. 3. Long-term linear trends of rainfall-days for the Lienhuachih area.
thunderstorms, and typhoon rain. During the cold season (generally from October to April), the northeasterly monsoon brings sufficient moisture to cause small to moderate rainfall on upwind slopes of Taiwan. Rainfall in the cold season is generally caused by the northeasterly monsoon in this area. The northeast monsoon and high-altitude westerly flow are quite strong in the region of South China to Taiwan in spring, and is prone to creating tangential cyclone winds, and rainfall areas mostly occur on the southern edge of the wind tangent line. The edge of the wind tangent line is close to central Taiwan, and with the presence of southwesterly flow at the 850-hpa level and the relative cold, dry northeasterly flow at lower levels, it generally brings more rains in the early spring and causes more rains in April on the western slopes of central Taiwan. April is also the time of the spring transition when rainfall gradually changes from stable precipitation to convective-type precipitation, and rainfall is unevenly distributed over Taiwan (Chen and Chen 2003). In addition of the Lienhuachih area having high monthly rainfall in April,
the nearby Sun Moon Lake station managed by the Central Weather Bureau (CWB) also has high monthly rainfall in April (185.9 mm, average of records in 2009~2017). However, the Wuchi station also managed by the CWB on the central Taiwanese coast has a monthly rainfall of 106.5 mm (average in 2009~2017) which is relatively low compared to that of slope areas. These facts indicate that rainfall in April on the western slopes of central Taiwan is relatively high.
During the mei-yu (plum rain) season (frontal rainfall that typically occurs between May and June), frontal systems occurring in South China, the East China Sea, and Taiwan bring heavy rainfall to the entire island in- cluding the study area. Mei-yu rainfall, which on average contributes more than 25% of the annual rainfall, is a major source of rainfall in this area. During hot weather throughout Taiwan after the mei-yu season, thunder- storms are prone to occur in summer due to strong afternoon convection. The number of thunderstorms achieves an annual peak dur- ing the period from June to August. A short duration, small scale, and high intensity are Fig. 4. The number of times the 24-h rainfall amount exceeded 200 mm in the Lienhuachih area.
0 1 2 3 4 5 6
1929 1930 1931 1932 1934 1941 1942 1947 1953 1956 1959 1963 1965 1966 1967 1970 1971 1972 1976 1977 1980 1981 1989 1990 1992 1994 1996 2001 2004 2005 2006 2007 2008 2009 2012 2013 2014