行政院國家科學委員會專題研究計畫 期中進度報告
建築排水通氣設備系統性能評估與試驗方法之研究(1/2)
計畫類別: 個別型計畫
計畫編號: NSC91-2211-E-011-050-
執行期間: 91 年 08 月 01 日至 92 年 07 月 31 日 執行單位: 國立臺灣科技大學建築系
計畫主持人: 鄭政利
報告類型: 精簡報告
處理方式: 本計畫可公開查詢
中 華 民 國 92 年 7 月 2 日
中文摘要
建築物的排水通氣設備系統,最重要的功能在於使排水管內藉著重力作用而自然 流下的污水、雜排水或污物,能順利無障礙地搬送排除到戶外或進入外部環境排 水系統。目前全世界在建築設計上,絕大多數是以重力式自然流下之排水系統做 為建築物之排水設計。重力式排水系統在建築設計上,由於必須是開放的回路系 統,最令人擔憂的就是衛生方面之問題。排水設備必須能夠有阻絕臭氣與衛生害 蟲機能,存水彎則是阻絕排水管路系統臭氣及害蟲侵入室內的衛生確保機制,而 為了緩和管內空氣壓力變動使排水管路排水順暢,也同時確保存水彎封水不產生 破封現象的衛生機能,通氣管路系統是排水設備整體系統中不可分割的一部份。
本研究之目的在於分別探討國內建築排水通氣設備系統本土性問題,檢討既有建 築排水通氣設備設計方法之要點,從國內外既有研究文獻與相關規範比較中,整 理建築排水設備系統之規劃設計要點與計算評估方法,同時建立本土化可行之建 築排水設備系統性能試驗方法。目前已經完成設定之預期成果,針對國內現況檢 討排水設備系統實務現況問題之解決對策,建立建築垂直立管管內空氣壓力預測 模式,進行實體模型實驗驗證與探討。
關鍵詞:建築排水系統,公寓式集合住宅,存水彎,水封
Abstr act
An aspect of the pressure fluctuations control in the vertical drainage stack was identified to be important for the insurance of drainage sanitary performance during early empirical studies. It was indicated that chaos plumbing and over-design are familiar to the utility services within the building envelope from a domestic investigation. Considerable progress has been made in predicting the air pressure distribution within vertical drainage stack currently. Following the previous research, this paper focuses on an empirical approach to the prediction method of vertical drainage stack, thus an experimental device which can simulate the middle-height apartment was set up for endowing the empirical parameters and model verification.
As the results, the verification from comparison between measured data and calculation values reveals that the prediction model can approximately reproduce the mean value of air pressure distribution in vertical drainage stack within the conditions of single point discharge and steady flow.
Keywords: building drainage system, apartment house, trap, seal water
1. Intr oduction
Insurance of sanitary performance is a prerequisite to the design of drainage network and plumbing system within the building properties. The mechanism of drainage through-flow and the simultaneous air pressure fluctuations in vertical drainage stack would destroy the seal water in trap and cause many sanitary problems of building drainage network. Therefore, an aspect of the pressure fluctuations control in the vertical drainage stack was identified to be important for the insurance of drainage sanitary performance. Industries and commercial builders have made excellent progress and achievements in building science and equipment system, but progress among drainage system which is dominated by gravity has been extremely slow, due to the complication of triple phase flow feature with incorporated solid, liquid and air. In our last presentation 2002, a domestic investigation was conducted to a comprehensives that vertical drainage stack pipe is almost designed as 2 or more pipes building drainage types, and the relief vent and vent stack type has been most widely used as the drainage system for apartment houses of middle-high stories.
Owing to the lack of information and insufficient understanding about water drainage system, chaos plumbing and over-design are familiar to the utility services within the building envelope.
Considerable progress has been made in predicting the air pressure distribution within vertical drainage stack currently. Following the previous research, this paper focuses on an empirical approach to the prediction method of vertical drainage stack, thus an experimental device which can simulate the middle-height apartment was set for endowing the empirical parameters and model verification. Meanwhile, the mechanism of vertical drainage flow and methodology of prediction model will firstly be described and illustrated schematically in this paper, then experimental results and verification will also be stressed on for a hypothesis appliance discharges to drain with conditions of single point discharge and steady flow.
2. Mechanism of Ver tical Dr ainage Flow
Appliance discharges to a vertical stack of drain may be described as unsteady or time dependent flow, and the form of the appliance discharge flow contributes to this flow condition. An actual discharge of vertical drainage stack has a complex phenomenon and may consist of water, air and solids. Airflow in the drainage stack is promoted by mixing as well as the friction with the falling water. This phenomenon causes the negative pressure on the upper floors and the positive pressure on the lower floors in the building.
According to the previous researches, the airflow rate (Qa) can be a critical parameter for a prediction model as describing the phenomenon of vertical drainage
flow. Therefore, the airflow performance in stack is the dominated issue and it needs to be solved. Hence while air flow rate is dominant in the vertical drainage stack it plays a critical role in the subsequent operation of vertical drainage stack where the mechanism may be assumed to be a quasi-fan machine, thus the laws of fan can be introduced to link with the vertical drainage flow. The laws of a fan can be expressed by the hydraulic parameters such as air density, pressure, velocity, gravity, resistance coefficient, lift, and et al. The operation energy for airflow in fan is mainly with electric power, thus potential energy of height is the dominating power for conducting the airflow in stack. This antithesis mechanism can be expressed as fan theory, namely the initial model of vertical drainage flow was conducted from the lows of fan machine alike.
The mechanism of flow within vertical drainage is now understood. Air pressure in stack is caused by series interactions between downstream water and air in vertical pipe. Fig.1 illustrates the image of flow state and the modified interaction, thus it conducts the main parameters with air pressure, airflow rate, and resistance coefficients.
Fig.1 Mechanism of vertical drainage feature and inverted model
3. Theor etical Reviews
The guideline of National Plumbing Code (NPC) of US was used to set the permit flow rate as the regulation of drainage system. Following initial work of the HASS 203 of Japan in 1970s, the method of steady flow condition emerged as the provision reference and evaluation technique, hence it conducted a series researches of steady flow method with reference to drainage stack. Consequently, a prediction model about the air pressure distribution, which occurred in the drainage stack by high-rise experiment tower (108m) and middle-high experiment tower (30m), was developed in Japan from 1990.
According to the theoretical reviews, they divided the profile of drainage stack into four zones, as shown in the following diagram Fig.2, and each zone is individually modeled due to the corresponding characteristics. Meanwhile, the air pressure distribution, which reveals the time average air pressure data with steady flow condition, does not involve the instantaneous air pressure fluctuation in vertical drainage flow. Consequently, the features of each zone may be described as the following.
A zone
B zone
C zone
D zone
FL
PB PAPD
Negative pressure Positive pressure
Peak negative pressure
Discharge height
Negative pressure
Positive pressure
Atmospheric pressure
L
Ventilation stack with no water
Inlet of discharge, accelerating range
Falling water with constant velocity
Main horizontal pipe, hydraulic range
Drainage stack
Fig. 2 Profile of air pressure distribution zones in drainage stack[1]
(1) A zone
This zone is located at the upstream part of the stack vent from the discharge entry, and thus consists of only airflow. This allows us to employ the following air duct model with a constant drag coefficient îA to calculate the air pressure PA of A zone.
PA = ξA× (γ÷ (2g)) × Va2 … … … … (1) (2) B zone
B zone is from the discharge entry to the downstream point where air pressure recovered after it reached its negative peak. According to the mechanism of fan machine, we can also employ the air duct model with a constant drag coefficient îB to calculate the air pressure PB of B zone, thus the function is expressed in equation (2).
PB = ξB× (γ÷ (2g)) × Va2 … ...(2)
The previous researches indicated that drag coefficient îB of air duct model in equation (2) is not likely to be constant due to the air flow rate in some extremely range. As the hydraulics observation, it is inherently with accelerating and decelerating performance and almost in same phase with complicated interaction.
However, the drag coefficient îBmay be calculated as an independent parameter with direct ratio to water flow rate in general discharge condition, and the calculation deviation is still acceptable. Herein, a new parameter L, i.e. length scale of the B zone, was conducted to modify the perdition model of B zone. It was identified that îB and L are both dependent on the stack air flow Qa or Va . Therefore, the function of pressure PB is expressed as the following equation (3). Inversely, parameter L can be determined from equation (3) due to the calculation of PB by equation (2).
PB = C × L0.7 … ...(3)
(3) C zone
Similar to the laws of fan machine, the variation of air pressure in stack is conducted by the transformation with potential energy of height to kinetic energy. The downstream water flow drags the airflow of stack and the interaction reveals the air pressure variation. The modification of this interaction is shown in Fig.1 and airflow in C zone gains energy as a form of static pressure increment through decelerating work against falling water. Constant positive pressure gradient toward downstream direction means constant momentum transfer from the falling water to the airflow.
According to the early empirical work, it was assumed that the frictional force acting on the water surface to be proportional to the square of the bulk velocity difference between water and air, the square root of constant pressure gradient CB in this zone, thus it should be expressed in terms of a linear equation of air flow rate as in equation (4) with two empirical constants of á and â, that is what we call two parameters method.
CB = ΔP ÷ ΔH = α2 × (β - Qa ) 2 … ...(4) As a practical performance, two parameters method, which has a crtical procedure in determining the empirical constant for each application system, is
sometimes unavailable for optimisation. Owing to the sequential feature of air pressure distribution in vertical drainage stack, a geometrical relation among these parameters is indified as shown in Fig.3.
Po PI
Fig.3 Model of air pressure prediction method in drainage stack
Thus we can express the constant pressure gradient CB by the equation (5) as below;
CB = ΔP ÷ ΔH = ( PA + PD ) ÷ ( FL – L ) = ( Po ) ÷ ( FL – L )… (5) (4) D zone
Owing to the hydraulic jump at the connection of stack pipe and drainage pipe, D zone works as air resistance as A zone does. Hence, the following equation with the constant drag coefficient îD is appropriate to calculate air pressure PD.
PD = ξD× (γ÷ (2g)) × Va2
… ...(2)
Therefore, it is demonstrated that the stack airflow rate Qa plays a key role to the air pressure distribution of a drainage stack system. It conducts a method to calculate air pressure profile of each zone in figure 4 as a function of Qa or Va, and to assemble them to introduce the whole pressure distribution. As a prediction model, however, this prediction method is not completely theoretical solution but semi-empirical approach with the experimental parameters. The following contents will verify the designed calculation scheme can be successfully applied to middle-high buildings.
4.Exper iment and Initial Results
In order to conduct a calculation system and verify the prediction model, this research following the previous study performed an experiment upon a full-scale drainage experimental tower. As an empirical approach the experiment tower, which belongs to the National Taiwan University of Science and Technology in Taipei and is adhered to a real building of around 39 m height, can simulate a drainage system within a middle-height apartment of 12 floor.
Fig.4 Layout and view of this middle-high experiment tower
The detail introduction of this experiment device was presented in our previous paper 2002 and Fig.4 shows the layout and image of this experiment tower. Herein, the data series of averaged air pressure distribution took 40 seconds for each measurement with 10ms of sampling time, and the central 20 seconds samples with 2000 data are adopted for the average air pressure performance.
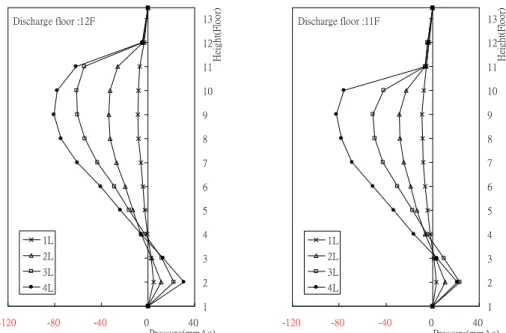
The initial experimental results, which discharged from 9F to 12F with conditions of water flow rate 1.0 l/s to 4.0 l/s, are shown in Fig. 5-8. They show the elementary results of air pressure distribution in drainage stack with condition of single-point and steady discharge. These figures reveal that the value of negative air pressure distribution conduct a direct ratio with the height of water discharge floor and water flow rate.
Fig. 5 Average air pressure distribution (discharge floor: 12F, 1.0 ~ 4.0 l/s)
Fig. 6 Average air pressure distribution (discharge floor: 11F, 1.0 ~ 4.0 l/s)
Fig. 7 Average air pressure distribution (discharge floor: 10F, 1.0 ~ 4.0 l/s)
Fig. 8 Average air pressure distribution (discharge floor: 9F, 1.0 ~ 4.0 l/s)
5. Ver ification: Repr oduction of Exper iment Data
Following the previous research, the experiment device was set up to simulate a middle-height apartment house with 12 floors height, and then performed a single-point discharge under steady flow condition. Parallel laboratory observations involved noting the maximum and minimum air pressure fluctuation, hence the pressure variety in drainage stack upon discharge of 2.0 l/s would frequently over the regulated value and may possible destroy the seal water in trap. Owing to the limited condition of experiment device, 28 testing patterns of water discharge included the
Discharge floor :12F
1 2 3 4 5 6 7 8 9 10 11 12 13
-120 -80 -40 0 40
Pressure(mmAq)
Height(Floor)
1L 2L 3L 4L
Discharge floor :11F
1 2 3 4 5 6 7 8 9 10 11 12 13
-120 -80 -40 0 40
Pressure(mmAq)
Height(Floor)
1L 2L 3L 4L
Discharge floor :10F
1 2 3 4 5 6 7 8 9 10 11 12 13
-120 -80 -40 0 40
Pressure(mmAq)
Height(Floor)
1L 2L 3L 4L
Discharge floor :9F
1 2 3 4 5 6 7 8 9 10 11 12 13
-120 -80 -40 0 40
Pressure(mmAq)
Height(Floor)
1L 2L 3L 4L
varieties of discharge height from 6F to 12F and water flow rate from 1.0 to 4.0 l/s were performed. Verification from comparison of measured data and calculation results are shown in Fig 8-11. These figures indicate that the calculation results can approximately reproduce the experiment data. It reveals that the model is reliable for these water drainage patterns and can apply to others alike under the same condition.
12FL 4L~1L
1 2 3 4 5 6 7 8 9 10 11 12 13
-120 -80 -40 0 40
Pressure(mmAq)
Height(floor)
Calculated pressure Measured pressure 3C
11FL 4L~1L
1 2 3 4 5 6 7 8 9 10 11 12 13
-120 -80 -40 0 40
Pressure(mmAq)
Height(floor)
Calculated pressure Measured pressure 3C
Fig.8 comparison profile (discharge from 12F) Fig.9 comparison profile (discharge from 11F)
10FL 4L~1L
1 2 3 4 5 6 7 8 9 10 11 12 13
-120 -80 -40 0 40
Pressure(mmAq)
Height(floor)
Calculated pressure Measured pressure 3C
09FL 4L~1L
1 2 3 4 5 6 7 8 9 10 11 12 13
-120 -80 -40 0 40
Pressure(mmAq)
Height(floor)
Calculated pressure Measured pressure 3C
Fig.10 comparison profile (discharge from 10F)
Fig.11 comparison profile (discharge from 9F)
6. Conclusions
Airflow in the drainage stack is promoted by mixing as well as the friction with the falling water. This phenomenon which causes the negative pressure on the upper floors and the positive pressure on the lower floors in the building was identified by empirical work. The pressure variety in drainage stack would destroy the seal water in trap and cause many sanitary problems of building drainage system. This research focuses on the feature of vertical drainage flow which is a complicate interaction phenomenon and describes it as a mechanism of fan machine alike, hence a prediction
model was developed and verified in this research. The prediction model based empirical parameters is essential study however offers a reference to drainage system designers at keeping the function of trap. As the results, the verification from comparison between measured data and calculation values reveals that the prediction model can approximately reproduce the mean value of air pressure distribution in vertical drainage stack within the conditions of single point discharge and steady flow.
The importance of trap function within building drainage system has been confirmed during early researches. Meanwhile, more related studies included appliance discharges with unsteady flow and multiple points of water discharge need to be conducted for linking to building regulation.
Nomenclatur e
PA pressure of A zone PB pressure of B zone PD pressure of D zone
PO pressure of outside interaction (=PA+PD)
PI initial total pressure of drainage stack (=PA+PB +PD)
γ specific weight of air(kgf/m3)
Va velocity of air flow at stack vent (m/s) Qa air flow rate in stack vent (m3/s)
Qw water flow rate (V/s)
ξA drag coefficient of A zone ξB drag coefficient of B zone ξD drag coefficient of D Zone
CB constant pressure gradient (mmAq/m) αβ empirical constant of constant pressure
gradient in C zone
g acceleration of gravity (m/s2) FL Discharge floor height (m) L Length scale of the B zone (m) CL Constant of L
期中進度報告與成果自評
本研究計畫第一年期,已經完成設定之預期成果,針對國內現況檢討排水 設備系統實務現況問題之解決對策,建立建築垂直立管管內空氣壓力預測模式,
進行實體模型實驗驗證與探討,並彙整相關研究成果發表於國內外學術期刊及研 討會。本研究成果於學術論文期刊及學術研討會發表情況如下:
1. Lu Wen-Hung, CHENG Cheng-li, Chou Yen-Chun, 2002, Investigation and Development Analysis of Building Drainage System for Apartment House, CIB-W62 International Symposium, Iasi, Romania. (已發表)
2. 呂文弘(生)、鄭政利、杜功仁(同僚)、周衍均(生),2003,「集合住宅排
水通氣系統現況調查與發展課題之分析」,建築學報,中華民國建築學會,(投
稿審查中)
3. W.H. Lu, C.L. Cheng, M.D. Shen, K.C. Tu,, 2003.09.;" Prediction Method of Air Pressure Distribution on Vertical Drainage Stack for Apartment House ", CIB-W62 International Symposium, Ankara, Turkey. (預定發表)
![Fig. 2 Profile of air pressure distribution zones in drainage stack [1]](https://thumb-ap.123doks.com/thumbv2/9libinfo/9126959.411215/5.893.178.698.605.930/fig-profile-air-pressure-distribution-zones-drainage-stack.webp)