ELSEVIER Psychiatry Research 62 (1996) 239-250
PSYCHIATRY RESEARCH
Excess mortality of psychiatric inpatients in Taiwan
Wei J. Chen*“, Yu-Jing Huanga, Ling-Ling Yehb, Hsien Rinb, Hai-Gwo Hwub
aInsIitute OJ Epidemiology, College of Public Health, National Taiwan University, I, Jen-Ai Road, Section I, Taipei 10016, Taiwan bDepartm ent of Psychiatry, College of Medicine, National Taiwan University, Taipei. Taiwan
Received 11 July 1995; revised 2 January 1996; accepted 10 Fehruary 1996
Abstract
The 6-year mortality rate of a nation-wide cohort of Taiwanese psychiatric inpatients admitted during the l-year period from 1987 to 1988 was examined via record linkage. The psychiatric care system in Taiwan is mainly hospital- based. Of the 13 385 patients studied (9309 men and 4076 women). 2039 (1720 men and 319 women) had died by the end of 1993. The standardized mortality ratio (SMR) in this sample (3.10 for men and 4.83 for women) was as high as those reported in western industrialized countries during the pre-deinstitutionalization era. We also examined the relationship between the excess mortality of patients and age, sex, causes of death, diagnostic categories. and length of hospital stay. In general, the SMR was greatest for the youngest age group. women, unnatural deaths, substance use disorders, and in the first year after admission. Although the main cause for the excess mortality was unnatural deaths, there was also an excess mortality due to natural causes across all diagnostic categories. Several recommenda- tions for the improvement of psychiatric care in Taiwan are made on the basis of these findings.
Keywords: Affective disorders; Organic mental disorders; Schizophrenia; Standardized mortality ratio; Substance use disorders
1. Introduction
Psychiatric inpatients have been known to have an increased mortality rate as compared with the general population ever since Farr (1841) found that the mortality rate of lunatics in British asylums was six to seven times that of the general population. Before the introduction of psycho- tropic medications, the major causes of excess deaths among psychiatric inpatients were infec-
* Corresponding author, Tel.: 886-2-397-0800, ext 8360, Fax:
886-2-356-0840.
tions due to poor hygiene and overcrowding in large institutions (Qdegird, 195 1; Malzberg, 1953;
Tokuhata and Stehman. 1958; Giel et al., 1978). In the post-drug era, the mortality ratio of psychiatric inpatients to the general population has declined steadily to a level less than 3 (Craig and Lin, 198lb). The major causes of excess deaths have also changed from infectious diseases to unnatural causes, such as suicide and accidents. Despite notable improvements, the mortality of psychiatric inpatients is still higher than that of the general population (Sims, 1987).
These trends showing a decline in the excess
0165-1781/96/%15.00 0 1996 Elsevier Science Ireland Ltd. All rights reserved PII: SO165-1781(96)02875-2
240 W.J. Chen et al. /Psychiatry Research 62 (1996) 239-250
mortality of psychiatric inpatients come mainly from studies conducted in Northern Europe or North America, and it is possible that changes in the psychiatric care systems in these countries might have contributed to this trend. For example, during the 1970s the number of inpatients in large public mental hospitals in the United States and England declined rapidly due to the process of deinstitutionalization. The effects of deinstitu- tionalization were seen in consistent reductions in mortality rates, especially among elderly patient populations (Craig and Lin, 198la). Thus the mor- tality of psychiatric inpatients in part reflects the nature of psychiatric care (Tsuang and Simpson,
1985; Sims, 1987).
In Taiwan, the psychiatric care system has tradi- tionally been hospital-based (Yeh, 1992).
Community-based psychiatric care in Taiwan is still in its infancy. The system has long suffered from a shortage of manpower and inpatient facilities. For example, in Taiwan in 1983 there was approximately one psychiatrist per 100 000 people, which was lower than the live in Japan and ten in the United States (Rin, 1983). The total number of psychiatric beds in Taiwan increased by only 10% in a recent 8-year period (from 11 066 in 1985 to 12 201 in 1993) (Hwu et al., 1995). On average, there were 6.1 psychiatric beds per 10 000 people and most of these psychiatric beds were oc- cupied by chronic patients. Thus, deinstitu- tionalization has not occurred in Taiwan in any sense. Although the 1990 Mental Health Act recommended that more resources be allocated for psychiatric care and more emphasis be placed on a community-based care system, this has not been fully accomplished. An assessment of the mortality rate of the psychiatric inpatient population as a reference indicator for substantiation of the benefits of the Mental Health Act is consequently worthwhile.
This study reports on mortality among a Taiwan-wide cohort of psychiatric inpatients ad- mitted during the l-year period from 1987 to 1988.
As every Taiwanese citizen has a unique national identification number (ID), mortality registration is obligatory, and migration from the island is negligible, the mortality status of these patients can be accurately ascertained via record linkage.
We found that the mortality ratio of psychiatric inpatients to the general population in Taiwan was as high as those reported in western industrialized countries during the pre-deinstitutionalization era.
The interaction of many factors affecting the mor- tality rate of psychiatric inpatients is examined.
2. Methods
2.1. Study population
The subjects included in this study were derived from the Taiwan Inpatient Epidemiological Pro- ject (TIEP). The background and procedure of TIEP has been described in detail elsewhere (Hwu et al., 1995). In brief, any Taiwanese person who received inpatient treatment for mental illness at any time between October 1, 1987 and September 30, 1988 was enrolled in TIEP. Out of 58 psychiatric hospitals in Taiwan, only nine small hospitals did not participate in this project because of closure of inpatient service or refusal. The num- ber of beds provided by these nine hospitals was only 2.2% of the total number of beds in Taiwan in 1987. The number of patients enlisted in TIEP comprised about 88% of the annual capital num- ber of psychiatric inpatients reported to the Department of Health. Generally speaking, the capital number of patients reported to the Depart- ment of Health was inflated because of duplicate reports for patients who were admitted to more than one hospital and possible overreporting under the incentive of the subsidizing policy that was in effect during the study period. All of the 49 hospitals participating in TIEP were requested to complete a data sheet for each patient with infor- mation regarding his/her demographic status and clinical features (including diagnosis, treatment history, family history, age at onset).
The inter-rater reliability of the recorded data has been assessed in a smaller sample (30 for inci- dent patients and 40 for prevalent patients) (Hwu et al., 1995). For demographic data, kappas (for categorical variables) or intraclass coefficient reliabilities (for ordinal variables) were 10.70 for 96% of the questions on the data sheet. As to clini- cal data, the intraclass coefficient reliabilities of 12 ordinal questions were ~0.90, while kappas for
W.J. Chen et al. /Psychiatry Research 62 (19%) 239-250 241
96% of the remaining categorical questions were those admitted for the first time were separated
~0.70. In general, the reliability of the data col- from those admitted for relapse because of the lected is satisfactory. concern that their course might be different.
In total, there were 17 508 psychiatric inpatients treated during the l-year period of the TIEP. Be- cause national ID was not routinely recorded on admission to a psychiatric hospital during the study period, this information was missing for 3715 (21.2%) patients. The most common reason that a patient’s national ID number was not recorded was that the person who completed the admission paper work for the patient forgot to bring the patient’s national ID card. The absence of a national ID did not appear to be related to the patient’s clinical status. However, patients missing national ID were excluded from this mortality analysis because the ID was required during record-linkage. As there were only 197 patients aged less than 15 years, they were eliminated from analysis. Another 211 subjects were also excluded from analysis due to missing diagnosis. The final sample size used for this report was 13 385 patients.
Male patients formed 69.5% of the sample (Table 1). Compared with the age distribution of the general population in Taiwan, the proportion of those aged 15-24 years in the sample was lower than that of general population (26.6% for men and 27.0% for women), while the proportion of ages 65-79 years was higher than that of general population (7.3% for men and 7.0% for women).
The majority of both male and female patients were diagnosed with schizophrenia or paranoia (76.9% and 70.5%, respectively). Apart from this, male patients had a higher percentage of substance use disorders, while female patients had a higher percentage of affective disorders. Male patients tended to be older and had a longer length of inpatient stay than female patients.
Table 1
Age distribution and clinical status of psychiatric inpatients (n = 13 385) included in this study
A major diagnosis of each patient was provided by board-certitied psychiatrists at the hospitals participating in TIEP, and patients were classified according to ICD-9 (World Health Organization,
1978). However, the diagnostic concepts practiced in Taiwan were strongly influenced by the Diag- nostic and Statistical Manual of Mental Disorders-Third Edition (American Psychiatric Association, 1980) during the study period. Tak- ing into consideration the variability in diagnostic practice across hospitals, all diagnoses were grouped into live broad categories: schizophrenia or paranoia (including various subtypes of schizophrenia and paranoid states), affective dis- orders (including manic-depressive psychosis, major depression and neurotic depression), sub- stance use disorders (including alcohol or drug abuse/dependence), organic mental disorders (in- cluding dementia, mental retardation, epilepsy), and others (all remaining types).
Characteristics Men Women
(n = 9369) (n = 4076)
Age (years) 15-24 25-34 35-44 45-54 55-64 65-79
n % n %
1246 13.4 773 19.0
2349 25.2 1392 34.2
1626 17.5 996 24.4
945 10.2 560 13.7
1956 21.0 259 6.4
1187 12.8 96 2.4
Diagnostic group Schizophrenia or paranoia Affective disorders Substance use disorders Organic mental disorders Others
7163 76.9 2876 70.5
629 6.8 608 15.0
373 4.0 28 0.7
731 7.9 233 5.7
413 4.4 331 8.1
Each patient’s length of stay in hospital at the beginning of the study was calculated as the time interval between the date of admission for the cur- rent episode and their inclusion in the study. For patients whose length of stay was less than 1 year,
Length of stay (years)”
< 1 and first admission 1231 13.2 858 21.0
< I and readmission 2963 31.9 1948 47.8
l-5 1685 18.1 684 16.8
>5 3424 36.8 583 14.3
‘The length of stay of six men and three women could not be determined.
Gender differences in the distribution of age, diagnostic group, and length of stay: all Ps < 0.0001 (x2 test).
242 W.J. Chen er al. /Psychiatry Research 62 (19%) 239-250
In terms of type of psychiatric hospitals, 24.7%
of patients were admitted to public hospitals, 33.5% to public asylums, and 41.8% to private hos- pitals. The public hospitals were mainly for acute patients (80.8% were admitted for less than 1 year, 12.7% for between 1 and 5 years, and 6.6% more than 5 years), the public asylums were mainly for chronic patients (10.8% were admitted for less than 1 year, 27.9% between 1 and 5 years, and 74.3% more than 5 years), and private hospitals for those of intermediate duration of stay (68.4% were admitted for less than 1 year, 23.1% between 1 and 5 years, and 8.5% more than 5 years).
2.2. Mortality analysis
We searched for deceased subjects by matching national IDS with computerized data files from the Department of Health (Taiwan) Death Certitica- tion System issued for the years 1987- 1993. The mortality status ascertained in this way can be con- sidered to be complete and accurate for the follow- ing reasons. First, it is mandatory for local household registration offices to submit standar- dized certificates of each death to the Department of Health. Second, residents are required to regis- ter all birth, death, marriage, divorce, and migra- tion events with the household registration offices, and registered household information is annually checked through a home-visit interview by the registration office. Third, the record linkage is straightforward, as the Death Certification System uses the national ID number, which is unique for each resident of Taiwan.
For each deceased subject, the cause of death was classified as either natural or unnatural on the basis of the information provided by the Death Certification System. Deaths due to suicide (ICD- 9 code 950-959), accidents (ICD-9 code 800-949) and homicide (ICD-9 code 960-989) were categorized as unnatural deaths. All remaining causes were considered natural.
The number of deaths that might be expected to occur in a given sample was computed by timing sex- and age-specific person-years at risk with sex- and age-specific mortality rates of the general pop- ulation in Taiwan. The person-years were com- puted as the time since inclusion in the study until
the time of death or end of the study (December 3 1, 1993). The mortality rates of the general popu- lation were derived from Taiwan vital statistics tables (Department of Health, 1987-1993).
A standardized mortality ratio (SMR) was calculated by dividing the observed number of deaths by the expected number of deaths. The standard error of SMR was computed as D’12/E,
where D was the observed number of deaths and
E was the expected number of deaths (Breslow and Day, 1987). Significance testing for individual SMR was done by computing test statistics x = 2(D”= - El’=), which follow a standard nor- mal distribution (Breslow and Day, 1987). When two SMRs are compared, z statistics were com- puted as (SMRl - SMR2)/(var(SMRl) + var (SMR2)) I” . All tests were two-tailed and a P
value of less than 0.05 was considered statistically significant.
3. Results
Of the 13 385 patients in this study (9309 men and 4076 women), 2039 (1720 men and 3 19 women) had died by the end of 1993 (Table 2). For unnatural deaths, the SMR of both men and women peaked at 15 to 24 years of age and decreased remarkably thereafter; women’s mortal- ity became similar to that of the general popula- tion at 65 to 79 years of age (Table 2). In contrast, for natural deaths, the SMRs of both men and women peaked at ages 10 years later than those for unnatural deaths and remained greater than 1 thereafter. For men, the SMR of unnatural deaths was higher than that of natural deaths at 15 to 24 years of age; but the trend reversed for the age groups of 25 to 34 and 55 to 64 years. For women, the SMR of unnatural deaths tended to be higher than that of natural deaths, although only significantly for the age groups of 15 to 24 and 35 to 44 years. Consequently, women’s SMR of all deaths was higher than men’s before the age of 45 years, mainly due to a much higher excess risk of unnatural death. For total ages, women’s SMR of all deaths (4.82) was significantly higher than men’s (3.08).
The causes of excess unnatural deaths included accidents (SMR = 3.25 f 0.23 for men and
W.J. Chen et al. /Psychiatry Research 62 (1996) 239-250 243
Table 2
Standardized mortality ratio (SMR) by age, sex, and cause of death
Age (years)
Natural deaths Unnatural deaths All deaths
Oa Eb SMR f S.E.C 0 E SMR f S.E. 0 E SMR f SE.
Men 15-24 25-34 35-44 45-54 55,-64 65-79 Total
Women 15-24 25-34 35-44 45-54 55-64 65-79 Total
17 4.31 3.95 f 0.96 95 9.58 9.92 * 1.02 125 24.49 5.11 f 0.46 103 30.63 3.36 zt 0.33 424 119.30 3.55 l 0.17 686 301.53 2.28 f 0.09 1450 489.84 2.97 zt 0.08
6 1.16 5.15 l 2.10 29 3.27 8.87 f 1.65 42 7.01 5.99 f 0.92 38 10.32 3.68 zk 0.60 50 13.63 3.67 + 0.52 47 22.06 2.13 f 0.31 212 57.46 3.69 zt 0.25
39 88 58 26 28 31 270
22 36 29 13 6
107
2.16 18.04 zt 2.89*
14.11 6.24 f 0.66*
10.74 5.40 f 0.71 7.92 3.28 * 0.64 17.02 1.65 zt 0.31’
16.03 1.93 f 0.35 67.98 3.97 f 0.24*
0.39 56.25 f 11.99*
2.54 14.15 zt 2.36 2.25 12.87 zt 2.39.
1.74 1.45 zt 2.07 1.15 5.21 zt 2.13 0.71 1.40 f 1.41 8.79 12.17 f 1.18’
56 6.47
183 23.69 183 35.23 129 38.56 452 136.31 711 317.56 1720 557.81
28 1.56
65 5.81
71 9.27
51 12.06 56 14.78 48 22.17 319 66.25
8.66 f 1.16 7.73 f 0.57 5.19 f 0.38 3.35 zt 0.29 3.32 f 0.16 2.26 zt 0.08 3.08 f 0.07
18.00 * 3.40**
11.18 f 1.39**
7.66 f 0.91**
4.23 f 0.59 3.79 l 0.51 2.11 l 0.30 4.82 zt 0.27*’
aObserved number of deaths; bExpected number of deaths; CStandard error.
All SMRs are significantly different from I except women’s SMR of unnatural deaths for age group 65-79 years.
*P < 0.05 for difference between SMR of natural and unnatural deaths.
**P < 0.05 for gender difference in SMR of all deaths.
10.6 f 1.22 for women) and suicide (SMR = 9.98 f 1.22 for men and 21.93 f 3.94 for women). Excess deaths due to homicide were found for male patients (SMR = 5.51 A 1.74) but not for female patients (SMR = 3.29 f 3.29).
Overall, 71.2% of unnatural deaths were due to ac- cidents, 26% due to suicide and 2.8% due to homi- cide. The causes of excess natural deaths included infectious diseases (SMR = 7.61 f 0.63 for men and 7.20 f 2.17 for women), respiratory system diseases (SMR = 5.09 f 0.47 for men and 9.07 f 2.27 for women), cardiovascular diseases (SMR = 3.71 f 0.23 for men and 7.57 f 1.04 for women), and cerebrovascular diseases (SMR = 2.50 f 0.19 for men and 2.57 f 0.57 for women). There was no excess of deaths due to ma- lignant neoplasms (SMR = 0.96 * 0.09 for men and 1.45 f 0.31 for women) for these patients.
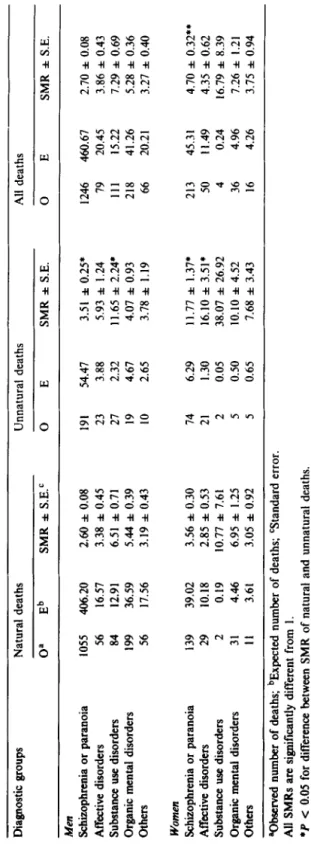
There were more deaths than expected for pa- tients in all five broad diagnostic categories (Table 3). For all deaths, patients with substance use dis-
orders had the highest SMR, followed by patients with organic mental disorders, for both men and women. The SMRs of the remaining three categories were similar. For men, the SMR of un- natural deaths was higher than that of natural deaths for the categories of schizophrenia or para- noia and substance use disorders. For women, the SMR of unnatural deaths was higher than that of natural deaths for the categories of schizophrenia or paranoia and affective disorders. For all deaths, the SMR of women was higher than that of men only for the category of schizophrenia or paranoia.
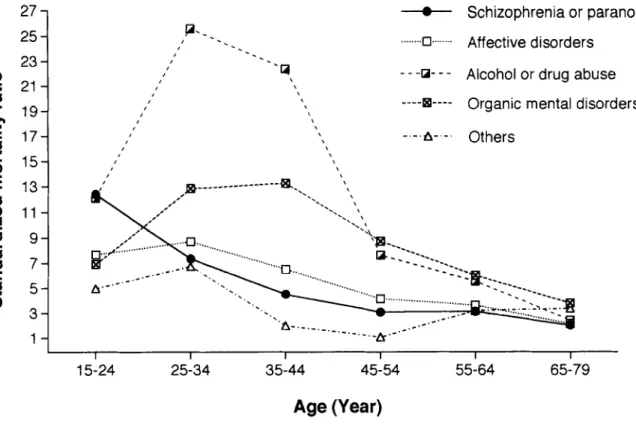
The SMRs of all deaths in the various age groups for all five diagnostic categories for men and women together are shown in Fig. 1. Patients with substance use disorders and organic mental disorders tended to have higher SMRs across all age groups than patients in the remaining three categories, except that the SMR of organic mental disorders in the 15- to 24-year age group was lower
Table 3 Standardized mortality ratio (SMR) by diagnosis, sex, and cause of death Diagnostic groups Natural deaths Unnatural deaths All deaths 0’ Eb SMR zt S.E.C 0 E SMR zt S.E. 0 E SMR LIZ S.E. Men Schizophrenia or paranoia Affective disorders Substance use disorders Organic mental disorders Others
1055 406.20 2.60 f 0.08 191 54.47 3.51 f 0.25* 1246 460.67 2.70 f 0.08 56 16.57 3.38 l 0.45 23 3.88 5.93 f 1.24 79 20.45 3.86 f 0.43 84 12.91 6.51 zt 0.71 27 2.32 11.65 + 2.24. 111 15.22 7.29 * 0.69 199 36.59 5.44 f 0.39 19 4.67 4.07 l 0.93 218 41.26 5.28 f 0.36 56 17.56 3.19 zk 0.43 10 2.65 3.78 zt 1.19 66 20.21 3.27 zt 0.40 Women Schizophrenia or paranoia Affective disorders Substance use disorders Organic mental disorders Others
139 39.02 3.56 zk 0.30 74 6.29 11.77 f 1.37* 213 45.31 4.70 f 0.32** 29 10.18 2.85 zt 0.53 21 1.30 16.10 f 3.51’ 50 11.49 4.35 f 0.62 2 0.19 10.77 f 7.61 2 0.05 38.07 f 26.92 4 0.24 16.79 zk 8.39 31 4.46 6.95 f 1.25 5 0.50 10.10 zk 4.52 36 4.96 7.26 zt 1.21 II 3.61 3.05 zt 0.92 5 0.65 7.68 zt 3.43 16 4.26 3.75 * 0.94 aObserved number of deaths; bExpected number of deaths; CStandard error. All SMRs are significantly different from 1. *P < 0.05 for difference between SMR of natural and unnatural deaths. l *P < 0.05 for gender difference in SMR of all deaths.
W.J. Chen et al. /Psychiatry Researeh 62 (19%) 239-250 245
27 25 23-1
1-i
--o-- Schizophrenia or paranoia P-_.
I’ _. . . ,=G....-. Affective disorders
-.
,’ --.
I’ 9
\ - --U- - - Alcohol or drug abuse
\ I’
,’ \ ----B---- Organic mental disorders
t
I’ \
\ \ -.-.A-.-. Others
, \
I
I I I I I I
15-24 25-34 35-44 45-54 55-64 65-79
Age (Year)
Fig. I. Standardized mortality ratio by age for patients (men and women together) of five broad diagnostic categories.
than that of schizophrenia or paranoia. The SMRs of substance use disorders and organic mental dis- orders were highest between 25 and 44 years of age. In contrast, the SMRs of the remaining three categories were highest between 15 and 34 years of age. As patients became older, the SMRs of all five categories tended to be similar.
The SMRs of patients categorized by their length of stay in hospital at the beginning of the study are shown in Table 4. For unnatural deaths, SMR was highest for both men and women who were admitted for the first time for less than 1 year.
As length of stay increased, the SMR of unnatural deaths decreased. Women who had been admitted for more than 5 years did not have a significantly different SMR of unnatural deaths. For natural deaths, SMR of men decreased as the length of stay increased, although the linear trend was less prominent than that for unnatural deaths. A linear trend was not seen in women’s SMR for natural
deaths. Interestingly, there were no significant dif- ferences between the SMRs of all deaths for men and women who were admitted for the first time or readmitted for less than 1 year. However, the SMR of all deaths of women who had been admitted for more than 1 year was higher than that of men.
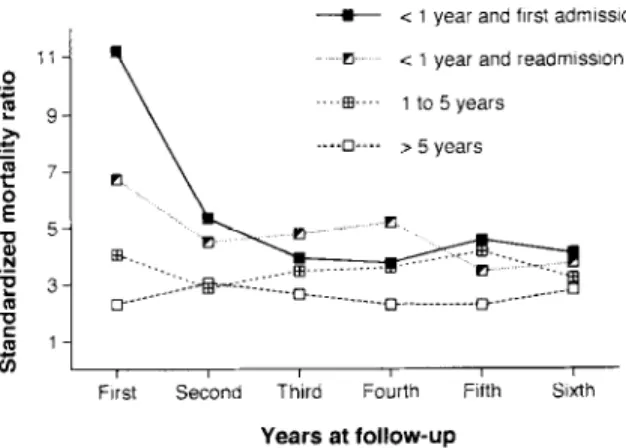
To further clarify the relationship between length of stay in hospital and SMR, we calculated the SMR at various follow-up periods (Fig. 2). At the first year of follow-up, the SMRs were highest for those who were admitted for the first time for less than 1 year. For the remaining patients, the magnitude of SMR decreased as their length of stay increased. As the follow-up went along, the SMRs of all four lengths of stay tended to decrease and stabilize at a similar level.
Because the distribution of patients’ lengths of stay was quite different between the three types of hospitals, the SMR for each type of hospital was calculated by patients’ lengths of stay. For patients
246 W.J. Chen et al. /Psychiatry Research 62 (1996) 239-250
Table 4
Standardized mortality ratio (SMR) by length of stay, sex, and cause of death
Length of stay Natural deaths Unnatural deaths All deaths
(years)
Oa Eb SMR zt S.E.C 0 E SMR + S.E. 0 E SMR f SE.
Men
c 1 and first admission 129 21.84 4.63 f 0.41 51 6.80 7.50 f 1.05’ 180 34.64 5.20 f 0.39
c I and readmission 249 61.93 4.02 zt 0.25 127 17.88 7.10 * 0.63’ 376 79.80 4.71 zt 0.24
1-5 233 13.25 3.18 zt 0.21 39 12.33 3.16 + 0.51 272 85.58 3.18 f 0.19
>5 839 326.51 2.57 f 0.09 53 30.92 I.71 f 0.24* 892 357.43 2.50 zt 0.08
Women
< 1 and first admission 32 9.34 3.42 + 0.61 26 1.59 16.37 zt 3.21; 58 10.93 5.31 l 0.70
< 1 and readmission 72 24.40 2.95 zt 0.35 61 4.04 15.11 f I.941 133 28.43 4.68 zt 0.41
1-5 51 8.23 6.20 * 0.87 I7 1.53 II.08 zt 2.69 68 9.16 6.97 f 0.84**
>5 57 15.47 3.69 ztz 0.49 3 1.63 1.84 * 1.06 60 17.09 3.51 f 0.45**
aObserved number of deaths; bExpected number of deaths; ‘Standard error.
All SMRs are significantly different from 1 except women’s SMR of unnatural deaths for length of stay >5 years.
*P < 0.05 for difference between SMR of natural and unnatural deaths.
**P < 0.05 for gender difference in SMR of all deaths.
hospitalized for less than 1 year, the SMR was the highest for public asylums (4.62 f 0.39), followed by public hospitals (4.12 f 0.26) and the lowest for private hospitals (3.79 f 0.20). In contrast, for patients hospitalized for more than 5 years, the SMR was the highest for private hospitals (2.67 f 0.34), followed by public asylums (2.46 f 0.08) and the lowest for public hospitals
--a- < 1 year and first admission
?I < 1 year and reaum~ss!on ----•---- 1 to 5 years
pi, , , , , ,
Frst Second Third Fourth Fifth Sixth
Years at follow-up
Fig. 2. Standardized mortality ratio by years at follow-up for patients (men and women together) of different lengths of hos- pital stay at the beginning of the study.
(1.99 f 0.47). For patients hospitalized for be- tween 1 and 5 years, the SMRs were similar for the three types of hospitals: 3.42 f 0.29 for private hospitals, 3.38 f 0.62 for public hospitals, and 3.13 f 0.24 for public asylums.
4. Discussion
This study is the first mortality analysis of psychiatric inpatients in Taiwan. The sample in- cluded patients of both public and private hospi- tals, most of whom were diagnosed with schizophrenia or paranoia. Almost half of the pa- tients had been hospitalized for 1 year or more when they were included in the study. The long duration of hospital stay of these patients was pri- marily the consequence of the severe inadequacy of community-based psychiatric care facilities, such as halfway houses, in Taiwan.
Generally speaking, SMR represents a valid age-corrected comparison with the reference popu- lation in an individual study. However, because the age distribution of the study population, rather than that of the general population, is used as a weight in the standardization process, SMRs are not directly comparable across studies (Rothman,
W.J. Chen et al. /Psychiatry Research 62 (19%) 239-250 241
1986; Breslow and Day, 1987). A marked differ- ence in the age distribution of two patient samples might lead to a different SMR even though their age-specific mortality rates were equal. This must be kept in mind when we compare our results to studies from other countries as the patients’ age distributions were not reported for some studies.
Our purpose here is to identify clues that might be important in explaining the differences in mortali- ty rates.
The overall SMRs for both men and women in our sample were apparently higher than those in studies conducted after 1970 in North America or Northern Europe. The mortality ratio of psychiatric inpatients to the general population reported by four studies in the United States rang- ed from 2.6 to 1.46 for men and 3.3 to 1.89 for women (Craig and Lin, 1981a; Haugland et al., 1983; Black et al., 1985; Wood et al., 1985). Studies in Norway (Saugstad and Bdegird, 1985) and the Netherlands (Brook, 1985) also found an SMR of
1.7 for men and 2.3 to 1.85 for women.
If we considered only those patients admitted for the first time, the SMR for all deaths was 5.20 for men and 5.31 for women in our study (Table 4). In contrast, Eastwood et al. (1982) reported that the SMR for psychiatric inpatients who were admitted for the first time in Metropolitan Toron- to was 1.35 for men and 1.55 for women.
Interestingly, the SMRs found in our study were similar to those in studies in Japan, the United States and Northern Europe before deinstitution- alization. Shinozaki (1976) studied all psychiatric inpatients in a Japanese Prefecture and found that the SMR was 6.8 for men and 8.5 for women.
After adjusting the mortality rates of two earlier studies to the 1973 general population age of New York State, Craig and Lin (1981 b) found that the mortality ratio of psychiatric inpatients to the gen- eral population was 3.8 for men and 4.1 for women in Norway (1926-1941) and 3.4 for men and 3.2 for women in Michigan (1950-1954).
In our study, the highest SMR occurred in the youngest age group (15-24 years) for both men and women. After that, the SMR decreased remarkably and was lowest in the oldest age group (65-79 years). A similar trend was reported by two studies (Craig and Lin, 1981b; Haugland et al.,
1983) in the United States and one in Japan (Shinozaki, 1976). In other studies the SMR did not peak at the youngest age group but did so at ages below 40 years (Eastwood et al., 1982; Black et al., 1985; Brook, 1985; Wood et al., 1985).
The main causes of excess deaths among psychiatric inpatients in our study were unnatural deaths, especially in the younger age groups. This is consistent with studies from North America and Northern Europe (Eastwood et al., 1982;
Haugland et al., 1983; Black et al., 1985; Saugstad and Bdegird, 1985). However, the mortality of psychiatric inpatients due to natural causes re- mained higher than that of the general population across all age groups for both men and women. Al- though one study of patients admitted for the first time in Toronto reported that mortality due to natural deaths was not higher than that of the gen- eral population, many other studies found excess natural deaths in psychiatric patients (Saugstad and @leg&d, 1979; Haugland et al., 1983; Black et al., 1985).
The higher SMR for women than men in our study is consistent with most other studies (Shinozaki, 1976; Craig and Lin, 1981 b; Eastwood et al., 1982; Haugland et al., 1983; Black et al., 1985; Brook, 1985). However, Wood et al. (1985) found the reverse to be true. One major reason that women’s SMR was higher than men’s was be- cause women were at a higher risk of unnatural deaths.
After grouping into five broad diagnostic categories, patient SMRs in this study seemed to vary a great deal. Patients with substance use dis- orders had a very high SMR (7.29 for men and 16.79 for women) that peaked around 30 years of age. In comparison, the SMR was 1.58 for male and 2.39 for female patients with substance use disorders in a private university psychiatric hospi- tal (Black et al., 1985), 2.10 for male and 2.69 for female alcoholic patients in two large public men- tal hospitals (Haugland et al., 1983) in the U.S.
One possible reason for this difference is the lack of beds specifically provided for the treatment of substance abuse/dependence in Taiwan. Thus, those admitted tend to be the most severe cases.
Patients with organic mental disorders in our study also had a higher SMR (5.28 for men and
248 W. J. Chen et al. /Psychiatry Research 62 (1996) 239-250
7.26 for women) than those reported in other countries. For example, the SMR was 1.75 for male and 2.10 for female patients with organic mental disorders in a private university psychiatric hospital (Black et al., 1985), and 3.1 for patients with organic brain syndromes in Missouri public psychiatric hospitals (Wood et al., 1985) in the U.S. Notably, when the causes of death were divided into natural and unnatural in our study, the SMR of unnatural deaths was as high as that of natural deaths. In contrast, a study of patients admitted for the first time in Canada (Eastwood et al., 1982) found that there were no unnatural deaths for patients with organic mental disorders and their natural deaths were not higher than in the general population.
Unlike the high SMR of the previous two categories, the SMR of patients with schizo- phrenia or paranoia (2.70 for men and 4.70 for women) was similar to that in other countries. For example, the SMR was 2.14 for male and 4.17 for female schizophrenic patients in a private univer- sity psychiatric hospital (Black et al., 1985) or 2.14 for men and 1.56 for women schizophrenic pa- tients in two large public mental hospitals (Haugland et al., 1983) in the U.S. However, the chronicity of the schizophrenic patients in our sample may be partially responsible for the low SMR, as the excess mortality of schizophrenic patients decreased as the length of stay increased.
The SMR for patients with affective disorders in our sample (3.86 for men and 4.35 for women) was similar to that of schizophrenic or paranoid pa- tients. These SMRs were also similar to those for patients in two large public mental hospitals in the U.S. (4.69 for men and 2.37 for women) (Haugland et al., 1983). However, the SMR was only 1.1 to 1.4 for male and 1.36 to 2.49 for female patients with affective disorders or depressive neuroses in a private U.S. university psychiatric hospital (Black et al., 1985).
Our data indicate that the largest excess mortali- ty of psychiatric inpatients occurred mainly within the first year after admission, especially if the ad- mission was for the first time. Unnatural causes were largely responsible for the excess deaths.
Craig and Lin (198 1 b) and Saugstad and 0degjrd (1985) also reported that the highest mortality
ratio for psychiatric patients occurred in the first year after admission. Black et al. (1985) demonstrated that the SMR during the first 3 months after discharge was the highest as com- pared with other periods. This trend is similar to that found in our study (Fig. 2) which showed that the SMR was largest at the first year of follow-up for those admitted for the first time, or readmitted within 1 year, although the information from the Death Certification System did not specify whether those patients had died outside hospital.
There may be several different reasons that all types of psychiatric inpatients in Taiwan had SMRs that were higher than those of patients in many western industrialized countries. In Taiwan, the cultural stigma attached to using psychiatric services may bc stronger than in western countries (Lin and Lin, 1981). In addition, the number of psychiatric beds in Taiwan is inadequate, in- dicated by the fact that most psychiatric patients had to be put on a waiting list before being granted admission. These differences raise the possibility that the severity of disease of patients upon admis- sion is higher in Taiwan than in western countries.
This would affect the value of SMR. Studies of psychiatric outpatients in the U.S. (Martin et al., 1985) or Canada (Koranyi, 1977) in the 1970s found that the SMR ranged from 1.74 to 2.0, which was lower than the rate for inpatients.
Another possibility is that the treatment delivered by psychiatric care systems in Taiwan still has a lot of room for improvement. In terms of inpatient treatment, a review by the Department of Health in 1988 pointed out that the psychiatric service of 33% of hospitals with acute wards and 30% of hospitals with only chronic wards was un- satisfactory (Hwu et al., 1995). The findings of the SMRs among the three types of hospitals also sug- gested that public asylums were less well equipped for the care of acute patients. For the care of chronic patients, both private hospitals and public asylums were poorer than public hospitals.
Both possibilities pointed to the importance of community-based psychiatric care. In a study of registered psychiatric patients, in a defined geographical area which offered both traditional inpatient and community-based services, one group reported an SMR of only 1.8 (Hassall et al.,
W.J. Chen et al. /Psychiatry Research 62 (19%) 239-250 249
1988). When community-based services were the sole source of psychiatric care in an area, the SMR of psychiatric patients was even lower (1.63) (Amaddeo et al., 1995). These findings, along with the results in this study, suggest that more community-based facilities are urgently needed in Taiwan to relieve inpatient facilities of the care of acute patients, who are at the highest risk of death and to detect psychiatric cases in early stages or to facilitate prompt seeking of professional help for psychiatric cases through related programs. Cur- rently in Taiwan, all community-based psychiatric services, such as shelter workshops, halfway houses, and home-care programs, are still on pro- bation and not on a meaningful scale. Meanwhile, we agree with Dencker and Dencker (1994) that the provision of community-based services should not be at the expense of existing inpatient facilities, especially with the current shortage of psychiatric beds in Taiwan.
Regarding the lowering of psychiatric in- patients’ excess mortality in terms of both unnatu- ral and natural causes of death, the findings of this report also provide useful implications for policy.
Since 71.2% of unnatural deaths were due to acci- dents, it is important to take into consideration the safety of inpatient facilities in the future accredita- tion of these psychiatric hospitals. As 26% of un- natural deaths were due to suicides, the care-providers of psychiatric patients should be re- minded routinely of the risk of suicide and to check closely the compliance of patients in taking medication, in addition to paying attention to disturbing psychotic symptoms. Most of the causes of excess natural deaths, such as infectious, respiratory system, cardiovascular and cerebro- vascular diseases, were due to ignorance of medical treatment, poor compliance, or poor hygiene in the living environment. Thus, facilities for treating physical illness and the general hygiene conditions of psychiatric hospitals should also be emphasized for regular accreditation.
Acknowledgments
The work reported here was supported by a grant from the National Health Research Insti-
tute, Taiwan, ROC (DOH83-HA-306) and the Department of Health, Taiwan, ROC (DOH-77- 18). The authors thank Gia-Hwa Hsiao for prelim- inary analyses of the data.
References
Amaddeo, F., Bisofft, G., Bonizzato, P., Micciolo, R. and Tansella, M. (1995) Mortality among patients with psychiatric illness: a ten-year case register study in an area with a community-based system of care. Br J Psychiatry
166, 783-788.
American Psychiatric Association (1980) Diagnostic and Statistical Manual of Mental Disorders, 3rd Edn. American Psychiatric Association, Washington, DC.
Black, D.W., Warrack, G. and Winokur, G. (1985) Excess mor- tality among psychiatric patients: the Iowa record-linkage study. JAMA 253, 58-61.
Breslow, N.E. and Day, N.E. (1987) Statistical Methods in Cancer Research. Vohone II. The Design and Analysis of Cohort Studies. International Agency for Research on Cancer, Lyon.
Brook, O.H. (1985) Mortality in the long-stay population of Dutch mental hospitals. Acta Psychiatr Stand 71, 626-635.
Craig, T.J. and Lin, S.P. (198la) Death and deinstitutionaliza- tion. Am J Psychiatry 138, 224-227.
Craig, T.J. and Lin, S.P. (198lb) Mortality among psychiatric inpatients: age-adjusted comparison of populations before and after psychotropic drug era. Arch Gen Psychiatry 38, 935-938.
Dencker, S.J. and Dencker, K. (1994) Does community care reduce the need for psychiatric beds for schizophrenic patients? Acta Psychiatr Stand 89 (suppl. 382), 74-79.
Eastwood, M.R., Stiasny, S., Meier, H.M.R. and Woogh, C.M.
(1982) Mental illness and mortality. Compr Psychiatry 23, 377-385.
Farr, W. (1841) Report upon the mortality of lunatics. J Stat sot 4, 17-33.
Giel, R., Dijk, S. and van Weerden-Dijkstra, J.R. (1978) Mor- tality in the long-stay population of all Dutch mental hospi- tals. Acta Psychiatr Stand 57, 361-368.
Hassall, C., Prior, P. and Cross, K.W. (1988) A preliminary study of excess mortality using a psychiatric case register. J Epidemiol Community Health 42, 286-289.
Haugland, G., Craig, T.J., Goodman, A.B. and Siegel, C.
(1983) Mortality in the era of deinstitutionalization. Am J Psychiatry 140, 848-852.
Hwu, H.-G., Rin, H., Chen, C.-Z., Chang, S.-H., Huang, M.- G. and Yeh, L.-L. (1995) A study on the personal-familial and clinical data of psychiatric inpatients in Taiwan.
Chinese Psychiatry 9, 16-3 I.
Koranyi, E.K. (1977) Fatalities in 2070 psychiatric outpatients:
preventative features. Arch Gen Psychiatry 34, 1137-1142.
Lin, T.-Y. and Lin, M.-C. (1981) Love, denial and rejection:
responses of Chinese families to mental illness. In: Klein- man, A. and Lin, T.-Y. (Eds.), Normal and Abnormal Be-
250 W.J. Chen et al. /Psychiatry Research 62 (1996) 239-250
havior in Chinese Culture, Reidel Publishing Company, Dordrecht, Holland, pp. 387-401.
Malzberg, B. (1953) Further studies of mortality among pa- tients with mental disease. Acta Med Stand 277, 2 15-230.
Martin, R.L., Cloninger, C.R., Guze, S.B. and Clayton, P.J.
(1985) Mortality in a follow-up of 500 psychiatric outpa- tients. I. Total mortality. Arch Gen Psychiatry 42, 47-54.
@deg&d, @. (1951) Mortality in Norwegian mental hospitals:
1926-1941. Acta Gene? 2, 141-173.
Rin, H. (1983) Current status and future perspectives of the psychiatric care system in Taiwan. J Jpn Psychialr Hosp Assoc 2, 47-51.
Rothman, K.J. (1986) Modern Epidemiology. Little, Brown, Boston.
Saugstad, L.F. and tiegird, 8. (1979) Morta!ity in psychiatric hospitals in Norway 1950-74. Acta Psychiatr Stand 59, 43 l-447.
Saugstad, L.F. and @deg&d, #. (1985) Recent rise in supposed- ly stress dependent causes of death in psychiatric hospitals in Norway indicating increased ‘stress’ in hospitals? Acta Psychiatr Stand 71, 402-409.
Shinozaki, H. (1976) An epidemiologic study of death of psychiatric inpatients. Cotnpr Psychiatry 17, 425-436.
Sims, A. (1987) Why the excess mortality from psychiatric ill- ness? Br Med J 294, 986-987.
Tokuhata, G.K. and Stehman, V.A. (1958) Mortality in state mental hospitals of Michigan, 1950-54. Public Health Rep 73, 750-761.
Tsuang, M.T. and Simpson, J.C. (1985) Mortality studies in psychiatry: should they stop or proceed? Arch Gen Psychiatry 42, 98-103.
Wood, J.B., Evenson, R.C., Cho, D.W. and Hagan, B.J. (1985) Mortality variations among public mental health patients.
Acra Psychiatr Stand 72, 218-229.
World Health Organization (1978) Menral Disorders: Glossary and Guide to Their Classification in Accordance with the Ninth Revision of the International Classijication of Diseases (ICD-9). WHO, Geneva.
Yeh, E.-K. (1992) Development of hospital-community psychiatry in Taiwan: the past and the perspectives. Chinese Psychiatry 6, 41-59.