Chapter 4 Design and Implementation of HILCADT – High-Level Computer-Aided Debugging Tool
4.1 User Interface of HILCADT
We design a UI for the debugging tool and Figure 4.1 shows the UI layout.
1
3
2 5
6
4
Figure 4.1 UI of HILCADT
1. Menu option: We may choose the source file that we want to debug.
2. Command line: We may input a query here. The query language is the high-level debugging language which we will describe in section 4.2.
3. Execute button: There are four buttons.
is the regular mode for execution. After execution, the debugging information will be display on the panel (4).
is the visualization mode for execution. If we press this button, it will trigger a 3D visualization subsystem to present the result through socket. Now, we had already developed a visualization subsystem prototype and a specific data format to work together with our debugging tool HILCADT, it will be described in section 4.3.
is the socket mode for execution. If we press this button, we will generate a socket connection and transfer all debugging information through sockets. The data format is different from visualization mode. This subsystem is implemented for the future, allowing other systems to cooperate.
button’s functionality is to clean the information panel (4.) 4. Information panel: It shows the debugging information here.
5. Tabbed Panel: A program may have many files (for example, a java program may have a lot of classes), we could switch the source files through the tabbed option.
6. Source panel: It shows the source code here.
4.2 The high-level debugging language
When we load a program into our system, we may input a query. For example, we list an example java code bellow:
1. package aji;
2.
3. public class hello { 4.
5. public static void main(String[] args) { 6.
7. int a=1, b=1;
8. System.out.println("Begin");
9. for(int i=0;i<5;i++){
10. a=1;
11. while(a<=5){
12.
13. System.out.print("a= "+a);
14. System.out.println(" b= "+b);
15. b++;
16. a++;
17.
18. } 19. } 20. } 21. }
It has two integers a and b, and their initial value are 1. At line 9, we initial a “for loop” controlled by variable i. The “for loop” will run 5 times. At line 11, we initialize
a “while” conditional statement with boolean expression a <= 5. The program’s final result is that integer a increases from 1 to 5 repeatedly and integer b increases from 1 to 25 along the execution.
In our design of high-level debugging language, if we input “get int b while(i <= 3) in hello:main;,” our system will automatically add breakpoints at line 7, 14 ,15, and then print the result while i<=3 at every location while b is referenced. In the following, we show the result.
Call method: main -- aji.hello:7 1 BP HIT
BP location lineNumber at 7 Not i initial
2 BP HIT
BP location lineNumber at 14
i= 0
3 BP HIT
BP location lineNumber at 15 b= 1
i= 0 4 BP HIT
BP location lineNumber at 14 b= 2
i= 0
5 BP HIT
BP location lineNumber at 15 b= 2
i= 0
6 BP HIT
BP location lineNumber at 14 b= 3
i= 0 . .
40 BP HIT
BP location lineNumber at 14 b= 20
i= 3
41 BP HIT
BP location lineNumber at 15 b= 20
i= 3
The last statement which has i<=3 and b is referenced is at line 15.
In the following, we show another example:
1. package god;
2.
3. /**
4. * <p>Title: </p>
5. * <p>Description: </p>
6. * <p>Copyright: Copyright (c) 2003</p>
7. * <p>Company: </p>
8. * @author not attributable 9. * @version 1.0
10. */
11.
12. public class pro { 13.
14. /**
15. * the main is to get a 16. * @param args main 17. *
18. */
19.
20. public static void main(String[] args) { 21.
22. damn dn=new damn("this is dn");
23.
24. for (int i=0;i<10;i++){
25. System.out.println(dn);
26. }
27. System.out.println("finished");
28. } 29.
30. }
We input a query “get obj dn in pro:main;.” Our system will automatically add breakpoints at line 22, 25, and shows the values of the instance “dn” when the program hits the two breakpoints.
BP location lineNumber at 22 Still Not An Instance
BP location lineNumber at 25 Id = dn
Instance = instance of god.damn(id=332)
Fields = {god.damn.vec, god.damn.a, god.damn.ob, god.damn.b, god.damn.c}
Content = {god.damn.ob = instance of god.obj1(id=334), god.damn.vec=instance of java.util.Vector(id=333), god.damn.c=instance of java.lang.String[2] (id=336), god.damn.b="this is dn", god.damn.a=1}
Our high-level debugging language is defined as follows:
get TYPE [ID]+ [POSITION]? [CONDITIONAL]? SCOPE
TYPE : {object, string, integer, array}
ID : {instance or variable}
POSITION : {the position of the source code}
CONDITIONAL : {conditional statement}
SCOPE : {in which class and in which method}
1. TYPE: identify the instance type or variable declaration type.
2. ID: identify the name of instance or variable that we want to watch, user can assign more than one ID.
3. POSITION: identify the exact ID position in source code that users want to watch.
Users may not assign this clause and our system will do it automatically.
4. CONDITIONAL: whether a variable’s value is collected or not depends on this conditional expression.
5. SCOPE: The scope of adding breakpoints and collecting variable’s information, for example, in a class or in a method.
We use JavaCC to build a parser which can parse the defined high-level debugging language. After user input a query, we could translate the query into a sequence of requests such as ID, POSITION, and CONDITIONAL, and send these requests to JPDA. For example, “get obj dn in pro:main;.” In this case, we get the TYPE=obj, ID=dn, and SCOPE= pro:main, it don’t have POSITION and CONDITIONAL. In order to get
the position that we can set breakpoints in source code, we parse the source code and figure out where are IDs matched in the source code and get the line numbers in the source. If users already identify the POSITION, we get the breakpoint locations directly.
4.3 The system architecture
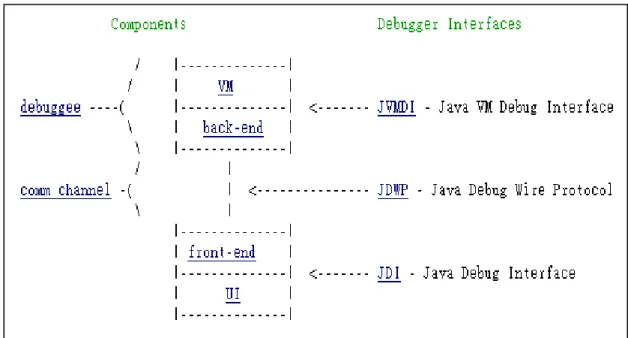
In this section, we will describe our system architecture. Java Platform Debugger Architecture defines three interfaces (JVMDI, JDWP, and JDI). The interactions among these interfaces are through requests and events. Requests originate from the debugger side, which include queries for information and setting debugging state.
Events originate from the debuggee side, signaling the change of state in VM.
For example, a user may watch the value of local variable in a stack. We use the JDI to get the value by invoking calls the getValue method such as
theStackFrame.getValue(theLocalVariable)
Where theStackFrame is a com.sun.jdi.StackFrame and theLocalVariable is a com.sun.jdi.LocalVariable.
The front-end then sends this query over a communication channel (let's say a socket) to the back-end running in the debuggee process. The method getValue() sends it by formatting it into a byte stream according JDWP protocol. The back-end resolves the byte-stream and sends the query to the VM through the JVMDI. For example, let's say the requested value is a variable intValue of type integer. Then the following JVMDI function call is invoked:
p = jvmdi->GetLocalInt(frame, slot, &intValue);
The back-end sends back the return packet across the socket, which includes the value of intValue in a byte-stream format of JDWP. The front-end resolves the packet and passes it as the return value of getValue(). The IDE then displays the value.
Requests to change debugging state are processed in a similar step. For example, a request for setting a breakpoint goes through the similar steps -- the JDI methods are called, sends it through JDWP protocol, the only different is the JVMDI functions called are different.
When a debuggee hits a breakpoint, this is where events come into play. The virtual machine sends an event through the JVMDI interface. It calls the event handling function which passes a breakpoint event structure:
typedef struct { jthread thread;
jclass clazz;
jmethodID method;
jlocation location;
} JVMDI_breakpoint_event_data;
The back-end to register an event handling function to a particular event, it use static void eventHook(JNIEnv *env, JVMDI_Event *event) { ...
This back-end function starts a chain of activities which filter the events to see if it is the user interest, queue it, and send it through the socket in the JDWP format defined for breakpoint events. The front-end decodes and processes the event, eventually generating a JDI event. Actually, the JDI event is exposing it as a
com.sun.tools.jdi.event.BreakpointEvent, and then we get the event by removing it
from the event queue:
theEventQueue.remove()
theEventQueue is a com.sun.jdi.event.EventQueue. We will probably update its displays by making many query calls according the JDI.
Since, we had already defined a high-level debugging language. After user input a query, then we parse the query and translate the query into a sequence of requests and send it through JDWP to JVMDI. JVMDI will initialize the event that we are interested, and send it in JDWP format to com.sun.jdi.event.EventQueue which manages incoming events from JVM. After that, we can dispatch incoming events by theEventQueue.remove() method to control the flow of debugging process. Figure 4.2 shows our system control flow and Figure 4.3 shows the relation of these interfaces.
Figure 4.2 requests and event flow diagram
Figure 4.3 relations of interfaces
4.4 Communication with visualization subsystem
In the part, we developed a visualization subsystem to display the debugging information graphically, called DIVINE[11]. When users input a query and press the
“Visualization” button, then the visualization subsystem will be triggered.
The visualization subsystem, DIVINE can build a socket with our debugging tool HILCADT. If socket connection is successfully built, the DIVINE will create a window to display 3D objects. There is a daemon to exchange the information between DIVINE and HILCADT. The format between DIVINE and HILCADT is:
Id = dn
Instance = instance of god.damn(id=332)
Fields = {god.damn.vec, god.damn.a, god.damn.ob, god.damn.b, god.damn.c}
Content = {god.damn.ob=instance of god.obj1(id=334), god.damn.vec=instance of java.util.Vector(id=333), god.damn.c=instance of java.lang.String[2] (id=336), god.damn.b="this is dn", god.damn.a=1}
1. Id: The object or instance name.
The object’s name is “dn”.
2. Instance: The class type of the instance.
In above case, we know the instance class is “god.damn” and it has a unique id=332 from our system.
3. Field: The object’s fields.
In above case, we know the fields are {vec, a, ob, b, c} of instance “god.damn”.
4. Content: The content of these fields.
In above case, we know the fields content are {ob = instance of calss obj1, vec= a Vector instance, a=1, b=”this is dn”, c= a string array with three element [0] [1] [2]}
We post the source of class “damn” as follows:
package god;
import java.util.*;
/**
* <p>Title: damn</p>
* <p>Description: no</p>
* <p>Copyright: along Copyright (c) 2003</p>
* <p>Company: ntnu</p>
* @author along *
* @version 1.0 */
public class damn {
/**
* new vector */
int a;
obj1 ob;
String b;
String[] c;
/**
* constructor and initial value */
public damn(String str) {
vec=new Vector();
ob=new obj1();
c=new String[2];
a=1;
b=str; //str="this is dn"
c[0]="test";
c[1]="test2";
vec.addElement(ob);
vec.add(1,b);
} }
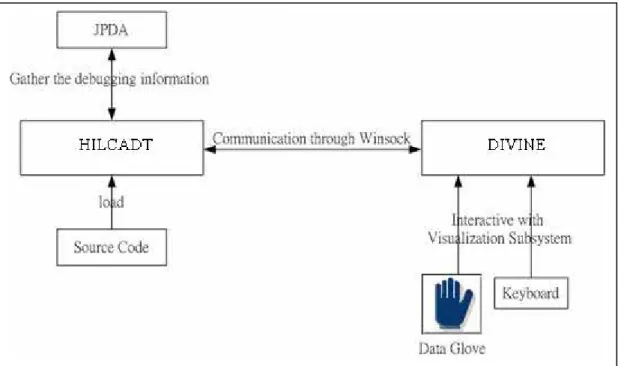
In the 3D graphic environment, users can interact with the visualization subsystem by using a data glove and keyboard. The details of communication between the DIVINE and HILCADT are shown in Figure 4.4.
Figure 4.4 Communicate between the DIVINE and HILCADT.
References
[1]. Richard H. Crawford, Ronald A. Ollsson, W. Wilson Ho, and Christopher E. Wee.
Semantic Issue in the Design of Languages for Debugging. Department of Computer Science University of California, Davis Davis, CA 95616-8562 U.S.A.
[2]. M. Golan and D. R. Hanson. DUEL – a very high level debugging language. In Proceedings of the Winter 1993 USENIX Technical Conference, San Diego, 1993.
[3]. R. E. Griswold and M. T. Griswold. The Icon Programming Language. Prentice Hall, Englewood Cliffs, NJ, second edition, 1990.
[4]. J. K. Hollingsworth, B. P. Miller, and J. M. Cargille. Dynamic Program Instrumentation for Scalable Performance Tools. Scalable High Performance Computing Conference, Knoxville, TN (May 1994).
[5]. J. K. Hollingsworth, B. P. Miller, M. J. R. Goncalves, O. Naim, Z. Xu, and L.
Zheng. MDL: A language and compiler for dynamic program instrumentation., International Conference on Parallel Architectures and Compilation Techniques San Francisco, California, November 1997.
[6]. B. P. Miller, M. D. Callaghan, J. M. Cargille, J. K. Hollingsworth, R. B. Irvin, K.
L. Karavanic, K. Kunchithapadam, and Tia Newhall. The Paradyn Parallel Performance Measurement Tools. IEEE computer, (28)11, November 1995.
[7]. R. A. Olsson, R. H. Crawford, W. W. Ho, Dalek A GNU, improved programmable debugger. In proceedings of the Summer USENIX Technical Conference, pages 221-231, Anaheim, CA, June 1990.
[8]. R. A. Olsson, R. H. Crawford, W. W. Ho and C. E. Wee, 'Sequential Debugging at a High Level of Abstraction', IEEE Software, May 1991, pp. 27--36.
[9]. Vern Paxson. A Survey of Support For Implementation Debuggers. CS 262 Prof.
Anderson October 30, 1990
[10]. Jonathan B. Rosenberg, How Debuggers Work: Algorithms, Data Structures, and Architecture. ISBN: 0-471-14966-7 Paperback 272 pages October 1996
[11]. Peng, Yi-wei. Interactive 3D Debugging Information Visualization for Linked-List Data Structure, (July 2003).