doi:10.6342/NTU201804215
國立臺灣大學醫學院藥學研究所 博士論文
Graduate Institute of Pharmaceutical Sciences College of Medicine
National Taiwan University Doctor Thesis
以液相層析質譜儀開發藥物與代謝體於採血卡 之分析方法
Development of liquid chromatography-mass spectrometry methods for pharmaceutical and metabolomics analysis using dried blood spot
錢笛雅
Divyabharathi Chepyala
指導教授﹕郭錦樺博士 Advisor: Ching-Hua Kuo, Ph.D.
中華民國 107 年 09 月 September, 2018
doi:10.6342/NTU201804215
i
This thesis work is dedicated to my beloved husband Surendhar Reddy, who has been a constant source of support and encouragement during the challenges of graduate school and life. This work is dedicated to my children Hiamanshu Reddy and Lahanvi Reddy, who have given me motivation and desire to accomplish the degree. This work is also dedicated to my parents, Malla Reddy and Bhagya Lakshmi, who have always loved me unconditionally and whose good exampleshave taught me to work hard for the things that I aspire to achieve.
doi:10.6342/NTU201804215
ii
Acknowledgement
At the outset I would like to express my sincere gratitude to my advisor, Dr. Ching-Hua Kuo for her continued support and guidance throughout the course of completion of this dissertation. Her passion for the field and the depth of her knowledge are inspirational. I thank her for placing her trust in me and pushing me constantly to the next level. The joy and enthusiasm she has for her research was contagious and motivational for me, even during tough times in the Ph.D. pursuit.
I thank all the former and current members of Kuo’s lab, for their support and creating a enjoyble work atmosphere in the lab. My special thanks to Dr. I-Lin Tsai (Isabel) for her guidance, which helped me to understand the definition of research problems with wider implications and develop basic skills of pharmaceutical analysis. Next Person whom I am very thank full is Marisa Huang, for her kind support to overcome the language barrier during the course work and made my life not miserable during the school.
I am very thank full to Guan-Yuan Chen and Pei-Chen Lee for their support and encouragement during the tough times of my Ph.D. carrier. I thank my seniors Guan-Yuan Chen and Hsia-Wei Liao for their suggestions and encouragement to complete my projects. I thank my fellow mates Huai-Hsuan Chiu, Shu-Han Chang, His-Chun Chao and THeng Li for their help support and help during the course work. I thank all my juniors and admin for their support and help during the administration work.
Words cannot convey my gratitude towards my parents, Malla Reddy and Bhagya Lakshmi. Thank you very much for your support on every little step of this twenty seven years of trek of education, from kindergarten through graduate school, from India to Taiwan. I also thank my brother, Santhosh Reddy and parent-in-laws, Prathap reddy and Lakshmi for their prayers and blessings. This day would not have been possible without their support.
My children, Hiamanshu Reddy and Lahanvi reddy, have continually provided the essential breaks from philosophy and the motivation to accomplish my degree with expediency.
Finally and most importantly, I would like to thank my huasband, Surendhar Reddy. His support, love, patience, and understanding allowed me to achieve the goal of being a PhD.
Words cannot express how grateful I am, to have you in my life. You are my backbone to stand as a PhD- thank you!
doi:10.6342/NTU201804215
iii
Abstract
The dried blood spot (DBS) sampling technique contains numerous advantages compared to the traditional plasma sampling technique. However, due to critical challenges, its applications in real world analysis except in relation to newborn screening are still minimal.
In this dissertation, we propose several approaches to mitigate the DBS associated challenges including low sensitivity and spotted blood volume to increase its applicability in pharmaceutical and metabolomics analysis.
We first reported an ultra-high-performance liquid chromatography-ion booster- quadrupole time-of-flight mass spectrometry (UPLC-IB-QTOF) method for sensitive screening of abused drugs in DBS samples. An 80% acetonitrile solvent with a 5-min extraction by Geno grinder was used for sample extraction. A Poroshell column was used to provide efficient separation, and under optimal conditions, the analytical times were 15 and 5 min in positive and negative ionization modes, respectively. Ionization parameters of both electrospray ionization source and ion booster (IB) source containing an extra heated zone were optimized to achieve the best ionization efficiency of the investigated abused drugs. In spite of their structural diversity, most of the abused drugs showed an enhanced signal response with the high temperature ionization from an extra heated zone of IB source. Compared to electrospray ionization, the ion booster (IB) greatly improved the detection sensitivity for 86% of the analytes by 1.5 to 14-fold, and allowed the developed method to detect trace amounts of compounds on the DBS cards.
The validation results showed that the coefficients of variation of intra-day and inter-day precision in terms of the signal intensity were lower than 19.65%. The extraction recovery of all analytes was between 67.21 and 119.38%. The limits of detection of all analytes
doi:10.6342/NTU201804215
iv
were between 0.2 and 35.7 ng/mL. The stability study indicated that 7% of compounds showed poor stability (below 50%) on the DBS cards after 6 months of storage at room temperature and -80 °C. The reported method provides a new direction for abused drug screening using DBS.
In order to improve the DBS applicability in drug monitoring, we developed a post column infused-internal standard (PCI-IS) combined with liquid chromatography- electrospray ionization-mass spectrometry (LC-ESI-MS/MS) method for the simultaneous quantification of 6 HIV medicines including tenofovir, emtricitabine, cobicistat, darunavir, ritonavir and elvitegravir for blood concentration estimation in DBS samples. Darunavir-d9 was selected as the PCI-IS for both blood estimation and drug quantification. Whole blood spots were extracted with 70% methanol for 10 min and compounds were separated by a T3 C18 column within 9.5 min with optimized gradient profile. The method was validated within the concentration range of 2.5–2500 ng/mL for all the drugs. The developed method fulfilled the FDA and EMA validation criteria. All the analytes were stable at the tested storage conditions except for cobicistat which degraded up to 25% in DBSs at room temperature within 7 days. Linear correlation coefficients between paired DBS and plasma sample concentrations were used to predict plasma concentrations from DBSs. Bland−Altman plots showed above 95% agreement between predicted plasma and measured plasma concentrations, confirming the suitability of DBSs for cART monitoring.
DBS-based metabolomics analysis is a powerful tool for investigating new biomarkers for clinical use. To improve data quality for DBS-based metabolomics studies, we developed a PCI-IS assisted LC-ESI-MS/MS analysis method. An efficient sample preparation protocol with 80% acetonitrile as the extraction solvent was first established to improve the metabolite recovery. The PCI-IS assisted LC-ESI-MS method was used to
doi:10.6342/NTU201804215
v
simultaneously estimate the blood volume and correct the signal change caused by ion source contamination and the matrix effect to evaluate the spot volume effect and hematocrit (Hct) variation effect on target metabolites in DBSs. D8-phenylalanine was selected as the single PCI-IS to correct the matrix effect. For calibration of errors caused by the blood volume difference, 95% of the test metabolites showed good correlation between spot volume and signal intensity after PCI-IS correction. The spot volume was further calibrated by the same PCI-IS. Investigation of the Hct variation effect on target metabolites revealed that it affected the concentrations of metabolites in the DBS samples depending on their abundance in the red blood cell (RBC) or plasma; it is essential to pre- investigate the distribution of metabolites in blood to minimize the comparison bias in metabolomics studies. The PCI-IS-assisted strategy is anticipated to improve data quality for metabolomics studies using DBSs and benefit various clinical research applications.
In conclusion, we demonstrated that UPLC-IB-QTOF and PCI-IS assisted LC- ESI-MS/MS analytical methods could solve the low sensitivity and spotted blood volume challenges of DBS sampling technique and could increase the it’s applicability in real world analysis. We anticipate that these developed methods could improve the simplicity and accuracy for forensic, pharmaceutical and meabolomics analysis and benefit precision medicine.
Key words: Dried blood spot, drug abuse, ion-booster, anti-HIV drugs, post column infused internal standard, blood volume, Hematocrit effect, DBS-based metabolomics
doi:10.6342/NTU201804215
vi
Contents
ACKNOWLEDGEMENT ... II ABSTRACT ... III TABLE CONTENT ... IX FIGURE CONTENT ... X LIST OF ABBREVIATIONS ... XII
CHAPTER 1 INTRODUCTION ... 1
1.1 Pharmaceutical and metabolomics analysis ... 2
1.2 Dried Blood Spot ... 2
1.2.1 DBS analysis methods... 3
1.2.2 DBS clinical applications ... 4
1.2.3 Challenges associated with DBS sampling technique for clinical applications... 6
1.3 Research aim of this dissertation ... 8
CHAPTER 2 SENSITIVE SCREENING OF ABUSED DRUGS IN DRIED BLOOD SAMPLES USING ULTRA-HIGH-PERFORMANCE LIQUID CHROMATOGRAPHY-ION BOOSTER-QUADRUPOLE TIME-OF-FLIGHT MASS SPECTROMETRY (UHPLC-IB-QTOF-MS) ... 10
2.1 Introduction ... 11
2.2 Experimental section ... 14
2.2.1 Standards and reagents ... 14
2.2.2 UHPLC-IB-QTOF-MS ... 15
2.2.3 Sample collection ... 15
2.2.4 Sample preparation ... 16
2.2.5 Validation... 16
2.3 Results and discussion ... 18
2.3.1 Sample preparation method development ... 18
2.3.2 LC-QTOF-MS method development ... 19
2.3.3 Discussion ... 22
2.4 Conclusions ... 23
2.5 Tables ... 25
2.6 Figures... 38
CHAPTER 3 SIMULTANEOUS QUANTIFICATION OF 6 HIV MEDICINES ON DRIED BLOOD SPOTS BY POSTCOLUMN INFUSED-INTERNAL STANDARD METHOD COMBINED WITH LC-ESI-MS ... 43
3.1 Introduction ... 44
doi:10.6342/NTU201804215
vii
3.2 Experimental section ... 46
3.2.1 Chemicals and Materials ... 46
3.2.2 UHPLC-ESI-MS system ... 47
3.2.3 Preparation of stock and quality control samples ... 48
3.2.4 DBS sample preparation ... 49
3.2.5 Plasma sample preparation ... 49
3.2.6 PCI-IS for blood volume estimation on DBS cards and for drug quantification ... 49
3.2.7 Method validation ... 50
3.2.8 Clinical Sample Collection ... 52
3.2.9 Data and Statistical Analysis ... 52
3.3 Results and discussion ... 53
3.3.1 Optimization of Analytical method ... 53
3.3.2 Selection of PCI-IS and its utility for both blood volume estimation and correction and for drug quantification ... 55
3.3.3 Method validation ... 56
3.3.4 Correlation between the quantification results of DBSs and plasma sampling ... 57
3.4 Conclusions ... 59
3.5 Tables ... 60
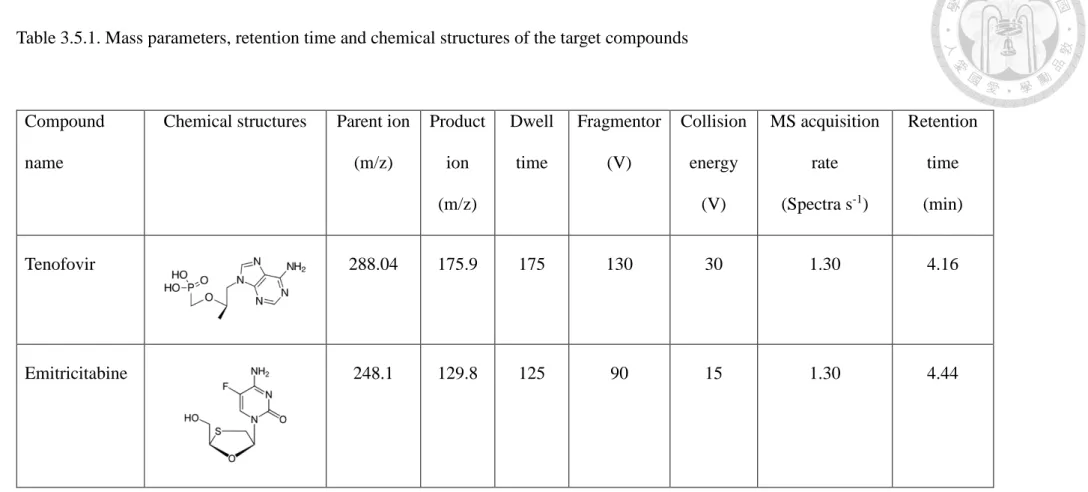
Table 3.5.1. Mass parameters, retention time and chemical structures of the target compounds ... 60
3.6 Figures... 69
CHAPTER 4 AN IMPROVED DBS-BASED METABOLOMICS ANALYSIS BY POST COLUMN INFUSED-INTERNAL STANDARD ASSISTED LIQUID CHROMATOGRAPHY-ELECTROSPRAY IONIZATION MASS SPECTROMETRY METHOD ... 75
4.1 Introduction ... 76
4.2 Experimental section ... 78
4.2.1 Chemicals and materials ... 78
4.2.2 PCI-IS assisted LC-ESI-MS analysis ... 79
4.2.3 Metabolomic profiling ... 80
4.2.4 DBS sample preparation procedure ... 80
4.2.5 PCI-IS method for the estimation of blood volume on DBS cards and matrix effect correction ... 81
4.2.6 Preparation of DBS sample for evaluation of Hct variation effect ... 82
4.2.7 Data analysis ... 82
4.3 Results and discussion ... 83
4.3.1 Method optimization ... 84 4.3.2 Using the PCI-IS to minimize the lipid accumulation effect on method robustness
85
doi:10.6342/NTU201804215
viii
4.3.3 Using the PCI-IS method to estimate the blood volume and calibrate Blood volume
difference caused errors ... 87
4.3.4 Evaluation of Hct variation effect on target metabolites ... 88
4.4 Conclusions ... 91
4.6 Figures... 94
CHAPTER 5 SUMMARY AND PERSPECTIVE ... 101
5.1 Summary and Perspective ... 102
CHAPTER 6 REFERENCES ... 104
PUBLICATION LIST ... 114
doi:10.6342/NTU201804215
ix
Table content
Table 2.5.1. LC–MS/MS parameters for the abused drugs and their metabolites. ... 25 Table 2.5.2. Validation results of abused drugs and metabolites including LOD, intra-
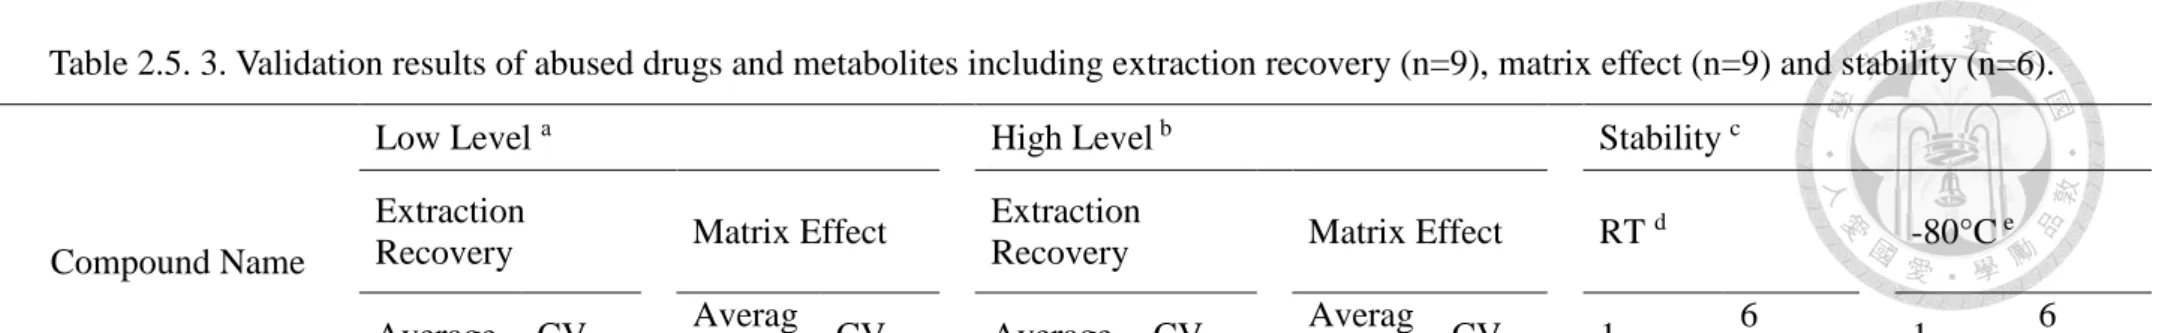
day (n=9) and inter-day (n=9) precision. ... 29 Table 2.5. 3. Validation results of abused drugs and metabolites including extraction
recovery (n=9), matrix effect (n=9) and stability (n=6). ... 33
Table 3.5.1. Mass parameters, retention time and chemical structures of the target
compounds ... 60 Table 3.5.2. Selection of PCI-IS by evaluating the quantification accuracy and precision
using calibration curve generated with five different isotope labelled
internal standards as PCI-IS (n=30). ... 62 Table 3.5.3. Blood volume estimation accuracy of the PCI-IS method. ... 64 Table 3.5.4. Calibration curve, limit of detection (LOD) and limit of quantification
(LOQ) of AR drugs in DBS samples. ... 64 Table 3.5.5. Intra-day, inter-day precision and accuracy, extraction recovery (ER) and
matrix effect (ME) of all drugs.a ... 65 Table 3.5.6. Stability of 6 AR drugs at different conditions. (A) Stability of 6 AR drugs
in whole blood samples at room temperature (RT) for 2 and 4 hours and at 4
oC for 24 and 48 hours. (B) Short-term and long-term stability of 6 AR drugs in DBS samples stored at RT, 4 oC and -20 oC for 1, 7 and 30 days.
(C) Post preparation stability of 6 AR drugs stored at 4 oC in auto sampler for 48 hours and at -20 oC for 1 week. All the conditions were set according to the sample collection and analysis. ... 66
Table 4.5.1. Mass parameters, MRM transitions and metabolomics pathways of targeted metabolites. ... 92 Table 4.5.2. Extraction efficiency and repeatability of six extraction solvents evaluated
by untargeted metabolomics analysis. ... 93
doi:10.6342/NTU201804215
x
Figure content
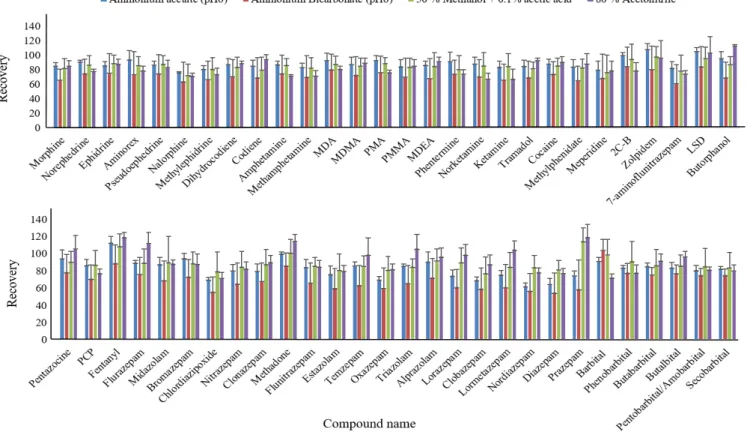
Figure 2.6.1 Extraction recoveries of 57 abused drugs obtained by different extraction solvents (n=9). The spiking concentration for all the abused drugs was 2 µg/mL. ... 38 Figure 2.6.2 Extraction recoveries of 57 abused drugs obtained from 1, 3 and 5 mins of
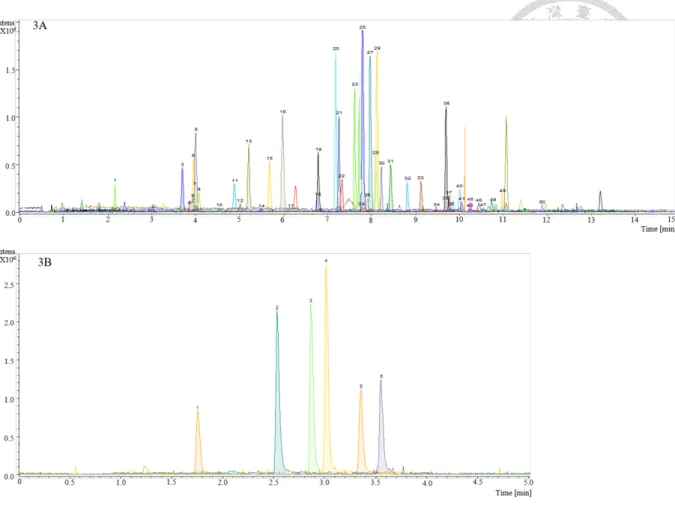
extraction by Geno grinder (n=9). The spiking concentration for all the abused drugs was 2 µg/mL. ... 39 Figure 2.6.3 Extraction ion chromatograms of DBS samples obtained under optimized
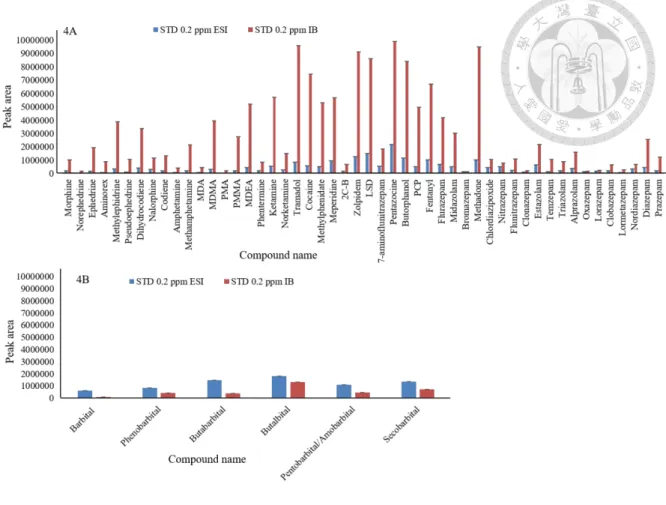
conditions in A) positive and B) negative ionization mode. The spiking concentration for all the abused drugs was 0.2 µg/mL. Peak number was given by compound retention time from positive and negative separation modes. ... 40 Figure 2.6.4 Comparison of signal intensities obtained by ESI and IB. Spiking
concentration for all the abused drugs was 0.2 µg/mL. ESI parameters:
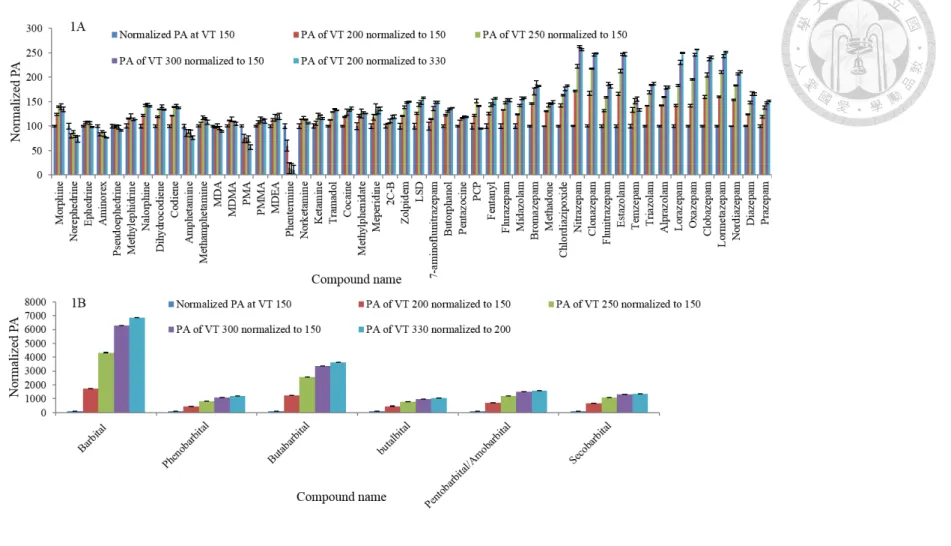
endplate offset voltage 500 V, capillary voltage 4500 V (positive ionization mode), 3000 V (negative ionization mode), dry gas flow 12 L/min, dry temperature 250 °C, nebulizer gas 36 psi. IB parameters: end plate offset voltage 400 V, charging voltage 300 V, capillary voltage 1000 V, dry gas flow 4 L min-1, nebulizer flow 60 psi, dry temperature 200 °C, vaporizer temperature 150 °C and sheath gas flow 150 L/hr. Tuning parameters including hexapole RF 100 Vpp, collision RF 700 Vpp, transfer time 40 µs, and pre-pulse storage 10 µs were the same for both the ESI and IB sources. ... 41 Figure 2.6.5 Effect of vaporizer temperature (VT) in the IB on signal improvement.
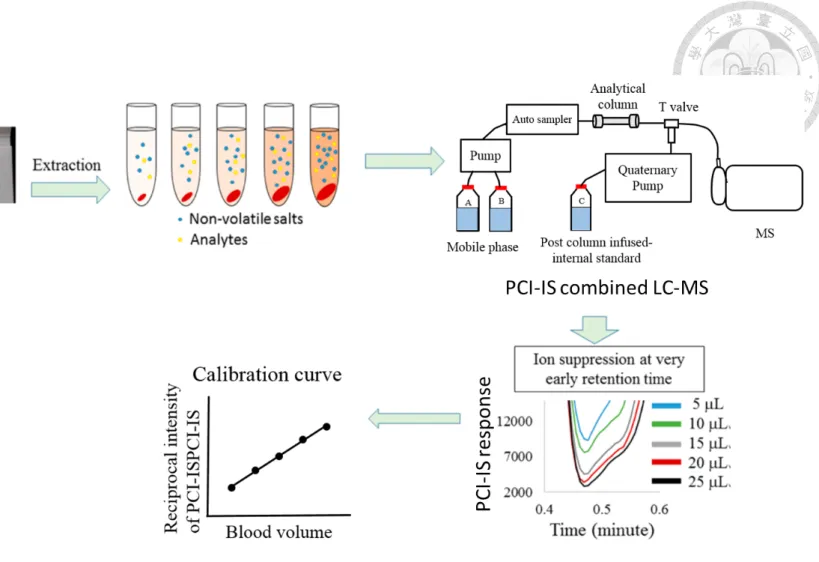
Values are shown as analyte response (PA) normalized to the results obtained from VT 150. The spiking concentration for all the abused drugs was 0.2 µg/mL. ... 42 Figure 3.6.1 Concept of blood volume estimation by PCI-IS. (Modified from ref 27) . 69 Figure 3.6.2 Schematic representation of the study design. ... 70 Figure 3.6. 3 MRM Chromatograms of (A) tenofovir, (B) emtricitabine , (C) cobicistat,
(D) darunavir, (E) ritonavir and (F) elvitegravir from DBS sample obtained under optimal LC-MS/MS conditions. The concentration of all the drugs
doi:10.6342/NTU201804215
xi
including TFV/FTC/COBI/DRV/RTV/EVG were 2.5/5/5/10/10/20 ng/mL ... 71 Figure 3.6.4 Calibration curve of for estimation of the blood volume on the DBS card
by using blood volume and reciprocal PCI-IS intensity. ... 72 Figure 3.6.5 correlation between paired DBS and plasma samples for (A) tenofovir
(TFV) (B) emtricitabine (FTC) (C) cobicistat (COBI) (D) darunavir (DRV) (E) ritonavir (RTV) and (F) elvitegravir (EVG). ... 73 Figure 3.6. 6 The Bland-Altman plots for the predicted plasma concentrations for (A)
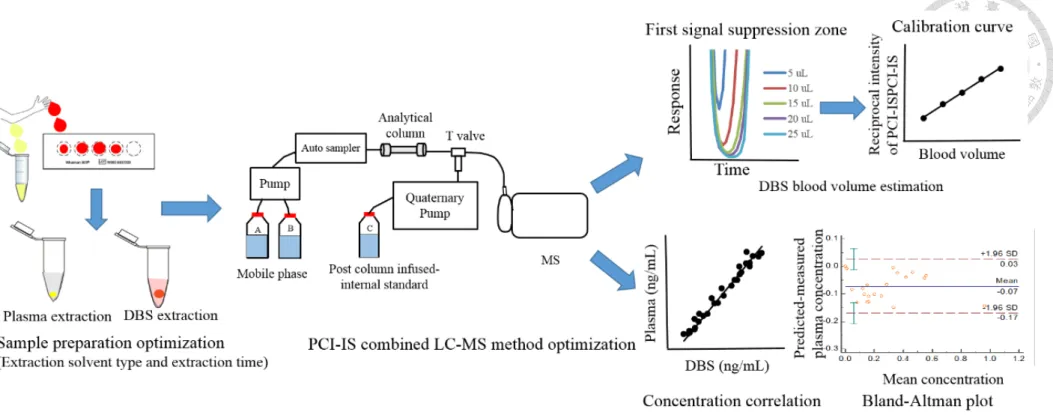
tenofovir (TFV) (B) emtricitabine (FTC) (C) cobicistat (COBI) (D) darunavir (DRV) (E) ritonavir (RTV) and (F) elvitegravir (EVG) with the measured plasma concentrations. The mean (blue line), the upper and lower LoAs (95% CI, dashed redlines) are also indicated. ... 74 Figure 4.6.1 Schematic representation of the study design. A) Sample extraction
optimization during untargeted metabolomics analysis using LC-QTOF. B) PCI-IS strategy for blood volume estimation of samples on DBS cards and calibration of blood volume difference-caused errors. C) Evaluation of Hct variation effect on target metabolites. ... 94 Figure 4.6.2 The overlaid total ion chromatograms of DBS (green color) and plasma
(red color) samples obtained from precursor ion scan m/z 184. ... 95 Figure 4.6.3 Effect of Hybrid SPE on the extraction recoveries of the target metabolites.
... 96 Figure 4.6.4 Effect of the PCI-IS on improving method robustness evaluated by
comparing the relative standard deviation of target metabolites obtained by 50 continuous analyses of the same DBS extract. ... 97 Figure 4.6.5 Calibration curve of blood volume and reciprocal PCI-IS intensity for the
estimation of the blood volume on the DBS card. ... 98 Figure 4.6.6 Normalized signal intensity of metabolites obtained by different blood
volume calculated (A) with and (B) without PCI-IS calibration. ... 99 Figure 4.6.7 Evaluation of the Hct variation effect on target metabolites. ... 100
doi:10.6342/NTU201804215
xii
List of Abbreviations
AR drugs - Anti Retro Viral drugs
cART - combined Anti Retro Viral Therapy CI - Confidence Intervals
CV - Co-efficient of Variation DBS - Dried Blood Spot ESI - Electro Spray Ionization ER - Extraction Recovery Hct - Hematocrit
HQC - High Quality Control concentration IB - Ion Booster
LC-ESI-MS/MS - Liquid Chromatography-Electro Spray Ionization-Mass Spectrometry
LoAs - Limit of Agreements LOD - Limit Of Detection LOQ - Limit of Quantification
LQC - Low Quality Control concentration
ME - Matrix Effect
MRM - Multiple Reaction Monitoring
MQC - Medium Quality Control concentration PCI-IS - Post Column Infused-Internal Standard RSD - Relative Standard Deviation
RT - Room Temperature
doi:10.6342/NTU201804215
xiii
UHPLC-IB-QTOF - Ultra-High-Performance Liquid Chromatography-Ion Booster- Quadrupole Time-Of-Flight
VT - Vaporizer Temperature
doi:10.6342/NTU201804215
1
Chapter 1
Introduction
doi:10.6342/NTU201804215
2
1.1 Pharmaceutical and metabolomics analysis
Over the past few decades, pharmaceutical and metabolomics analysis have been applied to understand the therapeutic and toxic effects of drugs 1. They have also been used for the estimation of a wide range of metabolites to generate new insights on disease diagnosis, investigating physiological status, interpreting the pathways in disease states, and finding new biomarkers 2-4 .
The most common bio-fluid sample types used for pharmaceutical and metabolomics studies are plasma or serum, urine, and recently, dried blood spots (DBS)
5-8. However, invasive blood collection procedures that must be followed by plasma or serum preparation requires professional training and sophisticated facilities. Most importantly, infection risks of contagious diseases during sample handling of such bio- fluids further accelerated the growing attention of the dried blood spot sampling technique for clinical monitoring.
1.2 Dried Blood Spot
In 1913, for the first time, Ivar Bang described a dried blood matrix as an alternative sampling method. This alternative sampling method, based on collecting blood spots on cellulose paper and drying them, is called “dried blood spot” or DBS testing 9. Later in 1963, Robert Guthrie used this technique for neonatal screening to detect inborn errors of metabolism, phenylketonuria 10. Since then, the use and analysis of DBSs has been further applied towards more than thirty disorders and saved many lives in both developed and developing countries 11.
Compared to other bio-fluids, the DBS sampling technique is minimally invasive, requires small blood volumes (approx. <50 µL), is inexpensive and has a higher analyte stability. Moreover, the possibility of self-sampling at home with minimal training, and
doi:10.6342/NTU201804215
3
transportation through mail, allows its utilization even in resource-poor settings. The DBS sampling technique has been widely applied for neonatal screening, epidemiological disease surveillance, and is also gaining attention in preclinical drug development, toxicokinetic and pharmacokinetic (PK) studies, clinical pharmacology, targeted and nontargeted metabolic profiling, therapeutic drug monitoring (TDM), and forensic toxicology11. With the inherent advantages of the DBS sampling technique compared to the plasma based strategies, DBS based assays may play a critical role in precision medicine for the analysis of biomarkers or pharmaceuticals for disease prevention and treatment.
1.2.1 DBS analysis methods
For decades, chromatography and mass spectrometry have been utilized as the major tools in DBS analysis for pharmaceutical and metabolomics analysis 11. In 1976, the first application of mass spectrometry (MS) to DBS analysis was reported for fatty acid determination by direct chemical ionization 12. Later in the mid-1980’s, gas chromatography (GC) was the technique of choice for the separation and analysis of volatile small molecules, and derivatized fatty acids were measured from DBS samples using GC-MS13. After the electrospray ionization (ESI) method became commercially available, DBS based newborn screening laboratories began to use liquid chromatography-tandem mass spectrometry (LC-MS/MS) techniques. Currently, about 121 distinct biomarkers were determined from DBS samples utilizing MS technology encompassing both LC-MS/MS and GC-MS/MS 14.
However, due to its limited applicability for gas soluble, volatile and heat resistance small molecules (often derivatization is required to turn non-volatile molecules to volatile), GC was only utilized moderately compared to LC. Moreover, the improved
doi:10.6342/NTU201804215
4
specificity and sensitivity with a significantly faster analysis afforded by LC-MS/MS methods offers additional benefits for the analysis of blood spot analysis compared to GC-MS14. DBS analysis incorporated with two dimensional chromatography (2D-LC- MS/MS) and on-line sample extraction improves analytical sensitivity, quantitation accuracy, and reduces matrix and carry-over effects 15-16. The sensitivity of DBS assays for both polar and non-polar analytes were also enhanced by the advances in ion source technology 17-18. The compound specific transitions used for both selective/multiple reaction monitoring (SRM/MRM) modes in MS/MS detection have advanced the DBS assay specificity remarkably along with improving linearity and limits of detection19.
1.2.2 DBS clinical applications
The DBS sampling technique has been widely applied for large scale neonatal screening and microbiological and epidemiological disease surveillance. Recently it is gaining attention in preclinical drug development, PK, and TDM, clinical pharmacology, targeted and non-targeted metabolic profiling, forensic toxicology, and doping or environmental contaminant control
The use of DBS in preclinical studies results in a reduction in the volume of blood collected, which has a significant impact on animal studies. Using the DBS sampling technique, the number of rodents needed for each study can be reduced by up to 75%.
Moreover, DBS sampling in preclinical studies contributes to high quality data because more time points can be added without the need for additional rodents. Therefore, the DBS sampling technique is highly suitable for the collection of samples during preclinical PK and TK studies. DBS sampling agrees with the principles of the 3R’s (replacement, reduction and refinement), as fewer animals are needed 20-21.
Application of DBS sampling is an emerging technique for TDM. TDM can be
doi:10.6342/NTU201804215
5
performed either by monitoring the drug, the biomarker, or their metabolites or, monitoring the viral load after administering the drugs for viral infections directly on the DBS 11. Monitoring drug efficacy ensures early detection of emerging drug resistance (for example in HIV), and can promote a transition to a different drug 11. TDM assays for drugs are usually performed in serum or plasma, obtained by venous blood sampling. Due to its numerous advantages, DBS sampling could be a favorable alternative. Nevertheless, the interpretation of drug concentration measurements for TDM are usually based on reference ranges established in plasma or serum samples. Therefore, there is a need to convert the information obtained from DBS to plasma levels. The DBS sampling technique has been applied for the analysis of a wide range of therapeutic drugs for TDM including: ACE inhibitors, analgesics, antibiotics, antiepileptic drugs, antidepressants, anthelmintic drugs, antimalarial drugs, antifungal drugs, antiretroviral drugs, diuretic drugs, histamine H2-receptor antagonists, immunosuppressant drugs, chemotherapeutic drugs, statin, β-blockers and μ-opioid agonists 22.
For forensic toxicology analysis, whole blood is an important specimen, because it provides information on the type of substances and the amount of substances in users at the time of collection 23. Since DBS is a dried form of whole blood and only requires a few micro liters for analysis, using this sampling technique for forensic toxicology may be beneficial in cases involving highly decomposed bodies, or in which fluids are minimal.
Additionally DBS is a quick sampling technique which is especially important in cases which analyze samples containing analytes with short lifetimes, such as heroin and its metabolite, 6-acetylmorphine (6-AM) 24.
DBS-based metabolomics is an emerging technique towards precision medicine.
The developments in this rapidly developing field may bring about many contemporary discoveries, among which are metabolite-biomarkers for diseases. DBS represents an
doi:10.6342/NTU201804215
6
alternative as it overcomes many of the current plasma metabolome issues such as the stability of metabolites in plasma or blood samples after acquisition, invasive sampling collection, and the sophisticated cold chain storage of bio-fluids. Moreover, bio-fluid spotting has been shown to be a potential alternative to conventional plasma in metabolite profiling using UPLC-MS and GC-MS 25-26. Yet, to establish the DBS sampling as a powerful tool for clinical metabolomics applications, a lot more research has to be done to make DBS sample analysis compatible with the gold standard plasma sample analysis.
1.2.3 Challenges associated with DBS sampling technique for clinical applications Despite its simplicity and numerous advantages, the real world application of the DBS sampling technique still faces many critical challenges, including inadequate sampling and contaminated samples with unacceptable quality by self-sampling, lack of sensitivity due to the small sample volumes, variation in the amount of spotted blood volume, the hematocrit (Hct) variation effect and requirement of additional clinical validation to establish DBS methods for clinical practice in replacement of the gold standard plasma sampling 20, 22.
Minimal training in blood spotting and handling of spotted samples can resolve inadequate sampling problems and issues with contamination during sampling. The sensitivity of DBS assays could be improved by developing analytical methods based on MS, either using GC-MS or LC-MS/MS, which is associated with high sensitivity and specificity12. In general, it is difficult to control the spot volume for DBS sampling, unless special sampling equipment is applied, however the application of special equipment for DBS sampling conflicts with its major advantage patient self-sampling and cost effectiveness, and may not be feasible for clinical practice. Although the spot volume variation problem could be resolved by using a fixed diameter subsample, one potential
doi:10.6342/NTU201804215
7
problem is the Hct variation caused bias. Hct is the volume percentage of red blood cells (RBC) in whole blood and it shows large individual variability between different genders, age, physical status and nutritional conditions of the subjects. Predominantly, Hct affects the viscosity of blood by causing differences in spot formation, spot size, drying time, and homogeneity, which leads to analytical uncertainty in terms of precision, recovery and accuracy; it also further influences the quantification accuracy of clinical samples as the blood to plasma ratio of the drugs varies 20. Therefore, to resolve the effects of spot volume and Hct variation on spot formation, whole spot analysis should be applied.
Recently, Liao et al., developed a post column infused-internal standard (PCI-IS) method to estimate and calibrate the blood volume on DBS cards 27. The developed method estimated the blood volume by measuring the total salts in blood samples using the PCI- IS. The developed method is able to facilitate whole spot analysis.
In clinical practice, plasma sampling has been the gold standard for many decades and many databases on drug monitoring and biomarker identification and quantification were established using data from plasma samples. Therefore, investigating the concentration relationships between DBS and plasma samples is important when DBS samples are utilized for the replacement of plasma measurements. Since the main difference between these two sampling techniques are the composition of sample, direct correlation of DBS and plasma concentrations could display large deviations. Two main factors that cause the large deviation in correlating DBS and plasma concentrations are Hct variation and plasma to whole blood drug distribution ratio. Emmons and Rowland proposed an equation to bridge the concentration gap between plasma and DBS samples on the basis of blood-to-plasma drug concentration ratio, Hct value and unbound fraction in plasma 28. Recently, several bridging studies were developed for anti-HIV, anti-cancer, antiepileptic and antidepressant drugs to establish the concentration relationships between
doi:10.6342/NTU201804215
8
DBS samples and plasma samples 29-32. Therefore, it is necessary to perform clinical validation when DBS samples are being used instead of plasma samples.
1.3 Research aim of this dissertation
The DBS sampling technique contain numerous advantages compared to the traditional plasma sampling technique. However, due to the critical challenges associated with the DBS sampling technique, its applications in clinical practice, especially in TDM, forensic toxicology and metabolomics are still minimal. Resolving the critical challenges associated with the DBS sampling technique, would allow it to be widely utilized for various clinical fields.
In this dissertation, I will discuss the approaches which we used to mitigate the DBS associated challenges to increase its applicability in pharmaceutical and metabolomics analysis for clinical practice.
Due to the small sample volumes used for DBS, sensitivity is the major challenge in developing DBS based methods. In general, mass based LC-MS/MS platforms are commonly used for DBS based methods to improve the sensitivity and specificity of the assay. But for certain drugs with very low therapeutic concentrations, general optimization of LC-MS parameters may not be sufficient to improve the method sensitivity. Moreover, improvement of compound sensitivity in MS depends upon the amount of ionized analyte ions that enters into the detector, improvements in ionization efficiency increases the assay sensitivity. Therefore, in the second chapter we discussed the strategy that incorporates the ion-booster (IB) source to improve assay sensitivity for wide range abused drugs in DBS samples.
doi:10.6342/NTU201804215
9
The two critical factors of variation in Hct effect and spot volume associated with DBS sampling technique largely influences the applicability of the DBS sampling technique in clinical practice. Therefore, in the third and fourth chapters of this thesis we discussed resolving these issues by developing the PCI-IS assisted LC-ESI-MS/MS method for both pharmaceutical and metabolomics analysis using DBS samples. In the third chapter we developed an accurate method for the simultaneous quantification of 6 anti-HIV drugs in DBS samples. Correlated concentrations between DBS and plasma demonstrate the suitability of DBSs for clinical monitoring. In the fourth chapter we developed an analytical platform for DBS-based metabolomics studies to improve their data quality. Through developing effective and accurate methods for DBS-based metabolomics studies, we anticipate the application of the DBS sampling technique to more clinical applications.
doi:10.6342/NTU201804215
10
Chapter 2
Sensitive screening of abused drugs in dried
blood samples using ultra-high-performance
liquid chromatography-ion booster-quadrupole
time-of-flight mass spectrometry (UHPLC-IB-
QTOF-MS)
doi:10.6342/NTU201804215
11
2.1 Introduction
Drug abuse is an increasing global social burden. Most social problems are associated with drug abuse, including sexual assault, child abuse, suicide, murder, traffic accidents, and violence. The increase of drug abuse rates is a global problem. Globally, the occurrence of drug abuse including opioid, cocaine and amphetamine drugs was 5.2%
(range: 3.5 to 7.0%) in the 15 to 64-year-old population from 2009 to 2012 33. In 2013, the estimated rate of drug abuse including cocaine, hallucinogens, and nonmedical use of prescription-type sedatives in the United States was 9.4% of the population aged 12 or older 34. Therefore, it is important to have efficient and effective screening methods for drug-related crime and clinical management.
Several analytical methods have been developed to analyze abused drugs in biological samples include urine and whole blood 33, 35-38. Currently, urine is the most commonly used biological fluid for drug testing. However, adulteration of urine samples may give false positive results, and it is not possible to obtain urine samples in the case of death. Although blood samples avoid certain limitations of urine samples, the invasive collection and the storage and handling of whole blood samples limit the wide application of this sampling method. Additionally, blood collection may cause the transmission of some diseases such as HIV, hepatitis, and other blood-borne viruses 39.
The DBS sampling technique has a long history that can be traced back to 1960, but until recently this technique had not gained great attention in the bioanalysis of adults.
The DBS method spots a small amount of blood on a filter paper card followed by a drying process. The drying process increases the stability of most photosensitive compounds.40-41 Additional advantages of the DBS technique include low biohazard risk during the shipment of samples and decreased invasiveness 39, 42-43. Although the DBS technique is increasingly used in medical care due to its broad advantages, the application
doi:10.6342/NTU201804215
12
of this convenient sampling technique to abused drugs is still rare.
To date, only a few methods have been developed to analyze abused drugs in DBS.
Radioimmunoassays using DBS samples have been used to analyze benzoylecgonine (BZE), a main metabolite of cocaine, in newborns and child-bearing women 44-45. Cocaine and its metabolites have been analyzed in DBS by high-performance liquid chromatography fluorescence 46. One of the main drawbacks of the DBS technique is its sensitivity because only a small amount of blood is spotted on the card. The high sensitivity and selectivity of LC-ESI-MS makes the technique a perfect match for coupling with DBS analysis. Therefore, growing numbers of LC-MS methods have been developed to analyze abused drugs on DBS cards. However, most studies have only included very limited abused drugs such as cocaine, opiates and benzodiazepines 47-49. Recently, Odoardi et al. developed an LC-MS/MS method to analyze opiates, methadone, fentanyl and analogues, cocaine, amphetamines and amphetamine-like substances, but the sample extraction time was not efficient, which may hamper its application to routine screening work50.
Currently, the most commonly used MS platforms to analyze drugs of abuse in biological samples are triple quadrupole and TOF mass spectrometry 35, 51-55. The need for pre-established transition ion pairs and the decreased sensitivity with the increased number of transition ion pairs in multiple reaction monitoring mode are the major limitations of triple quadrupole mass spectrometry 56. Time-of-flight mass spectrometry provides accurate mass measurement at the millidalton (mDA) range as well as high full- scan sensitivity. The high mass accuracy provides the advantage of using exact monoisotopic masses and isotopic patterns for compound identification. This advantage provides an opportunity for extension of the screening targets. However, with respect to the identification of unknown abused drugs in biological samples, TOF-MS can give false
doi:10.6342/NTU201804215
13
positive results when simply identifying by accurate mass 57. Therefore, creating spectral information using a hybrid mass such as QTOF-MS is an effective method for the identification and confirmation of abused drugs. Recently, methods using QTOF-MS have been developed for the screening and confirmation of abused drugs in biological samples 56, 58. Considering the selectivity and sensitivity of LC-QTOF-MS, using this powerful tool will be beneficial for abused drug screening on DBS samples.
This study aims to develop a simple and efficient analytical method to screen a wide range of abused drugs in DBS samples using UHPLC-IB-QTOF-MS. The most commonly used abused drugs, including amphetamines, opioids, cocaine, benzodiazepines, ketamine, lysergic acid diethylamide (LSD) and many other new and emerging abused drugs were selected as our target analytes. Metabolites including norketamine, norephedrine, 7-aminoflunitrazepam, and nordiazepam were also included in this study. To provide sufficient sensitivity for low-concentration drugs in the small quantities of DBS samples, an IB ion source with an extra heated spray zone was applied.
IB uses a controlled vaporizer temperature to enhance ionization efficiency of the target analytes by evaporating the solvent of analyte ions even at high mobile phase flow rates.
As the sensitivity improvement using IB source depends upon the chemical properties and thermal stability of the analytes, this study evaluated the sensitivity improvement for various abused drugs. In addition, this study performed a six-month stability test to investigate the stability of abused drugs on the card. Although improving compound stability is one of the main advantages of the DBS sampling technique, there is no previous research investigating the stability of abused drugs on DBS cards, which limits its use in real-world analysis. To the best of our knowledge, this is the first study developing a simple and efficient UHPLC-IB-QTOF-MS method for a wide range of abused drugs using a DBS sampling technique. This method offers a new approach for
doi:10.6342/NTU201804215
14
abused drug control.
2.2 Experimental section 2.2.1 Standards and reagents
Amphetamine, alprazolam, 7-aminoflunitrazepam, amobarbital, aminorex, bromazepam, butalbital, butorphanol, 4-bromo-2,5-dimethoxyphenethylamine (2C-B), butabarbital, clonazepam, chlordiazepoxide, clobazam, dihydrocodeine, diazepam, ephedrine, estazolam, fentanyl, flurazepam, flunitrazepam (FM2), ketamine, lorazepam, lormetazepam, LSD, methamphetamine, 4-methoxyamphetamine (PMA), 3,4- methylenedioxyamphetamine (MDA), 3,4-methylenedioxymethamphetamine (MDMA), 3,4-methylenedioxy-N-ethylamphetamine (MDEA), para-methoxymethamphetamine (PMMA), meperidine, methadone, midazolam, methylephedrine, methylphenidate, norketamine, norephedrine, nitrazepam, nordiazepam, nalorphine, lorazepam, pentazocine, phentermine, prazepam, pseudoephedrine, secobarbital, triazolam, temazepam, tramadol, and zolpidem were purchased from Cerilliant (Round Rock, Texas, USA). Cocaine hydrochloride, codeine, morphine, pentobarbital, barbital, phenobarbital, and ammonium acetate were purchased from Sigma-Aldrich (St. Louis, MO, USA).
Phencyclidine (PCP) was purchased from Triage®Tox Drug Screen, Biosite, (San Diego, CA, USA). ACN and acetic acid were purchased from Merck (Darmstadt, Germany).
MeOH and DI water were purchased from Scharlau (Spain). Ammonium bicarbonate was purchased from J.T. Baker (Phillipsburg, NJ, USA). All reagents and solvents used were of LC-MS grade.
doi:10.6342/NTU201804215
15
2.2.2 UHPLC-IB-QTOF-MS
The Agilent 1290 UHPLC system consisted of a degasser and a quaternary solvent pump (Agilent Technologies, Santa Clara, CA) coupled with a Bruker maXis QTOF (Bruker, Rheinstetten, Germany) equipped with an IB source. A Poroshell EC-C18 column (2.1×100 mm, 2.7 μm, Agilent) was used for compound separation. The mobile phase was composed of 0.1% acetic acid in DI water (solvent A) and MeOH (solvent B).
The gradient profile used for positive ionization detection was as follows: 0-5 min, 2-20%
B; 5-9 min, 20-60% B; 9–13 min, 60-90%B; 13-15 min 90-95% B; and then re- equilibration of the column for 3 min. The gradient for negative ionization detection was as follows: 0-2.5 min, 25-65% B; 2.5-4 min, 65-85% B; 4-5 min, 85% B. The column re- equilibration time for both modes after each gradient was 3 min. The flow rate was maintained at 0.4 mL min-1, and the sample injection volume was 10 µL. The parameters of the mass spectrometer for both positive and negative ionization mode were as follows:
end plate offset voltage was 400 V, charging voltage was 300 V, capillary voltage was 1000 V, drying gas flow was 4 L/min, nebulizer flow was 60 psi, drying gas temperature was 200 °C, vaporizer temperature was 330 °C and sheath gas flow was 150 L/hr. The mass spectrometer was calibrated daily with 10 mM sodium formate before analysis.
Methyl stearate and hexakis were used as the reference mass for positive and negative ionization modes for mass accuracy correction, respectively.
2.2.3 Sample collection
Whole blood samples were collected from healthy volunteers without medication.
The stock standard solution (10 μg mL-1) was prepared in a mixture of MeOH / DI water (50/50, v/v), and the working standards were diluted with DI water prior to addition to the whole blood samples.
doi:10.6342/NTU201804215
16
2.2.4 Sample preparation
Twenty-five microliters of spiked whole blood were carefully spotted on a Whatman 903 card using a pipette and dried for 2 h at room temperature. After drying, a 6-mm diameter (8.9 ± 1.7 μL blood) card was manually punched from each spot and transferred into a Protein LoBind Eppendorf (Sigma-Aldrich, Hamburg, Germany), to avoid the loss of analytes onto the active surfaces of the Eppendorf. The dried spot was extracted with 200 μL of 80% ACN for 5 min at 1000 rpm using a Geno grinder (SPEX®
Sample Prep (2010), Metuchen, NJ) and subjected to centrifugation at 15,000×g for 5 min. One hundred and seventy microliters of the supernatant were evaporated under nitrogen gas and reconstituted with 150 μL of DI water. After vortexing, the samples were filtered and injected onto the LC system for analysis.
2.2.5 Validation
Qualitative validation tests, including selectivity, limit of detection (LOD), precision, extraction recovery, matrix effect, carryover, and stability, were performed on pre-spiked DBS samples over the suggested therapeutic concentrations. The therapeutic levels listed in Table 2.5.2 were provided by the literature 59.
The selectivity test was performed using six whole blood samples by spotting onto the cards. Aliquots of each drug-free DBS sample were prepared by the sample preparation method described previously. The six drug-free DBS samples were used to check endogenous interference at the same retention time and exact mass of the abused drugs and their metabolites. The LOD of each analyte was signal-to-noise ratio equaled 3 (S/N=3). The intra-day precision and inter-day precision were determined in whole blood samples fortified at low concentration that is limit of quantification (S/N=10) and high concentrations (20 x times to the low concentration) (n=9) before spotting on the cards.
doi:10.6342/NTU201804215
17
Both intra-day and inter-day precision of the analyte retention time (RT) and the signal intensity were expressed as CV (%). The extraction recovery of all analytes was determined by preparing pre-spike DBS samples using drug-free whole blood samples fortified at low and high concentrations before spotting on to the cards and post-spike DBS samples using drug-free whole blood samples spotting on to the cards. After extraction, post-spike DBS samples were fortified with the same concentrations as the pre-spike samples after extraction. The extraction recovery (%) was calculated from the peak area ratio of compounds from pre-spike and post-spike samples, multiplied by 100.
The matrix effect was evaluated in drug-free DBS samples fortified at low and high concentrations after extraction and standard samples with the same concentrations. The matrix effect (%) was calculated from the peak area ratio of compounds spiked in the matrix to the standard compounds, multiplied by 100. The stability test was performed on whole blood samples fortified at 0.2 µg mL-1. The fortified samples were spotted on the DBS card and allowed to dry overnight at room temperature (rt). The dried DBS samples were stored in sealed bags containing desiccant to avoid humidity and contamination at rt and -80 °C for six months to evaluate the compound stability on DBS cards. In addition, the DBS samples for the one-month stability test were prepared by the same protocol one month before the end of the six months and stored at rt and -80 °C. After six months, all the samples, including freshly spotted DBS samples, were prepared using the sample preparation method described previously. The stability of the compounds was evaluated by comparing the analyte responses obtained after one or six months of storage with the responses from freshly prepared samples.
doi:10.6342/NTU201804215
18
2.3 Results and discussion
2.3.1 Sample preparation method development
To obtain the highest extraction efficiency for all 57 compounds without compromising the simplicity of the extraction process, the extraction solvent type and extraction time were investigated. Since the studied drugs were ionic compounds, aqueous buffers including ammonium acetate (pH 6), ammonium bicarbonate (pH 6) and 0.1% acetic acid in 50% MeOH were used as the extraction solution. Although these methods could provide satisfactory recoveries (average of 80% for all compounds), the major problem with the aqueous buffer extractions was their inability to denature the protein since the hemoglobin protein was co-extracted along with the abused drugs. To remove the residual protein and minimize its effect on the LC-MS system, a solid-phase extraction (SPE) procedure should be included following the solvent extraction 47, which increases the cost and complexity of the extraction method. To avoid this problem, we tested organic solvents such as 80% ACN for extraction. The results showed that 80%
ACN provided an average of 80% recovery for all the compounds, and 80% ACN was therefore selected as the extraction solvent (Fig. 2.6.1).
Previous studies used ultra-sonication for DBS sample extraction.10, 12. Our preliminary study showed that the optimal extraction time when using ultra-sonication was 30 mins. To speed up the sample preparation process, a Geno grinder offering a fast extraction rate was tested for extraction of abused drugs from the DBS cards. Extraction times using the Geno grinder were investigated, including 1 min, 3 min and 5 min. Fig.
2.6.2 shows the comparison of all the extraction times, and a 5-min extraction time provided recoveries higher than 80% for all the compounds, with CV lower than 20%. A 5-min extraction time was therefore chosen as the optimized extraction time. Compared with previous DBS methods 47-48, 50, this study greatly shortens the sample preparation
doi:10.6342/NTU201804215
19
time.
2.3.2 LC-QTOF-MS method development 2.3.2.1 LC method optimization
To provide efficient screening for a wide range of abused drugs, a Poroshell column, which provides high column efficiency, was employed in this study. A gradient profile using 0.1% acetic acid in DI and MeOH was developed for both positive and negative mode for separation of all analytes. Since structural isomers could not be differentiated using their accurate mass, the gradient profile was designed to provide sufficient separation for three sets of isomers, namely, ephedrine / pseudoephedrine / PMA (m/z 166.1226), clobazam / temazepam (m/z 301.0738) and pentobarbital / amobarbital (m/z 225.1245). Using the optimized gradient profile from the positive mode, the structural isomers of ephedrine / pseudoephedrine / PMA and clobazem / temazepam could be well separated within 15 min. However, pentobarbital and amobarbital could not be separated and were therefore expressed as “pentobarbital / amobarbital” in the identification results. The chromatograms obtained from the DBS samples under the developed conditions from both positive and negative mode are shown in Fig. 2.6.3.
2.3.2.2 Mass parameter optimization
One of the main challenges for DBS sample analysis is the high sensitivity requirement due to the limited quantity of analyte on the card (typically <30 µL). An IB source containing an additional heated spray zone was used to improve the detection sensitivity. Compared to an ESI source, the main drawback of using an IB source is that it is not suitable for thermally unstable compounds and the sensitivity improvement depends upon chemical characteristics of the analytes 60. To examine the limitations of
doi:10.6342/NTU201804215
20
the IB source, analyte responses from both ESI and IB sources was compared to select which provided better sensitivity for the greater number of abused drugs.
Mass parameters for both ESI and IB were optimized to achieve the best detection sensitivity. It was found that ESI source parameters including drying gas, drying temperature, and nebulizer gas greatly affected the ionization of analytes, and tuning parameters including hexapole RF, collision RF, transfer time, and pre-pulse storage, which affects the movement of ions through the channels of QTOF, also significantly affected signal intensities. However, the sensitivity improvement after optimizing these parameters was not sufficient for the compounds with lower therapeutic concentrations, which might be due to insufficient solvation and ion formation of analytes when using ESI as the ionization source.
The working principal of the IB source is similar to the ESI source; however, it contains a heated vaporizer, the charge-HV transfer tube and the additional use of nitrogen as a sheath gas to improve the evaporation and ionization of analytes. In this study, approximately 83% of the analytes showed an enhanced response with the initial conditions of the IB source (Fig. 2.6.4). IB source ionization parameters, including end plate off-set, capillary voltage, charging voltage, nebulizer gas, drying gas, drying temperature and vaporizer temperature (VT), were further optimized, and VT had the most significant effect on the signal intensity of all the parameters (Fig. 2.6.5). After optimizing all the parameters, all the analytes, when including both positive mode and negative mode, showed improvements ranging from 1.5 to 14-fold as compared to the ESI source. With this improvement, approximately 95% of the compounds could be detected at their lower therapeutic levels, which makes the method more suitable for toxic and forensic drug screening.
Our results revealed that combining the IB source with QTOF detection provided
doi:10.6342/NTU201804215
21
sensitive results with lower sample volumes such as that of the DBS sampling technique used in this study. To avoid false detection of abused drugs due to simple comparison of retention time and accurate mass, the optimal LC-QTOF condition was used to establish a spectral library for each compound. Table 2.5.1 shows the retention time, collision energy and respective precursor and product ions of each analyte. The abused drugs could be screened by using their respective retention times and the accurate masses, and further confirmation could be accomplished by comparing their respective spectral information.
2.3.2.3 Method validation
The selectivity test results showed no endogenous interference at the retention times and exact masses of all the abused drugs and their metabolites. The LOD and precision results of all analytes are summarized in Table 2.5.2. The LOD, where the signal to noise ratio equaled 3, was below 36 ng mL-1 for all analytes. The LOD of approximately 96% of analytes was below or within the therapeutic range suggested by literature reports.
The precision was expressed as the RSD of the measurement results. The intra-day (n=9) and inter-day precision (n=9) values of the retention times of all compounds at all tested concentrations were below 0.5%. The intra-day (n=9) and inter-day precision (n=9) values of peak area at all tested concentrations were found to be less than 19.65%. The results of extraction recovery and matrix effect testing are summarized in Table 2.5.3. The average extraction recovery (n=9) of all the compounds at all tested concentrations from the sample preparation method was between 67.21 and 115.14% , and the matrix effect (n=9) was between 68.78 and 119.05%. The stability of all the compounds on the DBS cards stored at rt and -80 °C for one month and six months was evaluated by comparing their responses with those from a freshly prepared DBS card. Although one of the advantage of DBS card analysis is the stability of the compounds on the card, our results
doi:10.6342/NTU201804215
22
revealed that a few compounds, including amphetamine, methamphetamine, and aminorex, showed poor stability (below 50%) after one month of storage at rt. Compared to rt, DBS cards stored at -80 °C showed improved compound stability. Among all the compounds, only approximately 7% of compounds showed poor stability (below 50%) after 6 months at -80 °C. Stabilities of all the compounds at rt and -80 °C are summarized in Table 2.5.3.
2.3.3 Discussion
As the DBS sampling technique provides many advantages, this technique has gained a lot of attention in recent years. One of the advantages of DBS sampling technique is the stability improvement of compounds, but our results revealed that a few compounds still showed poor stability (below 50%) after one month of storage at rt. Although the compound stability was improved due to stopping of enzymatic chemical reactions in dried form, other factors may still affect the stability on DBS cards. As per our results, aminorex and amphetamines including amaphetamine, mehamphtamine were degraded more than 50% at 1 month storage at rt. The possible factors for degradation of aminorex and amphetamines at rt were due to their nature of volatility 61. Slight loss of cocaine and 2C-B may also be due to their volatility at rt 52-53. This study found more than 30% degradation of methylphenidate at rt which might be due to its conversion into metabolite forms at rt 62. Although literature reported that PCP can be stable in blood for at least 2 to 3 years 63, we found PCP degraded more than 20% at all time points and temperatures on DBS cards. Several benzodiazepines including flurazpam, bromazeam, and chlordiazipoxide also showed slight loss when stored at rt, which might be due to their chemical property that causes slight degradation at rt.
doi:10.6342/NTU201804215
23
One of the main challenges of DBS sampling technique in the drug analysis is the Hct caused bias. The variation of Hct between individuals will affect the viscosity and distribution of blood on the card and resulted in quantification bias when using a fixed diameter sampling preparation procedure. In this study, the blood samples were obtained from healthy volunteers and general variations of Hct among healthy individuals were between 5 to 10%. The slight deviation in Hct has minimal influence on the viscosity of the blood. To evaluate the effect of Hct variation on blood among on the fixed diameter sampling, we used weighted factors to measure the blood volume on the 6 mm card. It was found that the differences in sample volume were less than 20% between samples obtained from different individuals (8.9 ± 1.7 μL blood). Moreover this study was not focused on absolute quantification, the Hct effect on quantification bias was therefore merely discussed. Future application of this method for absolute quantification should evaluate the Hct-caused bias more comprehensively.
2.4 Conclusions
The DBS sampling technique provides many advantages for drug screening. This study developed an efficient and sensitive UHPLC-IB-QTOF-MS method for the screening and confirmation of a wide range of abused drugs and their metabolites in DBS.
A simple sample preparation procedure with a 5-min extraction offers high throughput screening potential for the proposed method. By using the IB source, the method sensitivity was greatly improved as compared to the ESI source, which renders the proposed method applicable to the detection of trace amounts of abused drugs on the DBS card. The stability test revealed that a few compounds were not stable on the DBS cards after 6 months of storage at rt and -80 °C. Therefore, the future application of the DBS sampling technique for these particular compounds should issue precautions over the
doi:10.6342/NTU201804215
24
stability issue. We anticipate the proposed method could provide a new direction for abused drug screening.
doi:10.6342/NTU201804215
25
2.5 Tables
Table 2.5.1. LC–MS/MS parameters for the abused drugs and their metabolites.
No Compound name Formula Rta Collision energy (V)
Precursor ion
Product ion 1
Product ion 2
Product ion 3 Basic compounds
1 morphine C17H19NO3 2.23 37 286.1438 201.0901 181.0642 165.0702
2 norephedrine C9H13NO 3.09 15 152.1070 134.0984 117.0707 91.0541
3 ephedrine C10H15NO 3.77 20 166.1226 148.1152 117.0709 133.0895
4 aminorex C9H10N2O 3.91 15 163.0866 120.0838 103.0542 93.0698
5 pseudoephedrine C10H15NO 3.99 20 166.1226 148.1147 133.0897 117.0708
6 nalorphine C19H21NO3 4.06 37 312.1594 270.1102 201.0858 185.0586
7 methylephedrine C11H17NO 4.03 20 180.1383 162.1294 117.0703 147.1046 8 dihydrocodeine C18H23NO3 4.07 37 302.1751 199.0747 245.1169 227.1040
9 codeine C18H21NO3 4.16 37 300.1594 199.0745 241.0842 215.1055
10 amphetamine C9H13N 4.59 10 136.1121 91.0551 119.0859 -
11 methamphetamine C10H15N 4.96 10 150.1277 91.0565 119.0875 -
12 MDA C10H13NO2 5.10 15 180.1019 163.0790 135.0542 105.0703
doi:10.6342/NTU201804215
26
13 MDMA C11H15NO2 5.28 18 194.1176 163.0796 135.0448 105.0702
14 PMA C10H15NO 5.56 10 166.1226 149.0994 121.0654 150.0992
15 PMMA C11H17NO 5.77 15 180.1383 149.0997 121.0678 150.0995
16 MDEA C12H17NO2 6.05 18 208.1332 163.0791 135.0453 105.0703
17 phentermine C12H14ClNO 6.20 10 150.1277 133.1007 91.0537 123.0423
18 norketamine C12H14ClNO 6.80 20 224.0837 125.0170 179.0627 207.0575
19 ketamine C13H16ClNO 6.84 20 238.0993 125.0172 179.0630 220.0891
20 tramadol C16H25NO2 7.23 25 264.1958 153.0068 116.9849 134.9957
21 cocaine C21H23NO5 7.30 30 304.1543 182.1207 105.0338 82.0652
22 methylphenidate C17H21NO4 7.37 25 234.1489 84.0840 174.1272 -
23 meperidine C14H19NO2 7.66 25 248.1645 220.1352 174.1298 -
24 2C-B C15H21NO2 7.80 30 260.0281 227.9782 153.0050 137.0292
25 zolpidem C10H14BrNO2 7.85 35 308.1757 235.1269 263.1182 221.1062
26 7-
aminoflunitrazepam
C19H21N3O 7.94 35 284.1194 135.0920 226.0887 240.0927
27 LSD C16H14FN3O 8.03 35 324.2070 223.1245 208.0970 180.0810
28 butorphanol C20H25N3O 8.13 35 328.2271 310.2187 242.1523 282.1827
29 pentazocine C21H29NO2 8.17 35 286.2165 218.1558 173.0974 159.0810
doi:10.6342/NTU201804215
27
30 PCP C19H27NO 8.26 15 244.2060 159.1198 86.0985 91.0548
31 fentanyl C22H28N2O 8.47 32 337.2274 188.1473 105.0725 134.0958
32 flurazepam C21H23ClFN3O 8.84 30 388.1586 315.0707 288.0556 100.1114
33 midazolam C18H13ClFN3 9.17 35 326.0855 291.1196 244.0308 209.0628
34 bromazepam C14H10BrN3O 9.47 35 316.0080 182.0860 209.0960 261.0000
35 methadone C21H27NO 9.72 20 310.2165 265.1654 247.1460 105.0339
36 chlordiazipoxide C16H14ClN3O 9.72 20 300.0898 282.0777 227.0426 -
37 nitrazepam C15H11N3O3 9.78 30 282.0873 236.0961 268.0846 180.0800 38 clonazepam C15H10ClN3O3 9.81 30 316.0483 270.0551 302.0448 241.0507 39 flunitrazepam C16H12FN3O3 9.86 30 314.0935 268.1011 300.0899 239.0962
40 estazolam C16H11ClN4 10.02 35 295.0745 267.0577 205.0771 240.0432
41 clobazepam C16H13ClN2O2 10.05 25 301.0738 259.0663 224.0927 -
42 triazolam C17H12Cl2N4 10.21 35 343.0512 315.0283 308.0782 239.0350 43 alprazolam C17H13ClN4 10.26 35 309.0902 281.0680 274.1172 255.0638 44 lorazepam C15H10Cl2N2O2 10.24 20 321.0192 275.0133 303.0071 229.0515 45 oxazepam C15H11ClN2O2 10.27 35 287.0582 241.0525 269.0459 231.0676 46 temzepam C16H13ClN2O2 10.44 25 301.0738 255.0714 228.0563 193.0871