Department of Atmospheric Sciences College of Science
National Taiwan University Doctoral Dissertation
DYNAMO Quasi-2-day Convective Disturbances
in the Equatorial Indian Ocean: DYNAMO Observation
Hungjui Yu
Richard H. Johnson, Ph.D.
Advisors: Hung-Chi Kuo, Ph.D., Richard H. Johnson, Ph.D.
107 7
July 2018
ACKNOWLEDGMENT
Dr. Wayne H. Schubert
phy Joe
My deepest gratitude goes to my co-advisor at Colorado State University, Dr.
Richard H. Johnson, who has been providing me with the most insightful and inspiring ideas, not only throughout my time at CSU but also afterward. Without his guidance, I could never have the chance to broaden my horizon.
And I must give the greatest thank to the mentor/friend of mine from CSU, Mr.
Paul E. Ciesielski, for his constant motivation and support not only on my pursuit of better science (and of course, English writing) but also in life. I am immensely grateful for this friendship between generations.
I would also like to thank my friend/officemate from Johnson Research Group, Dr.
James Ruppert, for the wonderful time of scientific discussion and life-sharing (and beer!).
I must also acknowledge the crews of DYNAMO field campaign from all around the world, especially those from the US, Japan, Maldives, and Taiwan, for their tremendous efforts toward the success of this field experiment.
Support for this work has been provided by the Ministry of Science and Technology (MOST) in Taiwan under Grants MOST-102-2917-I-002-109, MOST-103- 2625-M-002-003, MOST-103-2111-M-002-010, MOST-104-2111-M-002-002-MY3, and MOST-106-2119-M-002-016; by National Taiwan University (NTU) under Grant NTU- CESRP-104R7604-1; and by the Office of Naval Research in the US under Grant N62909-15-1-2008.
July 2018
DEDICATION
This dissertation is dedicated to my family, to my loving parents, Dennis and Grace, and my sister and my brother in law, Mimi and Javier,
to my dearest wife Nina, to my lovely son Christopher, lastly, to my late grandmother
who had made all these possible.
ABSTRACT
This study examines the westward-propagating convective disturbances with quasi-2-day intervals of occurrence identified over Gan Island in the central Indian Ocean from mid to late October 2011 during the Dynamics of the Madden-Julian Oscillation (DYNAMO) field campaign. Atmospheric sounding, satellite, and radar data are used to develop a composite of seven such disturbances.
Composites and spectral analyses reveal that: (1) the quasi-2-day convective events comprise westward-propagating diurnal convective disturbances with phase speeds of 10–12 m/s whose amplitudes are modulated on a quasi-2-day time scale on a zonal scale of ~1000 km near the longitudes of Gan; (2) the cloud life cycle of quasi-2- day convective disturbances shows a distinct pattern of tropical cloud population evolution—from shallow-to-deep-to-stratiform convection; (3) the time scales of mesoscale convective system development and boundary layer modulation play essential roles in determining the periodicity of the quasi-2-day convective events; and (4) in some of the quasi-2-day events there is evidence of counter-propagating (westward and eastward) cloud systems along the lines proposed by Yamada et al.
Based on these findings, an interpretation is proposed for the mechanisms for the quasi-2-day disturbances observed during DYNAMO that combines concepts from prior studies of this phenomenon over the western Pacific and the Indian Ocean.
Keywords: quasi-2-day convective disturbance, DYNAMO, Indian Ocean, diurnal, mesoscale convective system, stratiform, boundary layer
ABSTRACT (Chinese Version)
2011 Dynamics of the Madden-Julian Oscillation DYNAMO
DYNAMO
1 10–12 m/s
Gan Island
1000 2
3
4
Yamada
MJO DYNAMO
DYNAMO
CONTENTS
COMMITTEE VERIFICATION LETTER ... #
ACKNOWLEDGMENT ... i
DEDICATION ... iii
ABSTRACT ... iv
ABSTRACT (Chinese Version) ... v
CONTENTS ... vi
LIST OF TABLES... viii
LIST OF FIGURES ... ix
Introduction ... 1
Data ... 7
2.1 Gridded data over the Indian Ocean ... 7
2.2 Gan Island observations ... 8
Analysis Procedures ... 11
3.1 Computation of vertical flux of moist static energy ...11
3.2 Identification of the quasi-2-day convective events ...11
Large-scale Convective Features of the Quasi-2-day Convective Events ... 13
Propagating Convective Waves and Stationary Convective Disturbances ... 16
5.1 Fourier power spectral analysis ... 16
5.2 Separation of diurnal and quasi-2-day oscillations ... 17
5.3 Spatial distribution of convective signals ... 22
5.4 Climatological characteristics of convective signals over the Indian
Ocean ... 22
Composite Features of the Quasi-2-day Convective Disturbances ... 25
6.1 Cloud-top population from brightness temperature ... 25
6.2 Basic fields from Gan radiosonde ... 26
6.3 Composite feature of radiative forcings ... 29
6.4 Derived fields based on Gan radiosonde and AMIE-Gan large-scale objective analysis ... 30
Interpretation of Quasi-2-day Convective Disturbances ... 35
Summary and Concluding Remarks ... 38
APPENDIX A Upper-air Radiosonde Observations and Data Quality Control in DYNAMO ... 42
APPENDIX B Statistical Significance of the Quasi-2-day Convective Disturbances during DYNAMO ... 47
APPENDIX C Chapter 7 Interpretation of Quasi-2-day Convective Disturbances (Chinese Version) ... 50
APPENDIX D Chapter 8 Summary and Concluding Remarks (Chinese Version) ... 52
REFERENCE ... 56
TABLES ... 64
FIGURES ... 68
LIST OF TABLES
Table 3.1. Date and time of the minimum peaks of 6-hourly averaged IRBT over 150- km radius circular region around Gan. The seven most convectively active events with quasi-2-day intervals of occurrence were selected during 15–
31 October 2011 in DYNAMO. LT = UTC + 5. ... 64 Table 3.2. Date and time of the selected maxima in rain accumulation based on hourly S-Pol rain accumulation for the 11 rainiest events during the October 2011–January 2012 period of the DYNAMO campaign. (Table 3 in Zuluaga and Houze 2013) ... 65 Table A.1. DYNAMO site information for the six core stations. Native resolution refers to the vertical time resolution of the data received at NCAR EOL.
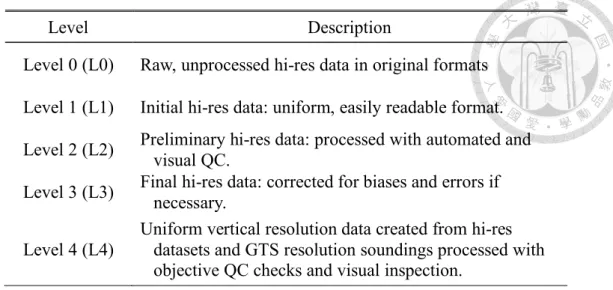
(Table 2 in Ciesielski et al. 2014) ... 66 Table A.2. Post-processing stages for DYNAMO radiosonde dataset with a brief description of the dataset at each level. (Table 5 in Ciesielski et al. 2014) ... 67
LIST OF FIGURES
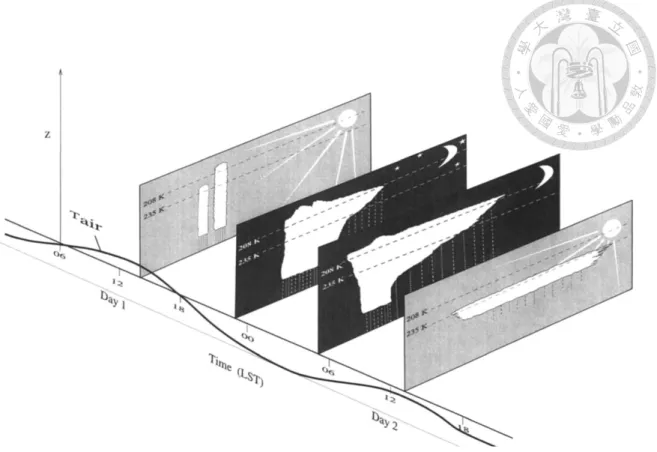
Figure 1.1. The entire TOGA COARE domain during the IOP. The legends beneath the panels refer to the symbols used to represent the observational platforms. The large-scale domain (LSD), the outer sounding array (OSA) and the intensive flux array (IFA) are outlined. (Figure 14 in Webster and Lukas 1992) ... 68 Figure 1.2. (top) Time-longitude diagram of 3-hourly infrared brightness temperature from Japanese Geostationary Meteorological Satellite (GMS) along 1.5- 2.5°S for TOGA COARE period, (Figure 2 in Takayabu et al. 1996) and (bottom) time variations of the averaged brightness temperature over IFA (thicker line) and OSA (thinner line) for December 1992. The vertical dashed lines indicate the 8 quasi-2-day events examined. (Figure 4 in Takayabu et al. 1996) ... 69 Figure 1.3. Schematics for the quasi-2-day variation in TOGA COARE. Straight arrows indicate the vertical air motion and wavy arrows indicate the surface heat flux. (Figure 19 in Takayabu et al. 1996) ... 71 Figure 1.4. Schematic of the 2-day cycle of surface-cloud-radiation interaction for large convective systems. Tair is the surface air temperature. (Figure 18 in Chen and Houze 1997) ... 72 Figure 1.5. Schematics of the time-longitude variation of cold cloud tops of large convective systems during the active phase of the ISO. (a) Spatial variation of the large convective systems within the envelope of the ISO caused by the diurnal behavior of these large systems alone (solid circles <208 K,
dashed circles ~235–260 K). The smallest circle represents the early stage of the system (first afternoon cross-section in Figure 1.4), the largest circle represents the mature stage with the maximum areal extent of cold cloud tops (pre-dawn cross-section in Figure 1.4), and the dashed circles represent the warmer cloud deck (last cross-section in Figure 1.4). (b) The westward-propagating speed of 2-day equatorial inertial gravity waves is added to the westward displacement of the starting location of a new convective system. The pattern in (b) is the sum of the effects of the ISO, 2-day waves and the diurnal cycle of large convective systems. (Figure 19 in Chen and Houze 1997) ... 73 Figure 1.6. Time-longitude diagram of deep convection with cloud-top temperature
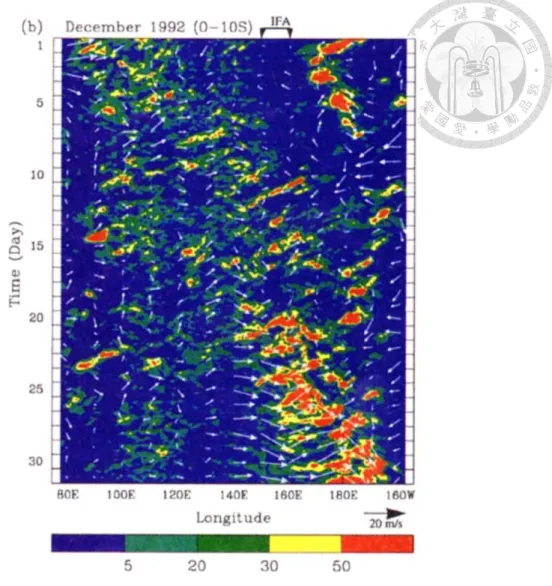
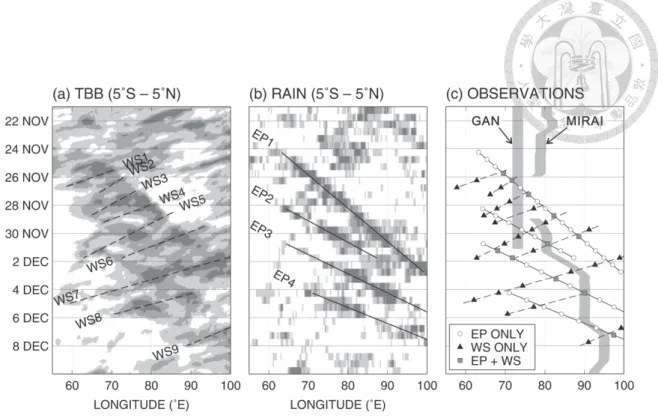
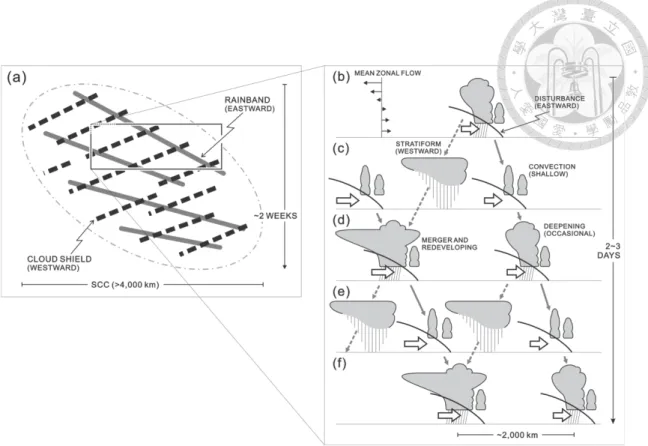
<208 K for December 1992. The contours are the number of pixels colder than 208 K in a 10° latitude band along each longitude grid. The arrows are 850-hPa total wind (m/s) averaged over the 10° latitude band. The position of the IFA is indicated at the top of the figure. (Figure 9b in Chen et al. 1996) ... 74 Figure 1.7. Time-longitude diagrams of (a) the cloud-top temperature and (b) rainfall rate. Solid and dashed lines indicate eastward-propagating precipitating systems (EP1–EP4) and westward-propagating cloud shields (WS1–WS9), respectively. (c) Classification of 12-hourly observational points into three types. The longitude of each point corresponds to the center of the zonal axis in the composite datasets. (Figure 8 in Yamada et al. 2010) ... 75 Figure 1.8. Schematic of the mesoscale structure of the super cloud cluster (SCC) during MISMO, (a) view in the zonal–time section and (b)–(f) series of the zonal–vertical sections. (Figure 15 in Yamada et al. 2010) ... 76
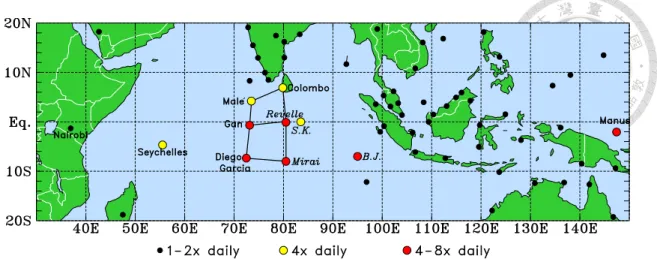
Figure 1.9. DYNAMO–CINDY–AMIE radiosonde observation network for the period October–December 2011, including high-frequency soundings (4 and 8 launches per day; yellow and red dots, respectively) and operational sounding sites (1 or 2 launches per day; black dots). Solid lines indicate the enhanced southern/northern sounding arrays during the SOP in the central IO, which consists of Gan Island (Addu Atoll) and Male, Maldives;
Diego Garcia Island, Colombo, Sri Lanka; and two ship sites at 0°, 80.5°E and 8°S, 80.5°E. (Figure 1 in Johnson et al 2015) ... 77 Figure 1.10. Time-longitude diagram of satellite infrared brightness temperature (K, colored) averaged over 150 km north and south of the latitude of Gan over the IO region from 10 October to 28 December 2011. The blue dashed lines, from left to right, indicate the longitudes of sites at Gan Island (73.15°E), R/V Revelle (80.5°E) and Padang on Sumatra Island (100.35°E).
The ordinate is the date-time in UTC (00Z), and the upper abscissa is the local time zone to Greenwich Mean Time (GMT)... 78 Figure 1.11. Similar to Figure 1.10 except for TRMM rain rate. ... 79 Figure 2.1. The DYNAMO enhanced sounding array (ESA) in the central equatorial IO during DYNAMO SOP. High frequency sounding sites with 8 launches (4 launches) per day are indicated with red (yellow) circles. Most analyses in this study focus on Gan at 0.69°S, 73.15°E. The outer black circle around Gan indicates the 150-km radius. circular region for satellite data averaging and the AMIE-Gan large-scale objective analysis domain. ... 80 Figure 3.1. (a) Time series of IRBT areal percentage in 5 K intervals (%; colored) and 6-hourly running averaged IRBT (K; red solid curve), TRMM 3B42 rain rate (mm/hr; blue solid curve) and adjusted SMART-R surface rain rate
(mm/hr; blue dotted curve) over the 150-km radius circular region around Gan (as indicated in Figure 2.1) during late October 2011. The times of seven selected quasi-2-day (q2d.) convective events are indicated with black dots and labeled with local time at Gan (GMT+5). The criteria for the convectively active events are indicated with IRBT peaks <240 K (red dashed line) and averaged TRMM rain rate peaks >1 mm/hr (blue dashed line). (b) Time series of filtered IRBT signal within a diurnal frequency band (0.9–1.2 day). The dashed black line indicates zero. (c) Same as (b) except for quasi-2-day frequency band (1.6–3 day). Times of low peaks are indicated in both (b) and (c) with black dots and labeled with local time at Gan (GMT+5). Note that the ordinate for IRBT on the left of (a) is in reverse order. And the abscissa indicates the date-time in UTC (00Z). .. 81 Figure 3.2. Images of SMART-R range height indicator (RHI) scans at Gan on 30 October 2011. From (a) to (f), 00:30Z, 01:30Z, 02:30Z, 03:30Z, 04:30Z, and 05:30Z. The averaged rain rate over Gan reached a maximum around 03Z according to Figure 3.1. The azimuthal angle is 147° out to a range of 100 km. Images are available at http://catalog.eol.ucar.edu/cgi- bin/dynamo/research/prod_browse?platform=SMARTR&prod=smartr_D BZ_RHI_147deg&howmany=Use+Start%2FEnd+Dates+-
%3E&start=20111029&end=20111031&submit=retrieve+products... 82 Figure 4.1. Time-longitude diagram of IRBT (K, colored) and TRMM rain rate (green contours for 1 mm/hr) averaged over 150 km north and south of the latitude of Gan over the IO region from 10 October to 10 November 2011. The blue dashed lines, from left to right, indicate the longitudes of sites at Gan Island (73.15°E), R/V Revelle (80.5°E) and Padang on Sumatra Island
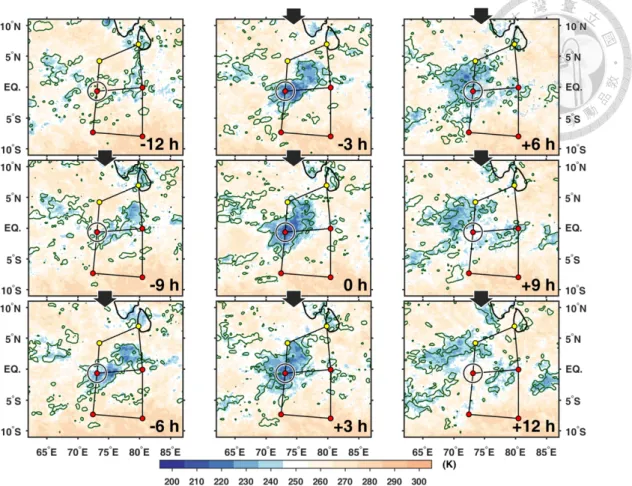
(100.35°E). The red dots along the longitude of Gan Island indicate the time of convective events listed in Table 3.1. The ordinate is the date-time in UTC (00Z), and the upper abscissa is the local time zone to GMT. ... 83 Figure 4.2. Similar to Figure 4.1 except for the quasi-2-day convective events composite. The red dot in the center indicates 0 h of each case. The green hatched contours indicate the TRMM rain rate composite >1 mm/hr, the gray arrows the 850-hPa total wind composite, and the two blue dashed lines, the longitudes of Gan Island (left) and R/V Revelle (right). ... 84 Figure 4.3. Composite IRBT (colored) and TRMM rain rate (green contours for 1 mm/hr) horizontal distributions of the quasi-2-day convective events. The 150-km region around Gan was indicated in a black circle. The times relative to 0 h are indicated on the bottom right in each subfigure. The composites are shown from –12 h to +12 h which comprises the time window of primary convective activity associated with the quasi-2-day events. ... 85 Figure 4.4. Composite time-longitude series of brightness temperature (°C).
Averaging is done from 5°S to 5°N for all but two cases during TOGA COARE (22, 24 Dec. 1992). For these cases, the averaging is done from 10°S to the equator. (Figure 9 in Haertel and Johnson 1998) ... 86 Figure 5.1. Fourier power spectrum of averaged IRBT over the 150-km region around Gan during October-December 2011 (gray dotted) and MJO1 period (black solid). The vertical dashed lines from left to right correspond to the periods of 3, 1.6, 1.2, and 0.9 days, as labeled... 87 Figure 5.2. Fourier power spectrum of averaged brightness temperature over IFA for the period from November 1992 to February 1993 during TOGA COARE.
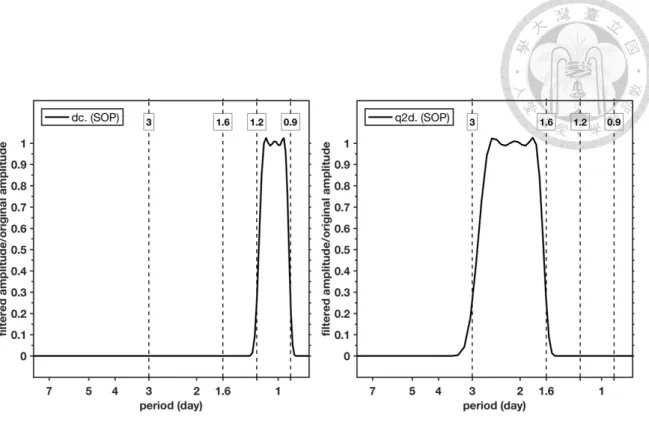
The vertical dotted lines correspond to periods of 1.6 and 3.0 days. (Figure 5 in Haertel and Johnson 1998) ... 88 Figure 5.3. The response functions for diurnal (dc.; left) and quasi-2-day (q2d.; right) frequency bands associated with the Lanczos bandpass filter used in this study. ... 89 Figure 5.4. (a), (b): Time-longitude diagrams of the filtered IRBT variations with (a) diurnal periodicity (0.9–1.2 day) and (b) quasi-2-day periodicity (1.6–3 day) during MJO1. The black contours in both figures indicate the unfiltered averaged IRBT <240 K. (c), (d): as in (a) and (b), except for the filtered TRMM rain rate variations. The black contours here indicate the unfiltered averaged TRMM rain rate >1 mm/hr. In all subfigures, the blue dashed lines, from left to right, indicate the longitudes of sites at Gan Island (73.15°E), R/V Revelle (80.5°E) and Padang on Sumatra Island (100.35°E). The red dots along the longitude of Gan Island indicate the time of convective events listed in Table 3.1. The ordinate is the date-time in UTC (00Z), and the upper abscissa is the local time zone to GMT. ... 90 Figure 5.5. Time-longitude diagram of NOAA High Resolution SST (°C, colored) provided by the NOAA/OAR/ESRL PSD (data available at https://www.esrl.noaa.gov/psd/data/gridded/data.noaa.oisst.v2.highres.ht ml) and IRBT (green contours for 240K) averaged over 150 km north and south of the latitude of Gan over the IO region from 14 October to 5 November 2011. The blue dashed lines, from left to right, indicate the longitudes of sites at Gan Island (73.15°E), R/V Revelle (80.5°E) and Padang on Sumatra Island (100.35°E). The red dots along the longitude of Gan Island indicate the time of convective events listed in Table 3.1. The
ordinate is the date-time in UTC (00Z), and the upper abscissa is the local time zone to GMT. ... 91 Figure 5.6. Similar to Figure 5.4 except for the seven convective events composites.
The black hatched contours indicate the unfiltered average IRBT composite <240 K in (a) and (b), and unfiltered average TRMM rain rate composite >1 mm/hr in (c) and (d). Red dots in all subfigures denotes 0 h for the quasi-2-day events. ... 92 Figure 5.7. Similar to Figure 5.6a except the longitude ranges from 60°E to 90°E. The red double arrows indicate the estimated zonal spatial scales of propagating diurnal signals. ... 93 Figure 5.8. Dispersion diagram with an estimated characteristic value of the propagating diurnal signals within the seven quasi-2-day convective events obtained from the composite during DYNAMO (black dot), and that estimated in Takayabu 1994b (black circle). Similar to Figure 8 in Takayabu 1994b, the dispersion curves indicate the n=1 westward- propagating inertia-gravity waves (solid) and n=1 Rossby waves (dashed) with the equivalent depths of 10m, 20m, and 30m, respectively. ... 94 Figure 5.9. Maps of IRBT and TRMM rain rate variances over tropical IO during MJO1 for (a) quasi-2-day (1.6–3 day) and (b) diurnal (0.9–1.2 day) periodicity. The colored regions indicate the IRBT variance, the green contours indicate the TRMM rain rate variance >0.64 mm2/hr2. (c): The mean variances of IRBT over 150-km north and south of Gan during MJO1.
The red (blue) curve indicates the quasi-2-day (diurnal) variance as a function of longitude, and the blue vertical dashed lines indicate from left to right the longitudes of Gan Island, R/V Revelle and Padang on Sumatra
Island. (d): Same as (c) except for the mean variances of TRMM rain rate.
... 95 Figure 5.10. The percentage of brightness temperature variance associated with 1.6 to 3-day Fourier components for the period 11 November 1992 to 19 February 1993. (Figure 7 in Haertel and Johnson 1998)... 96 Figure 5.11. Same as Figure 5.9 except for the averaged variance distribution during October, November, and December from 1998 to 2012. ... 97 Figure 5.12. Each sub-figure shows the variance distribution of quasi-2-day signal over the IO from October to December for years from 1998 to 2012. ... 98 Figure 5.13. Identical to Figure 5.12 except for the variance distribution of the diurnal signal. ... 99 Figure 5.14. (top) Spatial distribution of mean SST over the IO averaged during MJO1 from NOAA OISST V2 dataset (0.25° resolution). The dashed blue boxes indicate the SST averaging areas for IOD index calculation according to Saji et al. (1999), the averaged values of SST are shown in the top left of each box and the calculated IOD index is shown in the title. (bottom) Spatial distribution of quasi-2-day signal variance same as Figure 5.9a. ...
... 100 Figure 5.15. (top) Spatial distribution of mean SST over the IO averaged from October to December in 2006. The dashed blue boxes indicate the SST averaging areas for IOD index calculation according to Saji et al. (1999), the averaged values of SST are shown in the top left of each box and the calculated IOD index is shown in the legend. (bottom) Spatial distribution of quasi-2-day signal variance similar to Figure 5.11a except for October to December 2006. ... 101
Figure 5.16. Identical to Figure 5.15 except for the year 1998. ... 102 Figure 5.17. Identical to Figure 5.15 except for the year 2010. ... 103 Figure 6.1. The 48-hours window composites for the quasi-2-day convective events.
(a) Composite IRBT areal percentage (%) calculated as in Figure 3.1a.
Black solid contours indicate percentages from 6% to 14% with intervals of 2%. The black dotted line near 600 hPa (blue dashed line near 950 hPa) indicates the period-mean 0°C level height (boundary layer height) calculated from Gan radiosonde. The boundary layer heights in the composite analysis are based on mixed layer depths reported in Johnson and Ciesielski (2017). (b) Averaged IRBT (red dashed), averaged TRMM rain rate (blue solid) and adjusted SMART-R surface rain rate (green dash- dotted) over Gan. The vertical gray dotted line indicates 0 h. ... 104 Figure 6.2. The 48-hours window composites for the quasi-2-day convective events, including RH from Gan radiosonde with respect to ice for T < 0°C (colored) and water vapor mixing ratio (q) anomaly from AMIE-Gan objective analysis (g/kg; positive values in black solid contours and negative values in black dashed contours). The period-mean 0°C level height and the boundary layer height are indicated the same as in Figure 6.1. ... 105 Figure 6.3. Composites similar to Figure 6.2, except for the temperature anomaly (K;
colored) from radiosonde at Gan overlaid with (a) the IRBT areal percentage from 6% to 14% same as Figure 6.1a (black contour), and (b) geopotential height anomaly (m; positive values in black contour and negative values in dashed black contour) from Gan radiosonde. The period-mean 0°C level height and the boundary layer height in each subfigure are indicated the same as in Figure 6.1. ... 106
Figure 6.4. An example of “onion-type” radiosonde profile in the high vertical resolution skew-T log-P diagram of Gan radiosonde at 02Z on 17 October 2011, corresponding to +18 h in the quasi-2-day life cycle. The red and green solid lines indicate the temperature and dew-point temperature profiles respectively. The blue dashed line indicates the 0°C level. ... 107 Figure 6.5. Phase diagram for the composites of temperature anomaly (abscissa) and moisture anomaly (ordinate) under 900-hPa in the quasi-2-day convective disturbances. The 3-hourly times in the 48-hour window are indicated in gray, four stages of convection — suppressed, convective intensifying, mature and stratiform — are represented in circle, triangle, diamond, and square, respectively. ... 108 Figure 6.6. Composites similar to Figure 6.2, except for (a) the zonal wind (m/s), and (b) the zonal wind anomaly (m/s) from radiosonde at Gan. The period- mean 0°C level height and the boundary layer height in each subfigure are indicated the same as in Figure 6.1. ... 109 Figure 6.7. Similar composites to Figure 6.2 except for the variations of cloud radiative forcings (CRF; K/day) from the CombRet dataset. Figure 6.7a to Figure 6.7c indicates the total cloud radiative heating rate (QR = LW + SW), the longwave (LW) cloud heating rate, and shortwave (SW) cloud heating rate respectively. The period-mean 0°C level height and the boundary layer height in each subfigure are indicated the same as in Figure 6.1. ... 110 Figure 6.8. Composite similar to Figure 6.2, except for the horizontal wind divergence (colored; in units of 10-5s-1) and the vertical motions (in units of hPa/hr;
upward motions in solid contours and downward motions in dashed contours). The period-mean 0°C level height and the boundary layer height
in each subfigure are indicated the same as in Figure 6.1. ... 111 Figure 6.9. Composite similar to Figure 6.2, except for (a) the apparent heating Q1
(K/day), (b) the apparent drying Q2 (K/day), and (c) the vertical eddy flux of MSE (Jm-2s-1) calculated from AMIE-Gan large-scale objective analysis and CombRet dataset. The period-mean 0°C level height and the boundary layer height in each subfigure are indicated the same as in Figure 6.1. . 112 Figure 6.10. Images of NCAR S-Pol radar reflectivity over a 150-km radius region around Gan during MJO1. The time of each radar image corresponds to +6 h in the quasi-2-day life cycle (from top to bottom: 03:02Z on 10/21, 12:02Z on 10/24, and 12:02Z on 10/26). Images available at http://catalog.eol.ucar.edu/cgi-
bin/dynamo/research/prod_browse?platform=SPOL_S_BAND&prod=sb and_DBZ_150km&howmany=All&start=Start+Date&end=End+Date&s ubmit=retrieve+products. ... 113 Figure 6.11. Composites similar to Figure 6.2 except for (a) the equivalent potential temperature anomaly computed by subtracting the MJO1 time-period mean from the composite fields (K; colored), (b) the atmospheric temperature lapse rate (K/km), and (c) the CAPE (black solid) and CIN (green dashed) calculated from radiosonde at Gan. In (b), the average heights of the top 10% most stable levels within the melting stable layer (trade-wind stable layer) are highlighted in dark red line with diamond (circle) markers. The period-mean 0°C level height and the boundary layer height in subfigures were indicated the same as in Figure 6.1. ... 115 Figure 6.12. A conceptual model of tropical cumulus cloud distributions according to TOGA COARE IOP observations. Three main cloud types are indicated:
shallow cumulus, cumulus congestus, and cumulonimbus, along with three stable layers indicated, the trade-wind stable layer in the lower troposphere, the melting stable layer near 0°C level, and the tropopause inversion layer.
Arrows indicate meridional circulation. (Figure 13b in Johnson et al. 1999) ... 116 Figure 7.1. The percentage of high cloudiness (shaded), the mean SST (contours) and the mean global wind analysis (arrows) for November 1992 through February 1993. (a) High cloudiness with cloud-top temperature <208 K and wind at 200 hPa. (b) Cloud-top temperature <235 K and wind at 850 hPa. Wind vectors are scaled such that 10 m/s wind is represented by a vector that would be 2.5° in length on the map. The TOGA COARE IFA is outlined. (Figure 2 in Chen et al. 1996) ... 117 Figure 7.2. Images of NCAR S-Pol radar reflectivity over a 150-km radius region around Gan on 24 October 2011. From (a) to (f), 04:02Z, 04:32Z, 05:02Z, 05:32Z, 06:02Z, and 06:32Z. The yellow dotted vertical lines in subfigures (a) to (e) indicate the edges of eastward shifting convection. Images
available at http://catalog.eol.ucar.edu/cgi-
bin/dynamo/research/prod_browse?platform=SPOL_S_BAND&prod=sb and_DBZ_150km&howmany=All&start=Start+Date&end=End+Date&s ubmit=retrieve+products. ... 118 Figure 7.3. Images of NCAR S-Pol radar reflectivity over a 150-km radius region around Gan on 28 October 2011. From (a) to (f), 10:02Z, 10:32Z, 11:02Z, 11:32Z, 12:02Z, and 12:32Z. The yellow dotted horizontal lines in subfigures (a) to (f) indicate the edges of convective cells near Gan. Images
available at http://catalog.eol.ucar.edu/cgi-
bin/dynamo/research/prod_browse?platform=SPOL_S_BAND&prod=sb and_DBZ_150km&howmany=All&start=Start+Date&end=End+Date&s ubmit=retrieve+products. ... 119 Figure 7.4. Images of NCAR S-Pol radar reflectivity over a 150-km radius region around Gan on 22 October 2011. From (a) to (f), 01:02Z, 01:32Z, 02:02Z, 02:32Z, 03:02Z, and 03:32Z. The yellow dotted horizontal lines in subfigures (a) to (c) and (d) to (e) indicate the edges of northward shifting convection near Gan from 01Z to 02Z and from 02Z to 03Z, respectively.
Images available at http://catalog.eol.ucar.edu/cgi- bin/dynamo/research/prod_browse?platform=SPOL_S_BAND&prod=sb and_DBZ_150km&howmany=All&start=Start+Date&end=End+Date&s ubmit=retrieve+products. ... 120 Figure 7.5. Schematics for the quasi-2-day convective disturbances over the central IO during DYNAMO. The horizontal panel shows the time-longitude schematics of low-level zonal winds (orange arrows) and westward- propagating convective disturbance (similar to Figure 4.2). The vertical panel shows the schematics of cloud development, with four stages indicated, and vertical motions (upward motions in red arrows and downward motions in blue), in addition to the equivalent potential temperature anomaly (as in Figure 6.11a) in the BL. The BL heights were indicated in dashed blue line... 121 Figure A.1. A super (radar) site on Addu Atoll, Maldives (Gan Island). (top) locations of three radar sites and an aircraft base. (bottom) the second ARM Mobile Facility (AMF2) deployed at the Gan airport. (Figure 3 in Yoneyama et al.
2013) ... 122
Figure A.2. Flowchart showing various stages for developing a research-quality radiosonde dataset. (Figure 1 in Ciesielski et al. 2012) ... 123 Figure A.3. Mean vertical profiles of RH at Gan for (top) daytime and (bottom) nighttime soundings with uncorrected and corrected data and uncertainty range for (left) GRUAN corrections, (middle) relative RH corrections, and (right) consistency of correction. Levels with k ≤ 1 indicate good consistency between corrections. Freezing level and the number of sounding (N) in each period are also shown (left). ... 125 Figure A.4. (top) Mean diurnal cycle of TPW (mm) for Gan with uncorrected sounding data (black line), GRUAN-corrected data (blue line), DigiCORA- corrected data (red line), MWR (green line), and GPS (magenta line). Light yellow shading indicates the TPW uncertainty based on GRUAN estimates.
Gray shading indicates nighttime hours. (bottom) TPW difference (mm) between uncorrected and corrected soundings and MWR. Note that the time axis is (top) UTC time and (bottom) local time. ... 126 Figure B.1. Similar to Figure 5.1 except for the Fourier power spectrum of the averaged IRBT over the 150-km region around Gan during MJO2 (15–30 November 2011; dotted) and MJO1 (15–31 October 2011; solid). ... 127 Figure B.2. As in Figure B.1 except for MJO1 (left) and MJO2 (right), respectively.
The red solid lines in both figures indicate the power spectrum of red noise at the confidence level of 95% through c2-test. ... 128 Figure B.3. Same as Figure B.2 except for the averaged TRMM rain rate over the 150-
km region around Gan. ... 129 Figure B.4. Similar to Figure 4.2 except the shading indicates the stdev composite of IRBT among the seven cases and the green hatched region indicates the
averaged IRBT composite <240 K... 130 Figure B.5. Similar to Figure 6.2 except the shading indicates the stdev composite of RH with respect to ice derived from Gan radiosonde among the seven cases and the green contours indicate the RH of 80%, 85%, and 90%. ... 131 Figure B.6. The 48-hours window composite (top left) and time variations (others) of IRBT populations for the quasi-2-day convective events. Percentages of 6% and 12% are indicated in solid black contours. The composite (top left) is identical to Figure 6.1a; other sub-figures are plotted in the same manner except centered at times of each event as listed in Table 3.1. ... 132 Figure B.7. Similar to Figure B.6 except for the horizontal divergence (10-5s-1, colored) and the vertical motions of –4 and –8 (+4) hPa/hr in solid (dashed) black contours. ... 133 Figure B.8. Similar to Figure B.6 except for Q1 (K/day, colored) and Q2 of +4 (–4) K/day in solid (dashed) black contours. ... 134
Introduction
As quoted from Aaron B. Sorkin, “The first step in solving any problem is recognizing there is one”. Among all challenges facing the community of atmospheric
sciences, the first step should always be to obtain the necessary observations and information, that is, as the main theme of the 97th American Meteorological Society annual meeting goes, “Observations lead the way”. Over the decades, many field campaigns aiming to advance our understanding of the atmosphere were conducted in this philosophy, especially for the understanding of the tropics.
From time to time, the tropical atmosphere feels the pulses of extraordinary deep convection in multiple temporal and spatial scales. It is the broad spectrum of scales and the possible interactions between these scales that make the understanding of tropical convection difficult (Clayson et al. 2002). For example, Nakazawa (1988) noted that the convective envelopes in association with the active intraseasonal oscillations (ISOs) were often composed of several smaller-scale individual cloud clusters that tend to propagate westward, while the larger-scale ISO convective envelope propagates eastward.
Specifically, convectively active, westward-propagating disturbances with a quasi-2-day periodicity are frequently associated with ISOs over the tropical western Pacific (WPAC;
Nakazawa 1988, 1995; Hendon and Liebmann 1994; Takayabu 1994a,b; Takayabu et al.
1996; Chen et al. 1996).
In particular, these convective disturbances received considerable attention in studies based on observations taken during the Tropical Ocean Global Atmosphere Coupled Ocean-Atmosphere Response Experiment (TOGA COARE) intensive observation period (IOP; experimental domain illustrated in Figure 1.1) in 1992–1993 over the equatorial WPAC (Nakazawa 1988, 1995; Lau et al. 1991; Takayabu 1994a,b;
Takayabu et al. 1996; Chen et al. 1996; Haertel and Johnson 1998; Haertel and Kiladis 2004). During the TOGA COARE IOPs, two eastward-propagating Madden-Julian Oscillations (MJOs) convective systems were observed over the outer sounding array (OSA) and the Intensive Flux Array (IFA) in December 1992 and early 1993, respectively (Takayabu et al. 1996, Figure 2, as shown in Figure 1.2). Embedded in these systems were smaller-scale, mostly westward-propagating convective disturbances which possessed the quasi-2-day variation as found in the time series of satellite infrared blackbody temperature over IFA in December 1992 (Figure 1.2 bottom).
Based on TOGA COARE observations, previous studies regarded these 2-day convective events as convectively coupled equatorial waves, referred to as “2-day waves”, characterized by zonal wavelengths of 2000–4000 km, westward propagation of 10–15 m/s (Hendon and Liebmann 1994; Takayabu 1994b; Takayabu et al. 1996; Chen et al.
1996; Haertel and Johnson 1998; Wheeler et al. 2000) and associated with the n=1 inertio- gravity wave (IGW) with equivalent depths of 12–50 m (Takayabu 1994a; Wheeler and Kiladis 1999). Observations from TOGA COARE also revealed that the quasi-2-day waves were comprised of westward-propagating organized cloud clusters (Chen et al 1996; Chen and Houze 1997), and further indicated that the quasi-2-day convective disturbances possessed a life cycle similar to that of organized mesoscale convective systems (MCSs) or long-lived squall lines (Hendon and Liebmann 1994; Takayabu et al.
1996). As proposed in the quasi-2-day variation schematics by Takayabu et al. (1996, Figure 19, as shown in Figure 1.3), four stages of cloud life cycle were identified from predominantly shallow-to-deep-to-stratiform convection (the shallow convection stage, the initial tower stage, the mature stage and the decaying stage), which repeated at quasi- 2-day intervals from local observations.
According to Takayabu et al. (1996), the spatial scales of trailing anvil associated
with the quasi-2-day convective systems were observed to be 800–1000 km, much larger than those of the squall-line systems. In addition, despite the similar cloud life cycles, the recovery time of moisture in the lower troposphere associated with the quasi-2-day disturbances, near 24 h, was longer than that of the squall-line systems. Since the development of the next vigorous convective stage follows the moisture recovery in the lower troposphere, it is speculated in Takayabu et al. (1996) that the required time for the recovery of the lower-tropospheric moisture filed sets the timing of the quasi-2-day disturbances.
To explain the quasi-2-day intervals of occurrence, Chen and Houze (1997) suggested that the near 2-day periodicity results from an interaction between the “2-day waves” and convection. A conceptual mesoscale process involving the nonlinear interaction between clouds, radiation, and surface processes was proposed, to explain the near 2-day periodicity. As shown in the schematic in Chen and Houze (1997, Figure 18, as shown in Figure 1.4), a large convective system which forms in the afternoon, usually takes about 6–12 hours to grow and maximize in its areal extent of high cloud-tops (cloud- top temperature <208 K). As the large systems age, the cloud tops continue to expand and become warmer due to the absorption of solar radiation. During the expansion of the upper-level clouds, the short-wave absorption by the long-lasting cloud deck stabilizes the troposphere (Randall et al. 1991), and low moist-static-energy downdrafts associated with the cloud systems radically change the character of the lower-troposphere and the boundary layer (Zipser 1977). In their scenario despite diurnal radiative forcing, boundary layer (BL) recovery extends to a second day likely due to the expanded stratiform clouds of large MCSs, which impacts the timing of the next round of convection, i.e., the new intense convective event does not readily initiate at the same location on the next day due to the stabilization of the BL and the atmosphere. According to TOGA COARE
observations, the BL recovery for a future convective event over a given region is delayed for up to 12–18 hours by the previous convective systems.
This so-called “diurnal dancing” process of convective systems is more prominent during the active phase of the ISO since the large convective systems occur more frequently. The process can be interpreted in the time-longitude diagram as shown in Figure 1.5a (Chen and Houze 1997, Figure 19a) which suggests that the convective systems on day 2 are most likely to form in a relatively clear region adjacent to the dissipating system form the previous day (day 1). By the time when the atmosphere and BL are recovered near the region of convection on day 1, a new convective system can be triggered again on day 3, forming a “checkerboard-like” pattern of convection (Figure 1.5a). In the existence of the “2-day waves” within the ISO envelope, this process may phase-lock with the westward-propagating IGWs, helping select the “2-day waves” as the dominant mode (Figure 1.5b). As stated in Chen and Houze (1997), this combination of 2-day IGWs and the diurnal variation is very similar to the observed variation of cold cloudiness in TOGA COARE IOP (Chen et al. 1996, Figure 11, as shown in Figure 1.6).
Similar to TOGA COARE over the WPAC warm pool, quasi-2-day convective disturbances were observed in the boreal fall of 2006 during the Mirai Indian Ocean (IO) cruise for the Study of the Madden-Julian oscillation convective Onset (MISMO) experiment (Yoneyama et al. 2008). Leveraging both satellite IR and microwave data along with ground-based radar observations, Yamada et al. (2010) detected a complicated relationship between eastward-propagating precipitating systems and westward-moving upper-level cloud shields, which yields a 2–4 day periodicity in rainfall at a given longitude (Figure 1.7). As summarized in their schematic diagram (Yamada et al. 2010, Figure 15, as shown in Figure 1.8), the convective cells propagate eastward while trailing stratiform clouds in the upper troposphere move westward, due to the background flows
with a westerly in the lower troposphere and easterly aloft. The eastward-propagating systems, generally less than 10 km in depth, deepened when they encountered the moisture-rich environment of the westward-moving upper-level stratiform clouds. These stratiform cloud shields advected by upper-level easterlies were trailing clouds remnants from previous eastward-propagating convective systems. The coexistence of eastward and westward convective components can cause a 2–4 day cycle of cloud tops and rainfall at each longitude (Figure 1.8).
In addition to these quasi-2-day features observed in previous field campaigns, westward-propagating mesoscale convective events with a similar periodicity were also prominent over the equatorial IO within the convective envelope of the October MJO event during the Dynamics of the Madden-Julian Oscillation (DYNAMO)/Atmospheric Radiation Measurement MJO Investigation Experiment (AMIE)/Cooperative Indian Ocean experiment on intraseasonal variability in the Year 2011 (CINDY) field campaign (Johnson and Ciesielski 2013; Yoneyama et al. 2013; Zuluaga and Houze 2013; Johnson et al. 2015). The field campaigns (hereafter DYNAMO) were designed to observe and understand the initiation of the MJO over the IO (experimental domain illustrated in Figure 1.9). Its observational network consisted of a large suite of measurements of the atmosphere and ocean, but for this study, high-resolution upper-air radiosonde data and remote sensor retrievals from radars and satellites are utilized.
During DYNAMO, three MJO convectively active events with cold cloud-tops and significant rainfall were observed over the IO (Figure 1.10 and Figure 1.11), the events in October and November were more prominent than the event in December (Yoneyama et al. 2013; Johnson and Ciesielski 2013), and the period between the first two MJO events was about 30 days, shorter than that observed in TOGA COARE. As shown in Figure 1.10 and Figure 1.11, a diurnal cycle of westward-moving precipitation
features is observed over the longitudes of Sumatra (~95°E –100°E), and in October, the diurnal cycle transitioned to a quasi-2-day cycle farther west near the longitudes of the DYNAMO sounding arrays (Johnson and Ciesielski 2013). Seven quasi-2-day convective events with significant rainfall identified in the last half of October by data from Gan Island in the central IO are examined in this study and used to form a composite view of the wind, thermodynamic, and diabatic structure of the disturbances.
The observational datasets used in the study are described in Chapter 2. The analysis procedures and the methodology for identifying the quasi-2-day convective events are explained in Chapter 3. Large-scale convective features of these events including their propagation and the spatial scale are shown in Chapter 4. In Chapter 5, differences between the quasi-2-day and diurnal convection are discussed. The composite atmospheric structures and life cycle of the quasi-2-day convective disturbances are analyzed in Chapter 6. In Chapter 7, an interpretation for the quasi-2-day convective disturbances is proposed. Finally, Chapter 8 summarizes the observational results. A major portion of this study had been published in Yu et al. (2018).
Data
The observational datasets employed in this study are described in this chapter, including the gridded data over the IO and the datasets based on the observations of various instruments at Gan Island. These datasets are mostly available online from the EOL DYNAMO data archive (http://data.eol.ucar.edu/master_list/?project=DYNAMO).
2.1 Gridded data over the Indian Ocean
2.1.1 Gridded satellite data of infrared brightness temperature and rain rate
The 5-km resolution, 3-hourly interpolated Meteosat-7 infrared (channel 8) brightness temperature (IRBT) data and the 0.25° resolution, 3-hourly rain rate estimates from Tropical Rainfall Measuring Mission (TRMM) 3B42V7 dataset are both employed in this study. The major purpose of these datasets is to identify the occurrences of the quasi-2-day convective events as well as their broad-scale convective features.
2.1.2 CSU-DYNAMO upper-air and surface gridded analyses
The gridded analyzed fields including the upper-air horizontal winds were obtained from the CSU-DYNAMO upper-air and surface gridded analyses provided by CSU Mesoscale Dynamics Group at the Department of Atmospheric Science, Colorado State University. This 3-hourly dataset was majorly based on DYNAMO observations and was produced on 1° horizontal grids, 25-hPa vertical resolution (1000 to 50 hPa) using the multiquadric interpolation scheme of Nuss and Titley (1994). In this study, the version 3B dataset, in which the observations were supplemented with ECMWF Operational Analyses (OA) in data sparse regions, is specifically used for large-scale wind field analysis during DYNAMO. More details about this dataset can be found online (http://johnson.atmos.colostate.edu/dynamo/products/gridded/index.html) and in Johnson and Ciesielski (2013) and Johnson et al. (2015).
2.1.3 NOAA OI Sea Surface Temperature (SST) V2 high resolution dataset
The 0.25° resolution, daily SST data during October–December from 1998 to 2012 are used in this study for climatology analysis (section 5.4). This dataset is provided by the National Oceanic & Atmospheric Administration, Oceanic and Atmospheric Research, Earth System Research Laboratory, Physical Sciences Division (NOAA/OAR/ESRL PSD), Boulder, Colorado, USA (from their Web site at https://www.esrl.noaa.gov/psd/).
2.2 Gan Island observations
2.2.1 Upper-air radiosonde observations
The DYNAMO enhanced sounding array (ESA) was comprised of six sites forming two quadrilateral arrays (northern/southern sounding array) in the central equatorial IO during the special observing period (SOP) from 1 October to 30 November (Figure 1.9). The purpose of these sounding sites was to observe the evolution of atmospheric vertical structures using 3- to 6-hourly, high-vertical resolution radiosondes and to compute the large-scale forcing fields as well as heat and moisture budgets (Johnson and Ciesielski 2013; Yoneyama et al. 2013; Johnson et al. 2015). This study uses primarily the 3-hourly sounding data from Gan during the DYNAMO SOP. The high-resolution sounding data were interpolated to 5 hPa for use in this study. More information on the sounding systems, observing characteristics, and quality-control procedures for DYNAMO soundings are contained in APPENDIX A, further details can be found in Ciesielski et al. (2012; 2014) and Yu et al. (2015).
2.2.2 AMIE-Gan large-scale objective analysis
Large-scale fields, including apparent heating Q1, apparent drying Q2, and vertical motion, were obtained from AMIE-Gan objective analyses patterned after the procedure
of Xie et al. (2004). These analyses, covering a nearly circular region with 150 km radius centered on Gan (as illustrated in Figure 2.1), were available from 2 October to 31 December 2011 at 3-hour temporal resolution. The dataset was constructed by using the variational analysis method described in Zhang and Lin (1997) and Zhang et al. (2001) and constrained by C-band Shared Mobile Atmospheric Research and Teaching Radar (SMART-R) rainfall estimates (PSMART-R) adjusted with TRMM rainfall (PTRMM) using the following procedure as described in Ciesielski et al (2017),
#$%&'()' (+,-./01,) =#$%&'()' ∗ #('%% (567 89 :1;<=>)
#('%% ($%&'()' ,=9+<>)
?
This adjustment retains the variability of the TRMM 3B42 rainfall but with the magnitude set by the SMART-R. Use of the surface rainfall constraint in the analyses ensures that the vertically integrated large-scale heat and moisture budgets are consistent with the observed precipitation over the region.
2.2.3 Combined Remote Sensor retrieval (CombRet) dataset
Vertical profiles of the shortwave/longwave radiative fluxes and heating rates were obtained from the Pacific Northwest National Laboratory (PNNL) Combined Retrieval (CombRet) dataset (Feng et al. 2014). The CombRet radar product includes high-resolution data from the SMART-R, NCAR’s S-band dual-polarization Doppler radar (S-Pol), and the Ka-band ARM zenith radar (KAZR) deployed on Gan. The radiative product was retrieved by using a delta-four-stream correlated k-distribution radiative transfer model (Mather et al. 2007, Fu and Liou 1992). CombRet is available at 1-hour, 25-hPa resolution (from 1000–50 hPa) for the period from 10 October 2011 to 08 February 2012, and was averaged into 3-hour bins to match the temporal resolution of the
satellite, rainfall, and sounding data. The version of CombRet data used in this study was produced by replacing the observed 2-m temperature with the SST in the near vicinity of Gan, which makes the radiative fields more representative of open-ocean conditions.
Radiative fields are available for both all-sky and clear-sky conditions allowing us to estimate cloud radiative forcing effects.
Analysis Procedures
3.1 Computation of vertical flux of moist static energy
The vertical eddy flux of moist static energy (MSE), referred to as FMSE, has been widely used to measure the activity of cumulus convection (Yanai et al. 1973; Gallus and Johnson 1991; Johnson et al. 2015). In this study, the composite FMSE is estimated following Yanai et al. (1973),
@%$A = 5;∫HH (C5− CE− C')FG
IJJKLM ≅ −;5ℎRRRRRR, PQP
in which Q1 and Q2 were obtained from AMIE-Gan analysis while QR (total longwave and shortwave radiative forcings) is the net radiative heating rate retrieved from CombRet data. (Q1 – Q2 – QR) was then integrated downward from 100 hPa (a reasonable cloud top pressure where FMSE equals zero) to each pressure level to estimate the FMSE profiles as
−;5ℎ′Q′RRRRRR.
3.2 Identification of the quasi-2-day convective events
This study focuses on the convective activities over the central IO, especially the area around Gan (as illustrated in Figure 2.1). During the convectively active period of the October MJO over this region (15–31 October 2011), convective activity and precipitation tended to occur at quasi-2-day intervals (Zuluaga and Houze 2013) as shown in the time series of average and areal percentage of IRBT, averaged TRMM rain rate and adjusted SMART-R surface rain rate (Figure 3.1a). The IRBT areal percentage in Figure 3.1a was calculated by dividing the number of IRBT grid points in 5-K intervals by the total number of grid points over the 150-km circular region around Gan.
From the time series, seven convective events are identified with quasi-2-day periodicity and convective activity characterized by clouds with a mean IRBT minimum below 240 K and rain rates higher than 1 mm/hr in TRMM or SMART-R over the 150- km region near Gan. The criteria and times of these events are listed in Table 3.1 and indicated in Figure 3.1a. These times of IRBT minimal peaks were used as the 0-hour for the 48-hour window composite analyses. The convective event on 30 October showed an averaged IRBT lower than 240 K; however, it was excluded from the composite analyses due to the fact that the mean rainfall near Gan was considerably less than the other events and the radar reflectivity indicated mostly stratiform clouds over Gan throughout the time of event (Figure 3.2). By way of comparison, the first six of the seven convective events identified by the IRBT and rain rate signatures in our study were included in the 11-case composite of Zuluaga and Houze (2013) based on hourly S-Pol rain accumulation (Table 3.2). However, their composite analysis also includes events on a 4–6 day time scale associated with synoptic-scale waves from the November and December MJOs. Although the sample size in our study is small, there appears to be no preferred time of day for the 0 h occurrence of these events.
Large-scale Convective Features of the Quasi-2-day Convective Events
One of the conspicuous large-scale convective features during DYNAMO SOP was the eastward-moving MJO convective envelope passing over Gan and the DYNAMO ESA from 15 to 31 October 2011 (Figure 1.10 and Figure 1.11). During this convectively active period over the central IO, hereafter referred to as MJO1, seven quasi-2-day convective events occurred at Gan. According to the IRBT areal percentage in Figure 3.1a, during MJO1 the frequency of shallow cloud-tops reached a maximum before the rainfall peaks. The clouds then evolved into a deeper structure and reached maturity when the lowest IRBT peaks occurred. Following the mature stage, deep convective cores gradually dissipated while the frequency of warmer cloud-tops (250–270 K), some of which may be stratiform in nature, maximized (Zuluaga and Houze 2013, Zhang and Yoneyama 2017). These convective transitions repeated at quasi-2-day intervals during MJO1. A second major MJO event occurred over the IO in November with a convectively active phase at Gan from 15 to 30 November 2011 (Figure 1.10 and Figure 1.11), however, the quasi-2-day convective signal was not statistically significant over the central IO region during this period and therefore is not considered in this study (see APPENDIX B). The reasons for this difference between the two periods may be related to the different MJO propagation features over the DYNAMO ESA, but further examination is needed for the full explanation.
Figure 4.1, similar to Figure 1.10 and Figure 1.11, is a time-longitude diagram of IRBT and TRMM rain rate averaged over a 1.5° latitude strip north and south of Gan showing the large-scale zonal features of these quasi-2-day convective events. During DYNAMO, the convective envelope of the October MJO initiated over 60°E–70°E on 14
October, slowly propagated eastward through the DYNAMO ESA (72°E–80°E) during 15–31 October, which then encountered the diurnally excited, westward-propagating convective signal from Sumatra in early November. As observed in many previous studies, although the MJO convective signal over IO propagated eastward, the convective envelope was comprised of a number of westward-propagating features at shorter time scales (Nakazawa 1988, 1995; Hendon and Liebmann 1994; Takayabu 1994a,b;
Takayabu et al. 1996; Chen et al. 1996). The diurnally pulsing, westward-moving convection near the west coast of Sumatra Island (90°E–100°E) may have had some linkages to the convection over the central IO (Kubota et al. 2015); however, such a linkage is not entirely obvious from Figure 4.1.
Focusing on the quasi-2-day convective events over Gan, Figure 4.2 depicts the time-longitude IRBT, TRMM rain rate and 850-hPa total wind composites of the seven events over the DYNAMO ESA. The reference time 0 h, corresponding to the times listed in Table 3.1, is characterized by the lowest averaged IRBT over Gan. In Figure 4.2, the region of convective activity propagated westward from the eastern portion of the ESA, peaking over the area surrounding Gan with dominant cold clouds and heavy rainfall near 0 h. The 850-hPa total wind field shows in general westerlies to the west of Gan and slight easterlies to the eastern ESA. Noted that the zonal wind component shows a low-level convergence prior to the onset of deep convection over Gan, and the westerlies extend toward the east of Gan as the convective disturbance passes through. The ~500–1000 km zonal scale of the area of lower IRBT (< 240 K) suggests the presence of anvil shields and is consistent in size with observations made in TOGA COARE (800–1000 km;
Takayabu et al. 1996). As depicted in the horizontal time evolution of seven-event composite (Figure 4.3), after time 0 h, the convective signal continued to move westward while the peak IRBT gradually warmed at Gan, suggesting (and confirmed later) that
broad areas of stratiform clouds dominated during this period.
The westward propagation speed of the convective signals can also be estimated from Figure 4.2. Considering time-longitude IRBT composites lower than 240 K, the convective signal propagated 7°–8° in longitude in 20 hours, while the rainfall signal showed a similar speed but extended over a greater zonal distance. The propagation speed of the quasi-2-day convective signal is thus approximated to be 10–12 m/s, the same order as that observed over different areas in previous studies, i.e., 10–19 m/s over WPAC during TOGA COARE IOP in 1992–1993 (Haertel and Johnson 1998 as shown in Figure 4.4; Takayabu 1994b) and 15 m/s in Hendon and Liebmann (1994).
While the quasi-2-day convective events over the equatorial IO possess similar propagation speeds as those over the WPAC, the zonal scales are different. From Figure 4.1 to Figure 4.3, the zonal scale of propagation for the 2-day disturbances is ~1000–1500 km, shorter than the ~2000–4000 km scale observed for the WPAC during the TOGA COARE IOP (Chen et al. 1996; Chen and Houze 1997; Clayson et al. 2002). The difference could well be related to differences in the environments between the two ocean basins, but a full explanation is beyond the scope of this study.
Propagating Convective Waves and Stationary Convective Disturbances
5.1 Fourier power spectral analysis
During MJO1, the passage of the westward-propagating quasi-2-day convective events regulated the cloudiness over Gan. To investigate the cloud variability, Fourier spectral analysis is employed to quantify the frequency and intensity of cloud activity associated with the quasi-2-day disturbances during MJO1.
Identical with the procedure in Haertel and Johnson (1998), Figure 5.1 shows the Fourier power spectrum of the averaged IRBT over 150-km region around Gan from October to December 2011 and during MJO1. Here the spectral components are weighted by frequency so that within a certain frequency band, the variance of IRBT time series is proportional to the area under the peak. From October to December, significant spectral peaks are seen at 30-day, 13-day, 5-day, and close to 2-day (dotted curve in Figure 5.1).
These results are similar to the findings in TOGA COARE over WPAC (Haertel and Johnson 1998) as shown in Figure 5.2 except for the peak near the shorter 30-day period in DYNAMO (Figure 1.10, Figure 1.11) compared to the 60-day peak in TOGA COARE, which was due to the MJO events passing over Gan in late 2011 with a time interval of about 30 days (Johnson and Ciesielski 2013; Yoneyama et al. 2013). The peaks in both the diurnal (0.9–1.2 day) and quasi-2-day (1.6–3 day) frequency bands are statistically significant but the diurnal oscillation was weaker than quasi-2-day oscillation over this region (more details on the significance tests in APPENDIX B). The quasi-2-day (diurnal) cloud oscillation contributed approximately 54.7% (12.3%) of the variance during MJO1 over Gan and about 15.7% (3.2%) from October to December 2011. And the quasi-2-day
oscillation contributed about 17% of the variance over the IFA in TOGA COARE from November 1992 to February 1993 (Haertel and Johnson 1998).
5.2 Separation of diurnal and quasi-2-day oscillations
By applying a Lanczos bandpass filter (Duchon 1979; Thomson and Emery 2014), the diurnal and quasi-2-day oscillations in IRBT during MJO1 can be separated as shown in Figure 3.1b and Figure 3.1c. The response functions associated with the bandpass filter are shown in Figure 5.3. Note that the time difference between minima in the diurnal signal ranged from 24–27 hours in Figure 3.1b due to the width of the diurnal filter allowing frequencies between 0.9 and 1.2 days to be retained. Having about half the amplitude of the quasi-2-day signal, the diurnal signal tends to grow then wane as the MJO convective envelope passes.
By applying this filter along each longitude during MJO1, Figure 5.4 shows time- longitude diagrams of averaged IRBT and TRMM rain rate within 1.5° latitude north and south of Gan for the diurnal (Figure 5.4a, c) and quasi-2-day (Figure 5.4b, d) signals. The equatorial diurnal convective signals were stronger near Sumatra than over the open ocean, indicating the dominant strong diurnal forcing of convection by topography (Yanase et al. 2017). The cloud signals accompanied by a precipitation signal originated daily from the terrain of Sumatra in the late afternoon (16–18LT) and propagated westward over IO owing to the dominant background easterlies near Sumatra (Yanase et al. 2017). As the diurnal convective signal propagated westward away from the terrain, it gradually weakened over the IO. Another group of relatively strong diurnal signals appeared across the DYNAMO ESA as part of the MJO1 convective envelope, though not apparently linked to the diurnal signal coming off of Sumatra. One possible explanation for the separated diurnal signals lies in the SST distribution during the period
of study. Figure 5.5 shows that diurnal signals coming off Sumatra run into the cooler water to the east of the DYNAMO ESA near 90°E 95°E during MJO1, but then SST starts to increase between 80°E–85°E and farther west. It is speculated that the diurnal signals coming off Sumatra die off due to cooler SST, but then a new cycle of diurnal convection initiates farther west associated with warmer SST. While the source of this separate regime of diurnal convection is difficult to ascertain, radiative effects were undoubtedly playing a prominent role (Gray and Jacobson 1977; Randall et al. 1991;
Chen and Houze 1997). The gradual advance in the timing of the peaks in the diurnal signal at Gan (Figure 3.1b) is generally consistent with the slow eastward drift in the origins of the diurnal signals across the ESA (Figure 5.4a). Correspondingly, the peaks in the quasi-2-day signals advance slowly with time as well (Figure 3.1c).
The IRBT and TRMM rain rate signals associated with quasi-2day periodicity (Figure 5.4b, d) exhibited starkly different behavior patterns from the diurnal signal. First, the convectively active quasi-2-day signal was prominent over the IO in addition to near Sumatra terrain at 100°E. Second, and more importantly, the quasi-2-day signal did not always propagate as the diurnal signal. In fact, the quasi-2-day convective signals over the central IO occasionally exhibited no propagation and at times even eastward propagation during MJO1 in contrast to its diurnal counterpart, which almost always propagated from east to west. In addition to these features, the active quasi-2-day signal displayed a larger amplitude over a relatively large zonal scale (up to 1000 km), and at times during MJO1 appeared as a “checkerboard-like pattern” (similar to that in Figure 1.5a) with alternating areas and periods of enhanced and suppressed convection and clouds (e.g. in Figure 5.4b from 15–20 October between 60°E–75°E, and from 22–25 October between 70°E–100°E). Interestingly, the 2-day signals over Gan appeared in most instances to extend only to the eastern boundary of the DYNAMO ESA (80°E) and
were mostly disconnected with 2-day variability farther east, even as the active phase of MJO1 progressed through the region. This behavior is generally consistent with earlier findings in the IO during MISMO (Yamada et al. 2010) but is in contrast with the behavior of 2-day disturbances in the WPAC, which tend to progressively migrate eastward with the overall MJO convective envelope (Nakazawa 1988).
Worth noting in Figure 5.4c and Figure 5.4d is that the heavy rainfall (>1 mm/hr) of the seven quasi-2-day convective events over the DYNAMO ESA only occurred when both the diurnal and quasi-2-day signals were convectively active, hence the quasi-2-day intervals of occurrence as shown in Figure 4.1. On the other hand, the rainfall near Sumatra (90°E–100°E) corresponds well to the diurnal signal, but not necessarily to the quasi-2-day signal (Figure 5.4d), suggesting that the precipitation over the eastern IO was dominated by the terrain-induced diurnal convective activity (Yanase et al. 2017), while other factors controlled the rainfall patterns over the central IO.
These differences between quasi-2-day and diurnal signals are further demonstrated in time-longitude composite diagrams (Figure 5.6) for the seven convective events during MJO1. As evident from Figure 5.6, the quasi-2-day convective events associated with significant precipitation over Gan occurred only when the diurnal and quasi-2-day signals were both convectively active. The active diurnal signal propagated westward through the DYNAMO arrays (Figure 5.6a, c) with an estimated propagation speed of ~10–12 m/s, which largely explains the propagation speed of the convective events shown in Figure 4.2. In contrast, the quasi-2-day active signals appeared almost stationary, and the convective signals possessed a zonal scale up to about 1000 km (Figure 5.6b, d), a likely result of broadening stratiform clouds. In addition to the considerable amount of spatial range of the active clouds and significant precipitation, the quasi-2-day composite signal contributed 54.7% of the variance in cloud activity (43.5% in
precipitation) over Gan during MJO1.
As inferred from the above analyses, the quasi-2-day convective events observed over Gan during MJO1 were actually comprised of at least two modes of convective activity. One was the westward-propagating diurnal convective waves very likely corresponding to the westward-propagating IGWs with phase speed of 10–12 m/s (Takayabu 1994a,b; Takayabu et al 1996; Haertel and Kiladis 2004; Wheeler and Kiladis 1999). The other was the near-stationary quasi-2-day convective disturbances with zonal scale up to ~1000 km, which contributed approximately half of the convective variance over Gan during MJO1. Overall, the combination of both modes contributed substantially 67% to the variance of cloud activity over Gan during MJO1 (and about 65% in TRMM rain rate variance). As a result, the propagation of cloud clusters in the seven quasi-2-day convective events was regulated by diurnally-excited convective waves while the intensity and spatial range varied in quasi-2-day intervals.
To estimate the equivalent depth of the westward-propagating diurnal convective waves, we follow a similar approach to that taken in Takayabu (1994b). From Figure 5.6a we estimate the zonal scale of the diurnal disturbance to be ~1.05×10⁶ m (or zonal wavenumber 38) as illustrated in Figure 5.7. The intrinsic frequency (Q<>0 = Q+U/− VW) is computed using Q+U/ = 2π/1day, k = –2π/(1.05×106 m), and the zonal wind U = 3.25 m/s (taken as the 850-mean hPa at Gan for the period of interest) which results in Q<>0 = 9.22×10⁻⁵ s-1 (or 1.27 cycles/day). These wave characteristics coincide with the dispersion curve for a westward-propagating n=1 IGW with an equivalent depth of ~20 m (Figure 5.8). Also, shown here is the result from Takayabu 1994b for the 2-day disturbance they analyzed using TOGA COARE observations. Despite the differences between the zonal and temporal scales of the disturbances in these studies, both waves have a similar equivalent depth of ~20 m.