Manuscript No.
69451 Weinheim Germany Courier services:
Boschstraße 12 69469 Weinheim Germany
Tel.: (+49) 62 01 6 06 2 55 Fax: (+49) 62 01 6 06 2 03 E-mail: eurjoc@wiley-vch.de
Reprints/Issues
You are entitled to a PDF for 25 hardcopies of your article (a PDF for 50 hardcopies and 1 single issue for Microreviews). You also have the opportunity to order reprints, issues or a PDF for an unlimited number of hardcopies at the quoted rates.
Reprints of European Journal of Organic Chemistry articles are very popular. Whole issues, reprints, and high-quality PDFs are available at the rates given on a separate sheet. There is no surcharge for color reprints. For overseas orders please note that you will receive your issues/reprints by airmail unless you specifically opt for receiving them by surface mail. An appropriate surcharge will be levied to cover the higher postal rates.
Please bill me for:
____ reprints ____ entire issues
and send them by
□
surface mail□
courier service**If you would like to use FedEx please provide your FedEx No.: ______________
Cover Posters
Posters are available of all the published covers in two sizes (see attached price list).
DIN A2 (42 x 60 cm/ 17 x 24in):
□
outside coverDIN A1 (60 x 84 cm/ 24 x 33in):
□
outside coverSubscriptions
As an author in European Journal of Organic Chemistry you obviously appreciate the quality of the journal and value it as a medium for the distribution of your results. We thank you for this support. With the aim of ever increasing the dissemination of
information we have maintained low (personal) subscription rates for European Journal of Organic Chemistry. Please take advantage of these, ensuring yourself a regular supply of top information and helping us to keep subscription rates down and the accessibility of the journal up.
a PDF file (high resolution) E-mail address
Please note that posting of the final published version on the open internet is not permitted.
Special Offer If you order 200 or more reprints you will get a PDF file for half-price.
reprints and a PDF file
Mail reprints/ issues/ posters to (no P.O. Boxes) __________________________________________
__________________________________________
__________________________________________
Send bill to ________________________________
__________________________________________
__________________________________________
VAT number ______________________
Tax-free charging can only be processed with the VAT number of the institute/company. To prevent delays with the processing, please provide us with the VAT number with this order.
Purchase Order No.: _______________
Signature __________________________________
Date ______________________________________
Please send me and bill me for
the remaining issues of this volume the complete current volume the next year’s volume a library subscription
Signature __________________________________
Date ______________________________________
Price List for Reprints (2012)
The prices listed below are valid only for orders received in the course of 2012 and before the proofs pass for press.
Minimum order is 50 copies. Delivery time will be approximately 3 weeks after the date of publication.
If more than 500 copies are ordered, special prices are available upon request. Single issues are available to authors at a reduced price.
The prices include mailing and handling charges (with the exception of the additional costs incurred for airmail delivery and courier services). The prices are exclusive of VAT.
Reprints, posters, and issues for overseas orders are shipped by airmail (25.00 Euro surcharge). If you would like to receive them by surface mail please indicate this on the accompanying order form (postage for shipping posters within Europe: 15.00 Euro). If you would like to use a courier service please indicate this on the order form. The cost for the courier service is 75.00 Euro unless you provide your FedEx number, in which case you will be charged the appropriate amount based on your contract with FedEx.
Reprints Price for orders (in Euro)
Size (pages) 50 copies 100 copies 150 copies 200 copies 300 copies 500 copies
1 – 4 330.− 385.− 425.− 445.− 548.− 752.−
5 – 8 470.− 556.− 608.− 636.− 784.− 1077.−
9 – 12 610.− 717.− 786.− 824.− 1016.− 1396.−
13 – 16 744.− 874.− 958.− 1004.− 1237.− 1701.−
17 – 20 885.− 1040.− 1138.− 1196.− 1489.− 2022.−
for every additional 4 pages
140.− 164.− 175.− 188.− 231.− 315.−
Issues 1 copy: 20 Euro PDF (high resolution) 330 Euro Cover Posters • DIN A2 (42 x 60 cm/ 17 x 24in):
• DIN A1 (60 x 84 cm/ 24 x 33in):
29 Euro 39 Euro Special Offer
If you order 200 or m ore reprints you will get a PDF (high resolution) f or half-price.
Annual subscription rates 2012
Institutional (valid for print and electronic/
print or electronic delivery) Europe € 6802.00 / 5914.00 Switzerland SFr 11344.00 / 9863.00 Outside Europe US$ 9447.00 / 8214.00
Postage and handling charges included. All prices are subject to local VAT/ sales tax. Prices are subject to change. Electronic products are delivered by Wiley Subscription Services Inc., 111 River Street, Hoboken, NJ 07030, USA,
VAT Registration No: EU826000141
FULL PAPER
DOI: 10.1002/ejoc.201101384
Synthesis and Characterization of Adducts Formed in the Reactions of Safrole
1
2 ⬘,3⬘-Oxide with 2⬘-Deoxyadenosine, Adenine, and Calf Thymus DNA
Li-Ching Shen,
[a]Su-Yin Chiang,
[b]I-Ting Ho,
[a]Kuen-Yuh Wu,*
[c]and Wen-Sheng Chung*
[a]Keywords: DNA adducts / DNA damage / Safrole / Cancer Safrole (1) is a natural product found in herbs and spices.
6
Upon uptake, it can be metabolized to safrole 2⬘,3⬘-oxide [(⫾)-SFO, 2], which can react with DNA bases to form DNA adducts. The reactions of 2 with 2⬘-deoxyadenosine (3) and adenine (8) under physiological conditions (pH 7.4, 37 °C) were carried out to characterize its possible adducts with ad- 11
enine. Four adducts were isolated by reverse-phase liquid chromatography and their structures were characterized by UV/Vis,1H and13C NMR spectroscopy and MS. The reaction of 2 with 3 produced two regioisomers, N1γ-SFO-dAdo (4) and N6γ-SFO-dAdo (5), in 4.2–4.5 % yield, and the reaction 16
Introduction
Safrole (1) is a natural product found in herbs and spices, which include basil, cinnamon, nutmeg, ginger, and black pepper.[1] It causes a significant increase of liver cancer in mice and has been classified as a hepatocarcinogen.[2–4]Saf- 31
role can also cause chromosomal aberrations, sister chro- matid exchanges, and the formation of DNA adducts in hepatocytes of F344 rats.[2]In Taiwan, piper betle inflores- cence, which contains 15 mg/g of safrole, is commonly chewed together with areca quid,[5] and the concentration 36
of safrole in saliva has been reported to be as high as 420 μm.[6]Previous studies have shown that areca quid chewing could be a critical risk factor for oral squamous cell carci- noma, oral submucous fibrosis, and esophageal carcinogen- esis.[1,6]
41
Safrole can be metabolized by cytochrome P450 to 1⬘- hydroxysafrole and safrole 2⬘,3⬘-oxide [(⫾)-SFO, 2].[7–9]1⬘- Hydroxysafrole is enzymatically metabolized by sulfotrans- [a] Department of Applied Chemistry, National Chiao Tung Uni-
versity,
Hsinchu 30050, Taiwan Fax: +886-3-572-3764 E-mail: wschung@nctu.edu.tw
[b] School of Chinese Medicine, China Medical University, Taichung 404, Taiwan
[c] Institute of Occupational Medicine and Industrial Hygiene, National Taiwan University,
Taipei, Taipei 106, Taiwan Fax: +886-2-3366-8077
E-mail: kuenyuhwu@ntu.edu.tw
Supporting information for this article is available on the WWW under http://dx.doi.org/10.1002/ejoc.201101384.
Eur. J. Org. Chem.0000, 0–0 © 0000 Wiley-VCH Verlag GmbH & Co. KGaA, Weinheim 1
of 2 with 8 generated N3γ-SFO-Ade (9) and N9γ-SFO-Ade (10) in 1.0–2.4 % yield. Using HPLC–ESI-MS/MS, we traced the amounts of the four adducts formed when calf thymus DNA (10 mg) was treated with 2 (60μmol) and the levels of 4, 5, and 9 were determined to be 2000, 170, and 660 adducts 21 per 106nucleotides, respectively. Adduct 10 was not detected under these conditions. These results suggested that stable DNA adducts of 2 were formed in vitro, and further studies on the formation of these DNA adducts in vivo may help to elucidate their role in safrole carcinogenicity. 26
ferases to 1⬘-sulfooxysafrole, which can attack DNA bases to form DNA adducts, such as N2-(trans-isosafrol-3⬘-yl)-2⬘- 46 deoxyguanosine and N2-(safrole-1⬘-yl)-2⬘-deoxyguanos- ine.[10]Both of these adducts have been detected by Liu et al. using the32P-postlabeling method in oral tissues of an oral cancer patient with a history of chewing betle quid.[6]
Compound 2 has been shown to have moderate mutagenic- 51 ity in Salmonella typhimurium TA 1535[11,12]and TA 100.[12]
Administration of 2 to female CD-1 mice has led to skin tumors.[13]Moreover, 2 exhibits cytotoxicity and genotoxic- ity to HepG2 cells to cause the breaking of DNA strands in NFκB transgenic mice.[14] However, Guenthner et al. have 56 reported that DNA adducts of 2 can be formed in vitro but were not detectable in vivo.[9,15]The structure of 2 is similar to that of many epoxides whose genotoxicity and potential formation of DNA adducts have been well studied,[16–18]
which led to our interest in purifying and characterizing 61 potential DNA adducts of 2 in vitro.
Epoxide metabolites frequently attack DNA bases through SN2 reactions to form DNA adducts at the N2and N7positions of guanine and the N1, N6, and N3 positions of adenine.[17–20]For example, allylbenzene 2⬘,3⬘-oxide has 66 been shown to react with 2⬘-deoxyguanosine to form 3⬘-N2- 2⬘-deoxyguanosyl-??(2⬘-hydroxy-propylbenzene)??.[10] 䊏䊏 ((⬍=Author: this nomenclature is ambiguous: –OH at pro- pyl -which pos.?- or benzene moiety? parentheses are needed to clarify, or please send the formula))䊏䊏 In order 71 to gain more insight into the genotoxicity of 2, we needed to synthesize related DNA adducts as standards. However, there have been no reports on the structural characteriza-
tion of DNA adducts of 2, thus, our initial objective was to synthesize, purify, and characterize adducts of 2 with 2⬘- 76
deoxyadenosine and 2⬘-deoxyguanosine. Our preliminary results showed that the N7-guanine adduct was the major product when 2 was treated with 2⬘-deoxyguanosine or calf thymus DNA (2700 adducts per 106 nucleotides, un- published data). Furthermore, the N7-guanine adduct was 81
easily detected in the urine of mice when it was pretreated with 2. These consequences imply that the genotoxicity of 2 should be of concern because the formation of DNA ad- ducts is the initial stage of gene mutation. As animal studies will take some time, the study of the reaction of 2 with 2⬘- 86
deoxyguanosine will be reported separately. Here, we report our work on the reactions of 2 with 2⬘-deoxyadenosine (3) and adenine (8), which gave four major adducts: N1γ-SFO- dAdo (4), N6γ-SFO-dAdo (5), N3γ-SFO-Ade (9), and N9γ- SFO-Ade (10). The structures of these adducts were charac- 91
terized by1H and13C NMR, heteronuclear multiple quan- tum coherence (HMQC), and HMBC spectroscopy and MS. HPLC–ESI-MS/MS was used to analyze the adducts generated from the reaction of 2 with calf thymus DNA.
Results and Discussion
96
Reaction of 2 with 3
The reaction of 2 with 3 at 37 °C for 3 d yielded 4 and 5 in 4.2 and 4.5 % isolated yields, respectively (Scheme 2).
This reaction was monitored by HPLC, which showed that 4 and 5 appeared at retention times (tR) of 18.6 and 101
23.2 min, respectively (Figure 1, a). Unidentified peaks at tR = 14.2 and 32.1 min were generated when 2 was incu- bated in the absence of 3 and 8 under the same conditions.
Figure 1. HPLC plots monitored at 260 nm of the reaction mix- tures of 2 with (a) 3 and (b) 8 in 0.2n K2HPO4buffer solution (pH 7.4) at 37 °C for 72 h.
A product ion scan of the protonated molecular ions of 4 and 5 (m/z = 430) showed a fragment at m/z = 314, which 106
corresponds to the loss of a 2-deoxyribose moiety. The UV spectrum of 4 showed an absorption maximum (λmax) at 259 nm (pH 7), which is consistent with N1-(3-chloro-2-hy-
droxy-3-buten-1-yl)-2⬘-deoxyadenosine obtained from the reaction of 1-chloroethenyl oxirane with 2⬘-deoxyadenos- 111 ine.[17] Further characterization was carried out in [D6]- DMSO with 2D NMR spectroscopy.
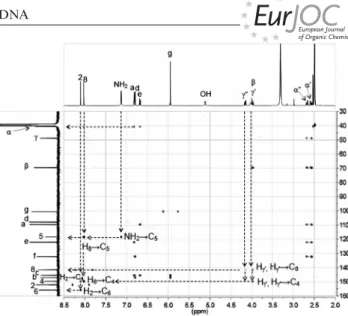
The HMBC spectrum of 4 showed that 1⬘-H on 2-deoxy- ribose appeared as a triplet at 6.33 ppm, which correlated with three carbon signals (C-1⬘, C-4, and C-8, Figure 2). 116 The correlation of 1⬘-H (6.33 ppm) with C-1⬘ (83.44 and 83.52 ppm) was confirmed by their mutual correlation in the HMQC spectrum (Figure S3, Supporting Information).
The duplication of the carbon signals is due to the presence of two diastereomers. The second correlation of 1⬘-H with 121 a quaternary carbon atom (147.15 and 147.10 ppm) could be assigned to C-4 on the adenine core. The third corre- lation of 1⬘-H with the methine carbon atom (CH) at 138.8 ppm was assigned to C-8 (see Figure 2, and Figure S1 in the Supporting Information). After confirming the C-8 126 peak, we assigned 8-H (8.34 ppm) from its correlation with C-8䊏䊏 ((⬍=Author: do you agree with the change?)) 䊏䊏 in the HMBC and HMQC spectra (Figure S3). Although the HMBC spectrum of 4 did not show a correlation be- tween 1⬘-H and the methylene C-2⬘, we assigned C-2⬘ from 131 its correlation with 2⬘-H in the HMQC spectrum. Thus, the assignment of 2⬘-H was made through its correlation with 1⬘-H in the H,H-COSY spectrum (Figure S2). The peaks at 2.34 and 2.66 ppm were assigned to 2⬘-H⬘ and 2⬘-H based on the coupling constants of J2⬘3⬘= 6.4 Hz (trans) and J2⬘⬘3⬘ 136
= 3.2 Hz (cis) (Table 2) because the 2⬘-endo conformer of 2- deoxyribose is predominant in solution.[21,22]In the HMBC spectrum of 4, C-4 was correlated with three protons at 6.33 (1⬘-H), 8.26 (2-H), and 8.34 ppm (8-H). The most down- field quaternary carbon signal at 156.0 ppm, which is cou- 141 pled to 2-H but not 8-H, was assigned as C-6. The corre- lations of C-4 (147.15 and 147.10 ppm) and C-6 (156.0 ppm) with 2-H (8.34 ppm) and those of C-4 (147.15 and 147.10 ppm) and C-5 (123.6 ppm) with 8-H (8.26 ppm) were used to assign 2-H and 8-H. Additionally, α⬘-H and 146 α⬘⬘-H were assigned to the signals at 2.63–2.70 and 2.74 ppm, respectively, by their correlations with C-a
Figure 2. HMBC spectrum of 4 (500 MHz, [D6]DMSO).
Adducts of Safrole 2⬘,3⬘-Oxide with 2⬘-Deoxyadenosine, Adenine, and DNA
(109.6 ppm), C-e (122.2 ppm), and C-f (132.13 and 132.11 ppm) of the 1,3-benzodioxole group of 4 from the HMBC spectrum. The peak at 3.90 ppm was correlated to 151
α⬘-H and α⬘⬘-H in the H,H-COSY spectrum, therefore, it was assigned as β-H. Finally, the correlations between C-2 and C-6 with γ⬘-H and γ⬘⬘-H support that 4 is an N1adduct of 2⬘-deoxyadenosine (Figure 2 and Table 2).
The λmax of a series of alkyl-substituted N6-adenosines 156
are redshifted compared to those reported for N1-adeno- sines.[23] The adduct 5, which has a λmaxof 271 nm, was assigned to N6γ-SFO-dAdo, because it is redshifted by 12 nm compared to 4 (259 nm). Compound 5 was further con- firmed as the N6adduct by 2D NMR analysis. The HMQC 161
spectrum of 5 showed unexpected correlations of a proton signal at 8.39 ppm with two carbon peaks at 139.4 and 164.6 ppm (Figure S5). In addition, the1H NMR spectrum of adduct 5 showed a puzzling extra proton when the inte- gration of all the protons was summed up. It was sub- 166
sequently established that the pair of signals at 13Cδ = 164.6 ppm and1Hδ = 8.39 ppm were derived from the resid- ual signals of the buffer, HCOO–NH4+, which overlapped with 8-H of 5 in the 1H NMR spectrum. The β-H peak at 3.91–3.95 ppm was determined from its correlation with 171
methine C-β (70.2 ppm) in the HMQC spectrum (see also the DEPT spectrum of 5 in Figure S4). As expected, β-H showed correlations with two neighboring methylene pro- tons γ⬘,γ⬘⬘-H and α⬘,α⬘⬘-H (Figure 3). By analyzing the mul- tiple correlations of C-a (109.7 ppm), C-e (122.1 ppm), and 176
C-f (132.9 ppm) with protons in the HMBC spectrum (Fig- ure S6 and Table S1), we assigned the signals at 2.58–2.63 and 2.73–2.80 ppm to α⬘-H and α⬘⬘-H (Table S1). γ⬘-H and γ⬘⬘-H were then assigned to the signals at around 3.46 ppm because they also coupled with β-H in the H,H-COSY spec- 181
trum. The correlations of γ⬘-H and γ⬘⬘-H with the broad- ened NH peak (7.59 ppm) in Figure 3 revealed that 5 was an N6 adduct of 2⬘-deoxyadenosine. Although the HMBC spectrum of 5 did not show a correlation between C-6 and
Figure 3. H,H-COSY spectrum of 5 (300 MHz, [D6]DMSO).
Eur. J. Org. Chem.0000, 0–0 © 0000 Wiley-VCH Verlag GmbH & Co. KGaA, Weinheim www.eurjoc.org 3 γ⬘,γ⬘⬘-H, the chemical shifts of all of the carbons atoms on 186 the adenine group are in excellent agreement with those of N6-(3-chloro-2-hydroxy-3-buten-1-yl)-2⬘-deoxyadenosine.[17]
We did not observe any ring opening adducts from the β attack of 2 or deamination of 4 to form an N1-inosine ad- duct, which has been reported in the reaction of styrene 191 oxide with 2⬘-deoxyadenosine.[23–25]The lack of a phenyl or vinyl group on the α-carbon atom of an oxiran to stabilize the carbocation intermediate of an SN1 reaction of 2 ex- plains why no β attack and only γ attack adducts were ob- served; furthermore, the γ-position of 2 is sterically less hin- 196 dered than the β-position. The secondary hydroxy group on the β-carbon atom of 4 cannot form an oxazolinium ring to facilitate the deamination process, therefore, the deami- nation product of 4 was not observed.[26]
Several carbon signals of 1:1 intensity ratios were ob- 201 served in the NMR spectra of 4 due to the formation of diastereomers in the reaction of 3 with racemic 2. In order to differentiate the diastereomeric pair of 4, we intended to synthesize optically pure (R)-(+)-enriched 2 (Scheme 1) to react with 3. However, a mixture of (R)/(S)-2 (2:1 ratio) 206 enriched with the (R)-(+)-form was obtained. The reaction produced similar adducts of 4 and 5 and their structures were identified as described above. The spectrum of (R)- enriched 4 showed that some of the13C NMR signals ap- peared to be in 2:1 ratios (Figure S8). However,13C NMR 211 spectra of the diastereomers of 5 and (R)-(+)-enriched 5 did not show separate sets of peaks for the diastereomeric pairs (Figure S8). The diastereomeric pairs of 4 were further sep- arated and collected by chiral HPLC (Figure S10). The peak area ratios of diastereomeric 4 and (R)-(+)-enriched 4 216 were 1:1 and 2:1, respectively, which were consistent with the peak area ratios observed in some of the 13C NMR peaks. However, the diastereomeric pairs of 5 could not be separated under the same HPLC conditions.
Scheme 1. Enantioselective synthesis of (R)-(+)-enriched 2.
Rearrangement of 4 to 5 221
The N1 adduct of 3 usually undergoes Dimroth re- arrangement to produce the N6adduct.[17,23–25] The trans- formation of 4 (an N1 adduct) to 5 (an N6 adduct) by
Dimroth rearrangement was monitored with a reverse- phase HPLC system, which showed that 4 had a half life of 226
ca. 24 h in K2HPO4buffer solution at 37 °C.
Reaction of 2 with 8
The reaction of 2 with 8 was monitored by HPLC, which showed the formation of two products: 9 and 10 at tR = 18.6 and 22.7 min, respectively (Figure 1b). The reaction of 231
2 with 8 at pH 7.4 at 37 °C for 72 h gave 9 and 10 in 1.0 and 2.4 % isolated yields, respectively (Scheme 2). These two regioisomeric products had identical MS/MS fragmentation patterns (m/z = 314씮 136) but distinctive λmax values in their UV spectra [λmax= 274 (9), 263 nm (10), Table 1]. Fur- 236
ther structural characterization of these two adducts was based on 2D NMR spectroscopy.
Table 1. UV λmaxof the DNA adducts of 2 at different pH values.
Adduct λmax[nm]
pH 1 pH 7 pH 13
4 259 259 261
5 267 271 271
9 274 274 273
10 260 263 263
The1H NMR spectrum of 9 showed two purine signals at 8.01 and 7.86 ppm. As 2-H in adenine adducts is nor- mally downfield shifted compared to 8-H, the signal at 241
8.01 ppm was assigned to 2-H and that at 7.86 ppm was assigned to 8-H.[27,28] The 13C NMR signals of C-2 (143.3 ppm) and C-8 (152.3 ppm) were then assigned based on the HMQC and DEPT spectra (Figures S13 and S11).
The quaternary carbon signal at 118.9 ppm was assigned to 246
C-5 of adenine based on its strong coupling with 8-H (3JCH) and weak coupling with 2-H (4JCH) in the HMBC spectrum of 9 (Figure 4). By comparing the chemical shifts of the adenine moiety in 9 with those in 3-(2-hydroxy-2-phenyl-
Scheme 2. Syntheses of 4, 5, 9, and 10.
ethyl)adenine, which is derived from styrene oxide,[28] we 251 assigned the signal at 148.2 ppm to C-4 and that at 156.7 ppm to C-6 (Table S2). The assignment of C-4 to the signal at 148.2 ppm was ascertained by its strong coupling with 2-H (3JCH) and weak couplings with γ⬘-H and γ⬘⬘-H (3JCH), and the assignment of C-6 (156.7 ppm) was ascer- 256 tained by its correlations with 2-H (3JCH) and 8-H (4JCH) in the HMBC spectrum. The absence of a correlation be- tween 8-H and C-4 (3JCH) and the presence of correlations between 2-H and C-5 and between 8-H and C-6 (both4JCH couplings) in HMBC is unusual and could be due to the 261 particular hybridization of these carbon atoms or other fac- tors.[29] Based on the multiple couplings of C-a, C-e, and C-f in the HMBC spectrum of 9, the proton signals at 2.58–
2.60 and 2.89 ppm were assigned as α⬘-H and α⬘⬘-H. The methylene proton signals at 3.99–4.03 and 4.35 ppm were 266 subsequently assigned as γ⬘-H and γ⬘⬘-H based on DEPT, HMQC, and H,H-COSY spectra (Figure S12). Finally, the
Figure 4. HMBC spectrum of 9 (500 MHz, in [D6]DMSO).
Adducts of Safrole 2⬘,3⬘-Oxide with 2⬘-Deoxyadenosine, Adenine, and DNA
correlations of γ⬘-H and γ⬘⬘-H with C-2 and C-4 indicated that 9 is consistent with an N3adduct of adenine (Figure 4 and Table S2).
271
The proton signals of the purine ring of 10 were observed at 8.10, 8.02, and 7.12 ppm and were assigned to 2-H, 8-H, and NH2, respectively. Based on the proton assignments of adenine, the carbon signal at 141.5 ppm coupled to 8-H was assigned as C-8 from the HMQC and DEPT spectra (Fig- 276
ures S16 and S14). The carbon signal at 118.5 ppm in the HMBC spectrum (Figure 5) was assigned to C-5 because it was connected to both 8-H (3JCH) and NH2 (3JCH). Simi- larly, the carbon signal at 149.6 ppm, which was coupled to both 2-H (3JCH) and 8-H (3JCH), was assigned to C-4. In 281
addition, the carbon signal at 155.8 ppm was assigned to C-6 because it was coupled to 2-H (3JCH) but not to 8-H (4JCH). The assignment of γ⬘-H and γ⬘⬘-H (3.98 and 4.15 ppm, respectively) was determined by DEPT, HMQC, HMBC, and H,H-COSY spectra (Figure S15) as depicted 286
in Figure 5. The correlations of the methylene protons γ⬘- H and γ⬘⬘-H with C-8 and C-4 supported that 10 arose from the reaction of N9-adenine on the γ-position of 2 (Figure 5 and Table S3).
The methine carbons of the adenine unit that are closer 291
to the alkyl substituents are upfield shifted; for example, C- 2 of 9 (an N3adduct) was at 143.3 ppm, whereas that of C- 8 was at 152.3 ppm. Similarly, C-8 of 10 (an N9adduct) was at 141.5 ppm, whereas that of C-2 was at 152.2 ppm. These observations are consistent with those reported by Linhart 296
et al. in their 13C NMR assignments of N3-(2-hydroxy-2- phenylethyl)adenine and N9-(2-hydroxy-2-phenylethyl)ade- nine.[27] The N3 position of 8 is not involved in Watson–
Crick hydrogen bonding and is exposed in the minor groove of DNA, which is therefore susceptible to alkylation.[30] In 301
order to obtain a large amount of the N3adduct, we used 8 to react with 2. The reaction of 2 with 8 provided 9 and 10. However, 10 is not expected to form in the reaction of 2 with DNA. Hence, we used 10 as internal standard to quantify the formation of 9 in 2-pretreated calf thymus 306
DNA.
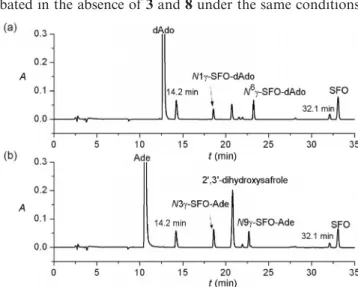
Figure 6. HPLC–ESI-MS/MS of 2-pretreated calf thymus DNA (a) incubation solution and (b) hydrolysate of enzymatic hydrolysis.
Eur. J. Org. Chem.0000, 0–0 © 0000 Wiley-VCH Verlag GmbH & Co. KGaA, Weinheim www.eurjoc.org 5 Figure 5. HMBC spectrum of 10 (500 MHz, in [D6]DMSO).
Reaction of 2 with Calf Thymus DNA
The products of the reaction of 2 with calf thymus DNA were analyzed by HPLC–ESI-MS/MS in the multiple reac- tion monitoring (MRM) mode, and the m/z signals at 311 430씮 314 for 4 and 5, 435씮319 for [15N5]-4 and [15N5]-5, and 314씮136 for 9 and 10 were used for this purpose. The DNA adducts were identified by comparison of their reten- tion times with those of the corresponding authentic sam- ples. In the incubation solution, only 9 was measured (Fig- 316 ure 6, a), which suggested that 9 was easily depurinated from the DNA backbone, and reached a level of 400 per 106 nucleotides. In the enzymatic DNA hydrolysate, the levels of 4 and 5 were calculated to be 2000 and 170 per 106nucleo- tides, respectively, and that of 9 reached 660 per 106nucleo- 321 tides (Figure 6, a). Furthermore, the formation of adducts 4, 5, and 9 in double stranded DNA were traced at different time intervals. The initial level of 9 was higher than those of 4 and 5 (0–10 h) and reached a plateau at 24 h. The formation of 4 was accompanied by a tiny amount of 5, 326
which demonstrated that N1was the initial reaction site and the N1 adduct 4 was slowly converted to the N6 adduct 5 by the Dimroth rearrangement (Figure S17).
Styrene oxide (SO), which is structurally similar to 2, has been proven to contribute to gene mutation.[31]We therefore 331
speculated that 2 may have a similar biological relevance to SO. For example, N1- and N6-adenine adducts of SO, which resulted in AT씮 GC transitions, have been reported.[32,33]
N1-adenine adducts may contribute more to the mutation of AT-base pairs because their central hydrogen bonds are 336
blocked. N3-Adenine adducts are prone to depurination from the DNA backbone and DNA polymerase preferen- tially adds an adenine opposite to an apurinic site,[32]there- fore, they tend to lead to AT씮TA transversions. Such a mutation has been observed in SO-treated hypoxanthine–
341
guanine phosphoribosyl transferase mutant clones of pri- mary human T-lymphocytes.[34]
Conclusions
We have purified the reaction products of (⫾)-SFO (2) with 2⬘-deoxyadenosine (3) and adenine (8) and determined 346
their structures by UV, 1D and 2D NMR spectroscopy and MS. The reaction of 2 with 3 gave 4 and 5 in 4.2–4.5 % yield, and that of 2 with 8 gave 9 and 10 in 1.0–2.4 % yield.
These adducts were also detected in 2-treated calf thymus DNA and were accurately quantified by our newly-devel- 351
oped HPLC–ESI-MS/MS method. This is the first system- atic characterization of the adducts formed from the reac- tions of 2 with 8 and 3, and the results suggest that further in vitro and in vivo studies are needed to shed light on the carcinogenicity of 2.
356
Experimental Section
Chemicals and Enzymes: Compounds 3 and 8, calf thymus DNA, deoxyribonuclease I from bovine pancreas type IV, posphodiester- ase II from bovine spleen, posphodiesterase I from Crotalus atrox type IV, and acid phosphatase from potato were purchased from 361
Sigma–Aldrich Company Ltd (St Louis, MO). [15N5]-2⬘-deoxyad- enosine was purchased from Medical Isotope Inc. (Pelham, NH).
HPLC grade acetonitrile was purchased from Mallinkrodt Baker Inc. (Paris, KY). Ammonium formate was obtained from Fluka Biochemika (Steinheim, Germany). Formic acid was purchased 366
from Riedel-de Haën (Seelze, Germany). Water was purified with a Milli-RO/Milli-Q system (Millipore, Bedford, MA). Compound 2 was prepared according to a literature procedure.[35]
Purification of DNA Adducts: Reverse-phase HPLC was performed with a Hitachil-7000 pump system with a d-7000 interface, l-7200 371
autosampler (Hitachi Ltd., Tokyo), column oven,l-7450A photodi- ode array detector (Hitachi Ltd., Tokyo), and a Prodigy ODS (3) column, 4.6⫻ 250 mm, 5 μm (Phenomenex, Torrance, CA). Am- monium formate buffer (pH 5.5, 50 mm) in acetonitrile (58:42, v/v) was used as the mobile phase to separate the reaction mixtures of 376
3 and 8 with 2. The temperature of the column oven was set at 25 °C. Chiral HPLC was performed with a Gilson 321-H1 pump system with a 506C interface, a Rheodyne 7725I injector, a Gilson 155 UV/Vis detector, Gilson Unipoint software (Gilson, Inc., Mid- dleton, WI), and CHIRALPAK AS-H column, 4.6⫻ 250 mm, 381
5 μm (Daicel Chemical Industrial Ltd., Tokyo). The mobile phase of 2-propanol/hexane (20:80, v/v) was eluted isocratically at a flow rate of 0.5 mL/min to purify 6, 7, and (R)-(+)-enriched 2. Com- pounds 4 and 5 were eluted with 2-propanol/hexane (2:98, v/v) at a flow rate of 0.5 mL/min for 5 min, and then with 2-propanol/ 386 hexane (90:10, v/v) solution with the flow rate decreased to 0.1 mL/
min from 5 to 6 min and maintained for 90 min.
Spectroscopic and Spectrometric Methods:1H NMR spectra were measured with a 300 or 500 MHz spectrometer. Natural abundance
13C NMR spectra were recorded using pulse Fourier transform 391 techniques with a 300 or 500 MHz NMR spectrometer operating at 75.4 or 125.7 MHz, respectively. Broadband decoupling, H,H- COSY, HMQC, and HMBC were carried out to simplify spectra and aid peak identification. Samples were dissolved in [D6]DMSO for NMR analysis. The alkylation positions of the DNA adducts 396 were mainly determined by long-range H–C correlations in the HMBC spectra. UV/Vis spectra of the adducts at pH 1, 7, and 13 were recorded with a HP-8453 spectrophotometer with diode array detection. HPLC–ESI-MS/MS was performed on an API 3000TM spectrometer (Applied Biosystems/MDS SCIEX, Foster City, CA) 401 together with Hitachil-7000 pump and l-7200 autosampler (Hitachi Ltd., Tokyo). An electrospray ionization source was used in the positive mode (ESI-MS/MS). A Prodigy ODS (3) column, 150⫻ 2.1 mm, 5 μm (Phenomenex, Torrance, CA) was used. Total ion chromatograms and mass spectra were recorded on a personal 406 computer with the Analyst software version 1.1 (Applied Biosys- tems). The mobile phase consisted of a linear gradient from 0 to 42 % acetonitrile in 50 mm ammonium formate buffer (pH 5.5) from 0 to 25 min at a flow rate of 200 μL/min. The MRM mode was used for quantitative analysis of 4 and 5 (m/z = 430씮314), 411 [15N5]-4 and [15N5]-5 (m/z = 435씮319), and 9 and 10 (m/z = 314씮136) with the collision energy set at 29, 27, 35, and 39 V, respectively. The dwell time for MRM experiments was set at 150 ms. Nitrogen was used as the turbo gas with temperature set at 450 °C; it was also used as the nebulizer, curtain, and collision gas 416 with pressure settings of 8, 8, and 12 psi, respectively. Calibration curves were established in the concentration range of 5 to 250 ng/
mL for 4, 5, and 9. The pure compounds were introduced to the ion source by a syringe pump at a flow rate of 5 μL/min. The com- pounds were diluted with 1:1 (v/v) mixture of 0.1 % formic acid 421 and pure acetonitrile.
Synthesis of (ⴞ)-SFO (2):[35]m-Chloroperbenzoic acid (30 g, 0.17 mol) in chloroform (200 mL) was added slowly to a solution of safrole (1, 22.7 mL, 0.15 mol) in chloroform (50 mL) at 0 °C. The reaction mixture was stirred at room temperature overnight, and 426 the excess m-chloroperbenzoic acid was treated with 10 % sodium sulfite. After extraction into 5 % NaHCO3(3⫻ 250 mL) and wash- ing with water (2⫻ 200 mL), the organic layers were combined and dried with MgSO4before the solvents were evaporated to dryness.
The residue was purified by column chromatography with hexane/ 431 EtOAc (10:1, v/v) as the eluent to give 2 as a yellow liquid (10.6 g, 40 %). ESI-MS: m/z = 179 [M + H]+.1H NMR (300 MHz, CDCl3):
δ = 2.51 (dd, J1= 2.6, J2= 4.9 Hz, 1 H, γ⬘-H), 2.70–2.81 (m, 3 H, γ⬘⬘-H, α⬘-H, α⬘⬘-H), 3.06–3.11 (m, 1 H, β-H), 5.91 (s, 2 H, g-H), 6.66–6.69 (m, 1 H, Ar-CH), 6.73–6.75 (m, 2 H, Ar-CH) ppm.13C 436 NMR (75.4 MHz, CDCl3): δ = 38.3 (C-γ), 46.7 (C-α), 52.5 (C-β), 100.8 (C-g), 108.2 (C-d), 109.4 (C-a), 122.8 (C-e), 130.7 (C-f), 146.2 (C-c), 147.6 (C-b) ppm.
Enantioselective Synthesis of (R)-(+)-Enriched 2[36]
(R)-(+)-5-(2,3-Dihydroxypropyl)-1,3-benzodioxole (6): A mixture of 441 1 (0.16 mL, 1.0 mmol), AD-mix-β (1.4 g, 0.1 mmol), and methane- sulfonamide (98 mg, 1.0 mmol) in 50 % aqueous tBuOH (10 mL)
Adducts of Safrole 2⬘,3⬘-Oxide with 2⬘-Deoxyadenosine, Adenine, and DNA
was stirred at 0 °C for 30 h. Na2SO3(1.5 g) was added and the mixture was extracted into EtOAc (3⫻ 10 mL). The organic layer was washed with brine, dried with MgSO4, and evaporated under 446
reduced pressure on a rotary evaporator. The residue was recrys- tallized from CH2Cl2to give 6 as a white solid (86 %). Compound 6 showed 96 % ee, determined by Chiral HPLC (Figure S7). The optical rotation of 6, [α]D25 = +21.7 (c = 0.003, CH2Cl2), was dif- ferent to the literature value ([α]D= +32).[36] 1H NMR (300 MHz, 451
CDCl3): δ = 2.61–2.74 (m, 2 H, α-H), 3.49 (dd, J1 = 7.0, J2 = –11.2 Hz, 1 H, γ⬘-H), 3.67 (dd, J1= 3.2, J2= –11.2 Hz, 1 H, γ⬘⬘- H), 3.83–3.91 (m, 1 H, β-H), 5.93 (s, 2 H, g-H), 6.66 (dd, J1= 1.6, J2= 7.9 Hz, 1 H, e-H), 6.72 (d, J = 1.6 Hz, 1 H, a-H), 6.75 (d, J
= 7.9 Hz, 1 H, d-H) ppm.13C NMR (75.4 MHz, CDCl3): δ = 39.4 456
(C-α), 65.9 (C-γ), 73.0 (C-β), 100.9 (C-g), 108.3 (C-d), 109.6 (C-a), 122.2 (C-e), 131.3 (C-f), 146.3 (C-c), 147.8 (C-b) ppm.
(R)-(+)- 5-(2-Hydroxy-3-tosyloxypropyl)-1,3-benzodioxole (7): To a mixture of 6 (0.42 g, 2.14 mmol), tosyl chloride (0.45 g, 2.35 mmol), and 4-dimethylaminopyridine (0.03 g, 0.24 mmol) in 461
CH2Cl2 (7 mL) was added triethylamine (0.36 mL) in CH2Cl2 (7 mL) dropwise at 0 °C, and the mixture was stirred at room tem- perature for 3 h. The residue was purified by column chromatog- raphy (hexane/EtOAc = 75:25, Rf= 0.12) to give 7 as a light yellow liquid (72 %). Compound 7 was determined to have 40 % ee by chi- 466
ral HPLC analysis (Figure S7). [α]D25= +12.5 (c = 0.002, CH2Cl2).
1H NMR (300 MHz, CDCl3): δ = 2.46 (s, 3 H, CH3), 2.67–2.71 (m, 2 H, α-H), 3.90–4.06 (m, 3 H, β-H, γ⬘-H, γ⬘⬘-H), 5.93 (s, 2 H, f- H), 6.59 (dd, J1= 1.6, J2= 7.9 Hz, 1 H, e-H), 6.63 (d, J = 1.5 Hz, 1 H, a-H), 6.72 (d, J = 7.9 Hz, 1 H, d-H), 7.34 (d, J = 8.1 Hz, 2 471
H, Ar-CH), 7.80 (d, J = 8.3 Hz, 2 H, Ar-CH) ppm. 13C NMR (75.4 MHz, CDCl3): δ = 21.6 (CH3), 38.9 (C-α), 70.3 (C-β), 72.5 (C-γ), 100.9 (C-g), 108.3 (C-d), 109.5 (C-a), 122.2 (C-e), 127.9 (CHCSO3), 129.9 (CH3CCH), 130.2 (C-f), 132.5 (CH3CCH), 145.1 (CHCSO3),146.3 (C-c), 147.7 (C-b) ppm.
476
Synthesis of (R)-(+)-5-Oxiranylmethyl-1,3-benzodioxole (2): A mix- ture of 7 (0.13 g, 0.40 mmol) and K2CO3 (0.49 g, 3.57 mmol) in methanol (25 mL) was stirred at room temperature for 30 min. The methanol was removed with a rotary evaporator. The residue was diluted with water and extracted into EtOAc. The organic layer 481
was dried with MgSO4and the solvent was removed with a rotary evaporator. The crude product was purified by column chromatog- raphy (hexane/EtOAc = 7:3, Rf= 0.58) to give 2 as a light yellow liquid (23 %). Compound 2 was determined to have 39 % ee by chi- ral HPLC analysis (Figure S7). The separated enantiomers were 486
collected for optical rotation measurements. (R)-(+)-5-Oxiranyl- methyl-1,3-benzodioxole 2: [α]D25= +11.8 (c = 0.003, CH2Cl2); (S)- (–)-5-Oxiranylmethyl-1,3-benzodioxole 2: [α]D25= –11.6 (c = 0.003, CH2Cl2). [α]25D = +13 has been reported for the (R)-(+) enantio- mer.[36] 1H NMR (300 MHz, CDCl3): δ = 2.47 (dd, J1= 2.6, J2= 491
4.9 Hz, 1 H, γ⬘-H), 2.65–2.79 (m, 3 H, γ⬘⬘-H, α⬘, α⬘⬘-H), 3.01–3.07 (m, 1 H, β-H), 5.87 (s, 2 H, CH2), 6.60–6.64 (m, 1 H, Ar-CH), 6.68 (s, 1 H, Ar-CH), 6.95 (d, J = 6.1 Hz, 1 H, Ar-CH) ppm.13C NMR (75.4 MHz, in CDCl3): δ = 38.4 (C-γ), 46.8 (C-α), 52.5 (C-β), 100.9 (C-g), 108.3 (C-d), 109.5 (C-a), 121.9 (C-e), 130.8 (C-f), 146.5 (C- 496
c), 147.7 (C-b) ppm.
Synthesis of N1γ-SFO-dAdo (4), (R)-Enriched 4, N6γ-SFO-dAdo (5), and (R)-Enriched 5: A solution of 2 or (R)-(+)-enriched 2 was treated with 3 in a 2:1 molar ratio in 0.2n K2HPO4(pH 7.4) solu- tion and incubated at 37 °C for 72 h. The products were purified 501
and desalted using reverse-phase HPLC. Solutions of the pure ad- ducts were dried under vacuum. Each pure adduct was subjected to spectroscopic and spectrometric characterization. The character- istic UV λmaxof 4 and 5 at different pH values are presented in
Eur. J. Org. Chem.0000, 0–0 © 0000 Wiley-VCH Verlag GmbH & Co. KGaA, Weinheim www.eurjoc.org 7 Table 1. The ESI-MS/MS of 4 and 5 showed the same fragments 506 at m/z = 430 [M + H]+, 452 [M + Na]+, and 314 [M – dR + H]+. 䊏䊏 ((⬍=Author: please define dR)) 䊏䊏 HRMS (ESI) for 4: calcd.
for C20H24N5O6[M + H]+430.1728; found 430.1729. HRMS (ESI) for 5: calcd. for C20H24N5O6[M + H]+430.1728; found 430.1723.
The1H and13C NMR spectroscopic data for 4 and 5 are presented 511 in Tables 2 and S1, respectively.
(R)-Enriched 4:1H NMR (500 MHz, [D6]DMSO): δ = 2.29–2.37 (m, 1 H, 2⬘⬘-H), 2.62–2.78 (m, 3 H, 2⬘-H, α⬘, α⬘-H⬘), 3.51–3.73 (m, 3 H, 5⬘, 5⬘⬘-H, γ⬘-H), 3.87–3.91 (m, 2 H, 4⬘-H, β-H), 4.24–4.29 (m, 1 H, γ⬘⬘-H), 4.41–4.43 (m, 1 H, 3⬘-H), 6.00 (s, 2 H, g-H), 6.31–6.36 516 (m, 1 H, 1⬘-H), 6.75 (dd, J1= 1.6, J2= 7.9 Hz, 1 H, e-H), 6.86 (d, J= 7.9 Hz, 1 H, d-H), 6.87 (s, 1 H, a-H), 8.26 (s, 1 H, 2-H), 8.35 (s, 1 H, 8-H) ppm.13C NMR (125.7 MHz, [D6]DMSO): δ = 40.7 (C-α), 51.4 (C-γ), 61.6 (C-5⬘), 68.5 (C-β), 70.6 (C-3⬘), 83.41 and 83.48 (C-1⬘) overlapped with solvent (C-2⬘), 87.9 (C-4⬘), 100.6 (C- 521 g), 107.9 (C-d), 109.6 (C-a), 122.1 (C-e), 123.6 (C-5), 132.09 and 132.11 (C-f), 138.74 and 138.79 (C-8), 145.4 (C-c), 146.9 (C-b), 147.07 and 147.12 (C-4), 149.2 (C-2), 156.0 (C-6) ppm.
(R)-Enriched 5:1H NMR (500 MHz, [D6]DMSO): δ = 2.30 (ddd, J2⬘⬘3⬘= 2.9, J1⬘2⬘⬘= 6.1, J2⬘2⬘⬘= –13.1 Hz, 1 H, 2⬘⬘-H), 2.60–2.63 (m, 526 1 H, α⬘-H), 2.72–2.79 (m, 2 H, 2⬘-H, α⬘⬘-H), 3.54 (br. s, γ⬘, γ⬘⬘-H ovrelap with H2O), 3.54–3.57 (m, 1 H, 5⬘⬘-H), 3.66 (dd, J4⬘5⬘= 3.4, J5⬘5⬘⬘= –11.7 Hz, 1 H, 5⬘-H), 3.91–3.93 (m, 2 H, 4⬘-H, β-H), 4.44–
4.45 (m, 1 H, 3⬘-H), 5.03 (br. s, 1 H, OH), 5.28 (br. s, 1 H, OH), 5.37 (br. s, 1 H, OH), 5.98 (s, 2 H, g-H), 6.38 (dd, J1⬘2⬘⬘= 6.2, J1⬘2⬘ 531
= 7.7 Hz, 1 H, 1⬘-H), 6.70 (d, J = 7.9 Hz, 1 H, e-H), 6.82 (d, J = 7.9 Hz, 1 H, d-H), 6.84 (s, 1 H, a-H), 7.59 (br. s, 1 H, NH-6), 8.23 (s, 1 H, 2-H), 8.38 (s, 1 H, 8-H) ppm.13C NMR (125.7 MHz, [D6] DMSO): δ = 40.7 (C-α), 46.0 (C-γ), 61.9 (C-5⬘), 70.3 (C-β), 71.0 (C-3⬘), 84.0 (C-1⬘) overlapped with solvent (C-2⬘), 88.0 (C-4⬘), 536 100.6 (C-g), 107.9 (C-d), 109.8 (C-a), 119.7 (C-5), 122.2 (C-e), 133.0 (C-f), 139.5 (C-8), 145.3 (C-c), 146.9 (C-b), 148.1 (C-4), 152.3 (C- 2), 154.6 (C-6) ppm.
Synthesis of [15N5]-4 and [15N5]-5: [15N5]-2⬘-deoxyadenosine (5 mg) was dissolved in H2O (1 mL) to serve as the stock solution. Com- 541 pound 2 (20 μmol) was added to [15N5]-2⬘-deoxyadenosine (500 μL, 10 μmol) in 0.2n K2HPO4(pH 7.4) buffer solution, and the mix- ture was incubated at 37 °C for 72 h. The reaction mixture was subjected to HPLC separation as mentioned above. The corre-
sponding peaks were collected. 546
Synthesis of N3γ-SFO-Ade (9) and N9γ-SFO-Ade (10): A mixture of 2 and 8 in a 2:1 molar ratio in 0.2n K2HPO4(pH 7.4) buffer solution was incubated at 37 °C for 72 h. The adducts were purified and desalted using reverse-phase HPLC. The pure adduct was dried under vacuum and subjected to spectroscopic and spectrometric 551 characterization. The characteristic λmax of 9 and 10 at different pH values are presented in Table 1. The ESI-MS/MS of 9 and 10 showed the same fragments at m/z = 314 [M + H]+and 136 [M – SFO + H]+. HRMS (ESI) for 9: calcd. for C15H16N5O3[M + H]+ 314.1255; found 314.1243. HRMS (ESI) for 10: calcd. for 556 C15H16N5O3[M + H]+314.1255; found 314.1242. The1H and13C NMR spectroscopic data for 9 and 10 are presented in Tables S2 and S3 (), respectively.
Rearrangement of 4 to N6γ-SFO-dAdo (5): A sample of 4 (30 μg) in 0.2n K2HPO4(1 mL, pH 7.4) solution was incubated at 37 °C, 561 and the solution was analyzed at various time intervals by reverse- phase HPLC.
Reaction of 2 with Calf Thymus DNA: Calf thymus DNA (1 mg) in Tris-HCl buffer (pH 7.5–8.5, 1 mL), which contained 1 mm ethyl- enediaminetetraacetic acid, was stored at 4 °C overnight to serve 566
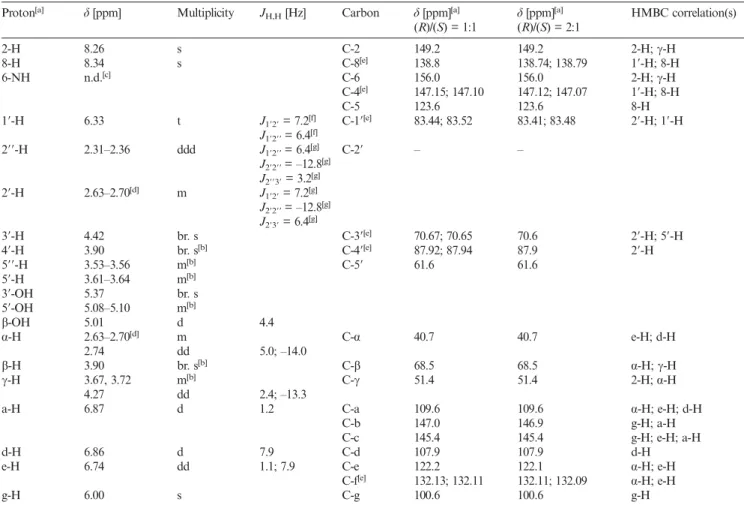
Table 2.1H and13C NMR chemical shifts (δ), coupling constants (JH,H), and HMBC correlations for 4.
Proton[a] δ [ppm] Multiplicity JH,H[Hz] Carbon δ [ppm][a] δ [ppm][a] HMBC correlation(s) (R)/(S) = 1:1 (R)/(S) = 2:1
2-H 8.26 s C-2 149.2 149.2 2-H; γ-H
8-H 8.34 s C-8[e] 138.8 138.74; 138.79 1⬘-H; 8-H
6-NH n.d.[c] C-6 156.0 156.0 2-H; γ-H
C-4[e] 147.15; 147.10 147.12; 147.07 1⬘-H; 8-H
C-5 123.6 123.6 8-H
1⬘-H 6.33 t J1⬘2⬘= 7.2[f] C-1⬘[e] 83.44; 83.52 83.41; 83.48 2⬘-H; 1⬘-H
J1⬘2⬘⬘= 6.4[f]
2⬘⬘-H 2.31–2.36 ddd J1⬘2⬘⬘= 6.4[g] C-2⬘ – –
J2⬘2⬘⬘= –12.8[g]
J2⬘⬘3⬘= 3.2[g]
2⬘-H 2.63–2.70[d] m J1⬘2⬘= 7.2[g]
J2⬘2⬘⬘= –12.8[g]
J2⬘3⬘= 6.4[g]
3⬘-H 4.42 br. s C-3⬘[e] 70.67; 70.65 70.6 2⬘-H; 5⬘-H
4⬘-H 3.90 br. s[b] C-4⬘[e] 87.92; 87.94 87.9 2⬘-H
5⬘⬘-H 3.53–3.56 m[b] C-5⬘ 61.6 61.6
5⬘-H 3.61–3.64 m[b]
3⬘-OH 5.37 br. s
5⬘-OH 5.08–5.10 m[b]
β-OH 5.01 d 4.4
α-H 2.63–2.70[d] m C-α 40.7 40.7 e-H; d-H
2.74 dd 5.0; –14.0
β-H 3.90 br. s[b] C-β 68.5 68.5 α-H; γ-H
γ-H 3.67, 3.72 m[b] C-γ 51.4 51.4 2-H; α-H
4.27 dd 2.4; –13.3
a-H 6.87 d 1.2 C-a 109.6 109.6 α-H; e-H; d-H
C-b 147.0 146.9 g-H; a-H
C-c 145.4 145.4 g-H; e-H; a-H
d-H 6.86 d 7.9 C-d 107.9 107.9 d-H
e-H 6.74 dd 1.1; 7.9 C-e 122.2 122.1 α-H; e-H
C-f[e] 132.13; 132.11 132.11; 132.09 α-H; e-H
g-H 6.00 s C-g 100.6 100.6 g-H
[a] Diastereomeric mixture of racemic 4 or (R)-enriched 4. [b] Unresolved multiplet due to a mixture of diastereomers. [c] n.d. = not detected. [d] The signals of 2⬘⬘-H and α-H were overlapped. [e] Separated shifts due to a mixture of diastereomers. [f] Selective decoupling of 2⬘-H or 2⬘⬘-H. [g]1H NMR spectra measured with an 800 MHz spectrometer.
as the stock solution. A solution of DNA (100 μL, 100 μg) was hydrolyzed with a mixture of DNase I (4 U), phosphodiesterase I (32 mU), phosphodiesterase II (80 mU), and acid phosphatase (1 U) and incubated at 37 °C for 8–10 h.[37,38]The amounts of rea- gents were adjusted according to the amount of DNA in the sam- 571
ple. To evaluate the efficiency of the enzymatic hydrolysis, cali- bration curves of dAdo, dGuo, dCyd, and dThd were established by HPLC analysis. The retention time of each 2⬘-deoxyribonucleo- side was at 9.9 min (dCyd), 12.4 min (dGuo), 14.6 min (dThd), and 16.7 min (dAdo, data not shown), respectively. The hydrolysis effi- 576
ciency of double strand calf thymus DNA was estimated to be 97.8 %.
Calf thymus DNA (10 mg) was treated with 2 (60 μmol) in 0.2n K2HPO4buffer (10 mL, pH 7.4) and incubated at 37 °C for 72 h.
Two samples (each 400 μL) were removed from the reaction mix- 581
ture at different time intervals (0, 0.5, 2, 4, 6, 8, 10, 24, 48, and 72 h). The reaction mixture was extracted into Et2O to remove unre- acted 2. All the samples were then kept in an ice bath for a few hours to vaporize the Et2O and then analyzed using two different methods modified from Goggin et al.[39]Method 1: The solution 586
was spiked with [15N5]-4 (100 μL, 4 ng), [15N5]-5 (100 μL, 9 ng), and 10 (5 ng) to serve as internal standards and then filtered through a 0.22 μm PVDF membrane to remove the DNA backbone for HPLC–ESI-MS/MS analysis. Method 2: The reaction mixture was subjected to hydrolysis of the biopolymer using the enzymatic 591
method described above (final volume 1 mL), and analyzed after
removal of the enzymes by filtration. The calibration curve of each DNA adduct with added internal standards was established for quantitative analysis by HPLC–ESI-MS/MS.
Supporting Information (see footnote on the first page of this arti- 596 cle): DEPT, H,H-COSY, and HMQC spectra of 4, 5, 9, and 10, HMBC spectrum of 5, chiral HPLC analysis of precursors to 2 and 4, time-dependent analysis of all adducts by HPLC–ESI-MS/MS, NMR spectroscopic data of all adducts, and data for the formation
of 4, 5, and 9 in calf thymus DNA. 601
Acknowledgments
This work was supported in part by the Environmental and Occu- pational Center grant from the National Taiwan University and National Science Council (project to WSC, NSC-99-2119-M-009- 001-MY2). We also thank Prof. Chung-Ming Sun at NCTU for the 606 specific rotation measurements.
[1] J. M. Lee, T. Y. Liu, D. C. Wu, H. C. Tang, J. Leh, M. T. Wu, H. H. Hsu, P. M. Huang, J. S. Chen, C. J. Lee, Y. C. Lee, Mu- tat. Res.2005, 565, 121–128.
[2] H. Daimon, S. Sawada, S. Asakura, F. Sagami, Carcinogenesis 611 1998, 19, 141–146.
[3] D. H. Phillips, M. V. Reddy, K. Randerath, Carcinogenesis 1984, 5, 1623–1628.
![Figure 3. H,H-COSY spectrum of 5 (300 MHz, [D 6 ]DMSO).](https://thumb-ap.123doks.com/thumbv2/9libinfo/9093077.378935/5.974.497.856.722.964/figure-h-h-cosy-spectrum-mhz-d-dmso.webp)
![Figure 4. HMBC spectrum of 9 (500 MHz, in [D 6 ]DMSO).](https://thumb-ap.123doks.com/thumbv2/9libinfo/9093077.378935/6.974.497.850.445.708/figure-hmbc-spectrum-mhz-d-dmso.webp)