國立臺灣大學牙醫專業學院臨床牙醫學研究所 碩士論文
Graduate Institute of Clinical Dentistry School of Dentistry
National Taiwan University Master Thesis
褪黑素對於牙根尖細胞生物功能之影響 Effect of Melatonin on the Biological Activity of
Human Apical Papilla Cells
仲柏澔 Bo-Hao Zhong
指導教授:鄭景暉 教授 Advisor: Jiiang-Huei Jeng, Ph.D.
中華民國 107 年 8 月
August 2018
中文摘要
實驗目的:褪黑素因具有多種不同的生物學功能,已經被廣泛應用於幹細胞和組 織工程等研究領域。而根據先前的研究,人類牙根尖細胞 (apical papilla cells) 顯 示出具有幹細胞的特徵跟能力,並被稱為根尖乳突幹細胞 (Stem cells from the apical papilla, SCAP)。本研究的目的是想探討褪黑素對牙根尖細胞的影響以及 PKA 和 PKC 信號通路的作用。
實驗方法:本實驗用不同濃度的褪黑素來刺激與培養牙根尖細胞,部分組別加入 H89 (PKA抑制劑) 或H7 (PKC抑制劑) 做預處理。再以顯微鏡觀察細胞形態,並 用MTT 做細胞存活率分析。使用反轉錄聚合酶連鎖反應 (RT-PCR)、西方墨點法 (western blot) 檢測褪黑素的受體表現,還有齒原細胞和成骨細胞分化相關之基因 跟蛋白的表現。也透過西方墨點法和免疫螢光染色 (immunofluorescent) 染色檢 測信號分子的磷酸化。並使用 phalloidin 染色檢測肌動蛋白絲。
實驗結果: 在人類牙根尖細胞中,有表現褪黑素受體 MT1、MT2、MT3 和 RORα。加入褪黑素處理會增強成骨相關的轉錄因子 Runx2 和 SP7 的表現。對於 跟細胞移動有關的作用,我們發現褪黑素會促進 cofilin 的磷酸化並刺激肌動蛋白 絲聚合。但褪黑素並沒有改變 cofilin-1 本身的基因和蛋白表現。而 H7 會抑制褪 黑素誘導的 cofilin 磷酸化,H89 則反而更刺激磷酸化 cofilin 的表現。
結論:這是首次檢測出人類牙根尖細胞中有表現褪黑素受體的研究。因為褪黑素 對牙根尖細胞的影響是複雜的,並且可能會根據給藥物的劑量和作用時間而不 同。值得進一步深入研究褪黑素的相關生物功能,這將會對未來的臨床治療很有 幫助,無論是在再生牙髓病學領域或是骨頭再生跟重建的領域。
關鍵字:再生牙髓病學,牙根尖細胞,根尖乳突幹細胞,褪黑素,褪黑素受體
Abstract
Aim: Melatonin owns multiple biological functions in various tissues, and becomes
widely used in multiple areas including stem cell biology and tissue engineering. Human
apical papilla cells have been reported to show characteristics of stem cells and are known
as stem cells from apical papilla (SCAP). The purpose of this study is to investigate the
effects of melatonin on apical papilla cells and the role of PKA and PKC signaling
pathways.
Materials and methods: Primary-cultured human apical papilla cells were treated with
different concentrations of melatonin and also with/without H89 (an inhibitor of PKA) or
H7 (an inhibitor of PKC) pretreatment. Microscope observed cell morphology. Cell
proliferation was measured by MTT assay. The expression of melatonin receptors,
odontogenic/osteogenic transcription factors, differentiation markers, and actin
depolymerizing factors were examined by reverse transcription polymerase chain
reaction (RT-PCR) and western blot. Phosphorylation of signaling molecules was
examined by western blot and immunofluorescent (IF) staining. Actin filaments were
detected by phalloidin staining.
Results: In human apical papilla cells, the expression of melatonin receptors, MT1, MT2,
MT3/NQO2, and RORα were found. Treatment with melatonin (10~500 μg/ml) enhanced
the expression of osteogenic transcription factors, Runx2 and SP7. In cell migration and
morphogenesis, melatonin increased the phosphorylation of cofilin and stimulated actin
filament polymerization. However, the mRNA and protein levels of cofilin1 were not
changed by melatonin treatment. The enhancement of cofilin phosphorylation which
induced by melatonin was repressed by H7, while H89 even stimulated the expression of
p-cofilin.
Conclusion: This is the first study to detect the expression of melatonin receptors in
human apical papilla cells. However, the effect of melatonin on apical papilla cells is
complicated and might be divergent depending on the dose and duration of treatment.
Further investigating the biological activity of melatonin would be useful for clinical
therapies in the future, including regenerative endodontics and bone regeneration.
Keyword: regenerative endodontics, apical papilla cells, stem cells from apical papilla,
melatonin, melatonin receptors
Table of Content
中文摘要 ... i
Abstract ... iii
Table of Content ... vi
List of Figures ... x
List of Tables ... xiiii
Abbreviations List ... xiv
Chapter I Literature Review ... 1
1.1 Regenerative endodontics ... 1
1.2 Stem cells from apical papilla ... 4
1.3 Signaling molecules and scaffold ... 6
1.4 Treatment procedures for regenerative endodontics ... 7
1.5 Melatonin ... 8
1.5.1 Mechanisms of melatonin action ... 9
1.5.2 Melatonin in tissue engineering and regenerative medicine ... 11
1.6 Odontogenic/osteogenic transcription factors ... 12
1.7 Odontogenic/osteogenic differentiation markers... 12
1.8 Chemotaxis and cell migration ... 14
Chapter II Research Purposes and Hypothesis ... 16
Chapter III Materials and Methods... 17
3.1 The culture of human apical papilla cells ... 17
3.2 Observation of cell morphology ... 17
3.3 MTT assay ... 18
3.4 RNA extraction and reverse transcription-PCR ... 19
3.4.1 Isolation of total RNA ... 19
3.4.2 RNA quantitation ... 20
3.4.3 Reverse transcription (RT) ... 20
3.4.4 Polymerase chain reaction (PCR) ... 21
3.4.5 Gel electrophoresis ... 21
3.5 Western blot ... 22
3.5.1 Protein extraction ... 22
3.5.2 Protein quantification ... 22
3.5.3 Sodium dodecyl sulfate-polyacrylamide gel electrophoresis (SDS-
PAGE) 23
3.5.4 Transfer gel ... 23
3.5.5 Blocking and antibody hybridization ... 24
3.5.6 Chemiluminescence photography ... 25
3.6 Immunofluorescence (IF) staining... 25
3.7 Phalloidin staining ... 26
3.8 Statistical analysis ... 27
Chapter IV Results ... 28
4.1 Expression of melatonin receptors ... 28
4.2 Cell morphological observation ... 28
4.3 Effects of melatonin on cell viability of apical papilla cells - MTT assay . 28 4.4 Effect of melatonin on the expression of transcription factors ... 29
4.5 Effect of melatonin on the expression of odontogenic/osteogenic differentiation markers ... 29
4.6 Effect of melatonin on the regulation of cofilin ... 30
4.7 Effect of melatonin on the expression of N-cadherin ... 30
4.8 Effect of H89 on the melatonin regulation ... 30
4.9 Effect of H7 on the melatonin regulation ... 31
4.10 Effect of melatonin on the actin filament formation ... 31
4.11 Effect of melatonin on the expression of p-CREB ... 31
Chapter V Discussion ... 32
5.1 Tissue distribution of melatonin receptors ... 32
5.2 Effect of melatonin in odontogenesis and osteogenesis ... 33
5.3 Effect of melatonin on actin filaments ... 35
5.4 Potential signaling pathways involved in the biological activity of melatonin on human apical papilla cells ... 37
Chapter VI Conclusions ... 39
References... 40
Figures ... 47
Tables ... 65
List of Figures
Figure 1. The structural formula of melatonin ... 47
Figure 2. Mechanisms of melatonin action ... 47
Figure 3. Expression of melatonin receptors (MT1, MT2) in apical papilla
cells treated with different concentrations of melatonin for 24hours. .... 48 Figure 4. Expression of melatonin receptors (MT3/NQO2, RORα) in apical
papilla cells treated with different concentrations of melatonin for
24hours. ... 49
Figure 5. Morphological observation of apical papilla cells treated with
different concentrations of melatonin for 5 days. ... 50
Figure 6. MTT assay of apical papilla cells treated with different
concentrations of melatonin for 5 days. ... 51
Figure 7. Expression of odontogenic/osteogenic transcription factors in apical
papilla cells treated with different concentrations of melatonin. ... 52
Figure 8. Expression of type I collagen in apical papilla cells treated with
different concentrations of melatonin. ... 53
Figure 9. Expression of BSP and OCN mRNA in apical papilla cells treated
with different concentrations of melatonin. ... 54
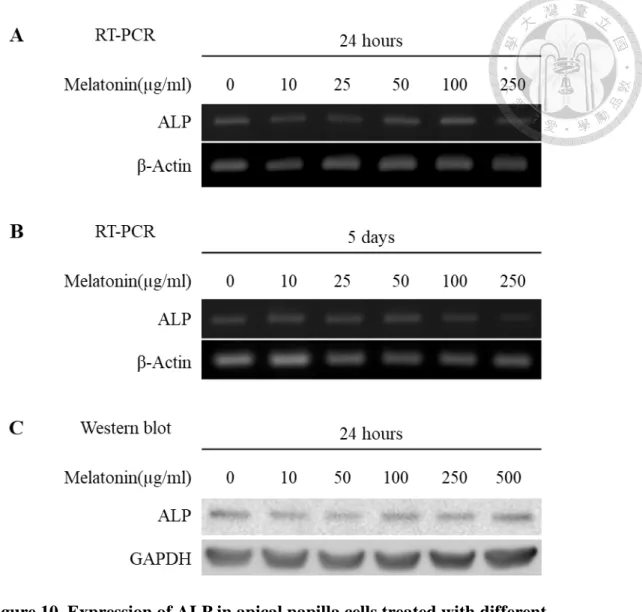
Figure 10. Expression of ALP in apical papilla cells treated with different
concentrations of melatonin. ... 55
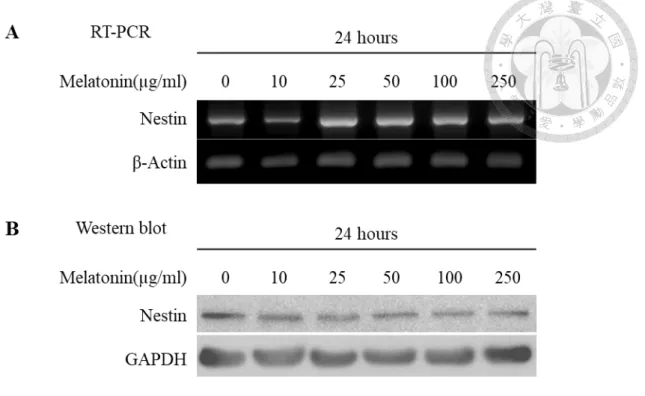
Figure 11. Expression of Nestin in apical papilla cells treated with different
concentrations of melatonin for 24 hours. ... 56
Figure 12. Expression of total cofilin1 in apical papilla cells treated with
different concentrations of melatonin. ... 57
Figure 13. Expression of phospho-cofilin in apical papilla cells treated with
different concentrations of melatonin. ... 58
Figure 14. Expression of N-cadherin in apical papilla cells treated with
different concentrations of melatonin. ... 59
Figure 15. Effect of H89 (PKA inhibitor) on the expression of previously
described proteins in apical papilla cells treated with 250 µg/ml for 5
days. ... 60
Figure 16. Effect of H7 (PKC inhibitor) on the expression of previously
described proteins in apical papilla cells treated with 250 µg/ml for 5
days. ... 60
Figure 17. Phalloidin staining of actin filaments expression in apical papilla
cells treated with different concentrations of melatonin for 5 days (100x
magnification). ... 61
Figure 18. Phalloidin staining of actin filaments expression in apical papilla
cells treated with different concentrations of melatonin for 5 days (400x
magnification). ... 62
Figure 19. Immunofluorescence staining of p-CREB in apical papilla cells
treated with different concentrations of melatonin for 5 days (100x
magnification). ... 63
Figure 20. Immunofluorescence staining of p-CREB in apical papilla cells
treated with different concentrations of melatonin for 5 days (400x
magnification). ... 64
List of Tables
Table 1. Sequences of PCR primer and expected product size ... 65
Table 2. Protocols of protein extraction buffer preparation ... 66
Table 3. Protocols of resolving gel preparation ... 66
Table 4. Protocols of stacking gel preparation ... 67
Table 5. Protocols of running buffer preparation ... 67
Table 6. Protocols of transfer buffer preparation ... 68
Table 7. Western blot primary antibodies ... 68
Table 8. Protocol for Western Blot TBST preparation ... 69
Abbreviations List
SCAP PKA PKC MT1 MT2 NQO2 RORα Runx2 PCR
Stem cells from the apical papilla Protein kinase A
Protein kinase C Melatonin receptor 1 Melatonin receptor 2 Quinone oxidoreductase 2
Retinoid-related orphan receptor α Runt-related transcription factor 2 polymerase chain reaction
Chapter I Literature Review
1.1 Regenerative endodontics
The permanent tooth needs up to 3 years to achieve complete root formation and the apical closure after the tooth eruption (Moorrees, Fanning, & Hunt, 1963). The immature teeth are at risk of pulp injury due to trauma, caries, and anatomic variations such as dens evaginatus and dens invaginatus. Because the dens evaginatus tubercle may extend above the occlusal surface, the tubercle fracture due to occlusal force is a common etiology leading to pulp exposure. All the above-mentioned injury always causes pulpal infection followed by pain. But sometimes, no symptoms and signs exhibit until pulpal necrosis and abscess occur. In addition, the loss of pulp vitality results in cessation of dentin deposition and root maturation leaving an open root apex and thin dentinal walls that are prone to fracture (Cvek, 1992; Jeeruphan et al., 2012). Under those conditions, apexogenesis as a conservative treatment approach is the first consideration. It is a treatment designed to preserve vital pulp tissue in apical part the root canal to permit continuing root development and apical closure. Because immature permanent teeth have a rich cellular and vascular supply, some vital pulp tissue may survive despite the development of a periradicular abscess. It is suggested by case reports showing immature teeth with apical periodontitis or abscess undergoing apexogenesis (Chueh & Huang, 2006; Jung, Lee, & Hargreaves, 2008).
However, the dental pulps in many clinical cases have already undergone total tissue necrosis due to severe infected condition before treatment. Traditionally, these teeth would be treated with apexification. The treatment procedures include disinfection and
either using long-term dressing with calcium hydroxide, or placing mineral trioxide aggregate (MTA) to physically create an apical plug (Hargreaves, Cohen, Berman, &
Rotstein, 2016). Although both techniques often relieve signs and symptoms of the diseases and promote periapical tissue healing, these treatments have fundamental problems. There is no further root development, so the roots remain thin and fragile with a higher risk of fracture and tooth loss (Andreasen, Farik, & Munksgaard, 2002; Silujjai
& Linsuwanont, 2017).
Recently, it has been suggested that an alternative technique, regenerative endodontic therapy, is intended to promote tooth survival and masticatory function (Hargreaves, Giesler, Henry, & Wang, 2008). Regarding the development of contemporary regenerative endodontics, it can trace back to in the early 2000s. The publication of a remarkable case report of revascularization catalyzed the emergence of regenerative endodontics (Banchs & Trope, 2004). Banchs and Trope presented a treatment protocol for an immature permanent tooth with pulp necrosis. After proper canal disinfection, they evoked bleeding from the apical region to form a blood clot in the canal space. Then double seal was made with MTA covered by a bonded resin. The follow-up radiograph showed complete resolution of the radiolucency and thickening of the dentinal walls. However, this procedure was already described by Dr. Östby in the early 1960s, and that introduced the role of the apical blood clot in the healing of apical periodontitis and pulp repair (Östby, 1961). But the disinfection protocol and filling materials in this contemporary revascularization technique were quite different to the past.
Since the early 2000s, several case series have been published and showed resolution of periapical radiolucency and continued root development in immature teeth with pulpal necrosis and apical periodontitis (Murray, Garcia-Godoy, & Hargreaves, 2007; Petrino,
Boda, Shambarger, Bowles, & McClanahan, 2010). Those successful case reports offered an alternative approach to treat these complex clinical cases. Although several groups used different irrigation protocols and intracanal medicaments, the widely used concept of biocompatible disinfection and the evoked bleeding step have been established in regenerative endodontic therapy. In order to maintain the physical integrity of the already thin dentinal walls of immature teeth, and to protect the vitality of remaining cells in the apical part of the canal. Biocompatible disinfection is minimal or no instrumentation of the canal while relying on chemical debridement as the primary means of disinfection (Huang, 2008).
In 2011, a clinical study demonstrated that the influx of apical blood into disinfected root canals was accompanied by a clinically significant transfer of mesenchymal stem cells into the root canal system (Lovelace, Henry, Hargreaves, & Diogenes, 2011).
Because it demonstrated that autogenous stem cells could be clinically delivered into canal space, this important finding indicated that these procedures were biologically based procedures. It also means researchers and clinicians should consider the principles of tissue engineering to propel the development of regenerative endodontics.
Consequently, the American Association of Endodontists (AAE) defined regenerative endodontics as “biologically based procedures designed to replace damaged structures, including dentin and root structures, as well as cells of the pulp-dentin complex” (AAE, 2016).
There are three major components of tissue engineering: stem cells, signaling molecules, and scaffolds (Murray et al., 2007). Stem cells or progenitor cells are reliable cell source capable of differentiation. Signaling molecules, including growth factors and other compounds, are capable of stimulating cellular proliferation, migration and
directing cellular differentiation. In addition, an appropriate scaffold provides support for cell organization, proliferation, differentiation and vascularization (Hargreaves, Diogenes,
& Teixeira, 2013; Hargreaves et al., 2008).
1.2 Stem cells from apical papilla
Stem cells are defined as cells owning the capacity for differentiation and continuously divide. Mesenchymal stem cells (MSCs) are non-hematopoietic multipotent progenitor cells capable of differentiating into multiple cell types, including osteoblasts, adipocytes, chondrocytes, and cells of the neural lineage. MSCs can be found in many tissues and organs like bone marrow, adipose tissue, umbilical cord blood, stroma, placenta, and lung (Ankrum, Ong, & Karp, 2014). Within the human tooth and its environment, several MSCs can be distinguished, such as dental pulp stem cells (DPSC), stem cells from the apical papilla (SCAP), dental follicle precursor cells (FSC), and periodontal ligament stem cells (PDLSC) (Hilkens, Meschi, Lambrechts, Bronckaers, &
Lambrichts, 2015).
In regenerative endodontic therapy, regeneration of tissue may come from stem cells already residing in vital pulp tissue, the apical papilla, PDL or alveolar bone (Huang et al., 2008). The evoked bleeding step as a method to introduce stem cells into the root canals is a significant concept in regenerative endodontics. The evoked bleeding step is a method to introduce stem cells into the root canals is a significant concept because it provides access to the most readily available sources of MSCs, apical papilla, for potential dental pulp regeneration (Chrepa, Henry, Daniel, & Diogenes, 2015; Hargreaves et al., 2013; Lovelace et al., 2011).
The apical papilla is a loosely attached soft connective tissue at the apex of developing permanent teeth. Sonoyama et al. were the first to isolate and characterize the residing stem cell population from the apical papilla, that is, SCAP. Compared with DPSC, SCAP show a significantly higher ability of proliferation rate, population doublings, dentin regeneration capacity and better migratory properties (Huang et al., 2008;
Sonoyama et al., 2006; Sonoyama et al., 2008).
In clinically, many immature teeth suffering from apical periodontitis and/or apical abscesses, which reported to continue root development after conservative treatment (Chueh & Huang, 2006; Huang, 2008; Huang et al., 2008; Jung et al., 2008; Petrino et al., 2010). More recently, a report showed that apical papilla cells may survive and retained stem cell vitality despite intense inflammatory infiltrate following pulp necrosis (Chrepa, Pitcher, Henry, & Diogenes, 2017). The evidence also suggests the survival of SCAP after infection and their potential contribution to root formation by differentiating into odontoblasts.
To maximize the disinfection efficacy and minimize the cytotoxicity to SCAP, the clinical considerations of the AAE recommend gentle but thorough irrigation of the canal system with 1.5% concentration of sodium hypochlorite and the use of either calcium hydroxide or low concentration of triple antibiotic paste between appointments as the intracanal medicament in regenerative endodontic procedures (Kontakiotis, Filippatos, Tzanetakis, & Agrafioti, 2015). However, 2% chlorhexidine gluconate has been found to induce serious cytotoxic effects of stem cells (Trevino et al., 2011). Clinicians should prevent using it in regenerative endodontic therapy.
1.3 Signaling molecules and scaffold
Regarding the signaling molecules participated in regenerative endodontics, dentin- derived growth factors/cytokines are thought to play a key role in the regulation of the inflammatory response and tissue regenerative processes. These growth factors/cytokines such as transforming growth factor beta (TGFβ) and bone morphogenic protein (BMP) are secreted by the odontoblasts during primary dentinogenesis and embedded into the dentin after biomineralization. Research on dentin structure and composition has highlighted that the matrix is considered a reservoir of growth factors and cytokines (Smith & Lesot, 2001). Translational studies have demonstrated that ethylenediaminetetraacetic acid (EDTA) releases the growth factors embedded in dentin, thus promoting proliferation, migration, and differentiation of stem cells (Galler et al., 2016). Therefore, the clinical considerations of the AAE recommend final irrigation with 17% EDTA before the evoked bleeding step in regenerative endodontic procedures (Kontakiotis et al., 2015).
The scaffold is also an important component of tissue engineering to provide a spatially correct position of cell location and regulate differentiation, proliferation, or metabolism. The evoked bleeding step in regenerative endodontic procedures not only promotes the accumulation of progenitor/stem cells into the root canal space but also creates a stable blood clot serves as a scaffold for cell growth and cell differentiation (Kontakiotis et al., 2015).
1.4 Treatment procedures for regenerative endodontics
The first issue is case selection. This treatment should be considered for the immature permanent tooth with an open apex and is diagnosed with pulp necrosis according to clinical and radiographic information. At the first appointment, the treatment alternatives, risks, and potential benefits should be described to the patient and guardian.
Following informed consent, perform adequate local anesthesia, rubber dam isolation, then access the tooth. The root canal systems are gently irrigated with 1.5% NaOCl (20 mL/canal, 5 min) and then dried with paper points. Calcium hydroxide or an antibiotic paste in lower concentration (less than 1 mg/mL) is delivered to canal system as the intracanal medicament. The tooth is then sealed with a proper temporary filling.
The second appointment is usually 2 to 4 weeks after the first visit. A clinical examination is first performed to ensure that the tooth has no signs or symptoms. If percussion or palpation sensitivity is observed, or a sinus tract or swelling is noted, then the treatment provided at the first visit should be repeated. In most reported cases, the discomfort resolved after the disinfection treatment (Diogenes, Henry, Teixeira, &
Hargreaves, 2013). Because evoked bleeding will be performed at this appointment, the tooth should be treated with a local anesthetic without vasoconstrictor. Irrigate the root canal systems 17% EDTA after the intracanal medicament is removed. Then, the canals are dried with paper points. Bleeding is induced by irritating the apical tissue at 2 mm past the apical foramen with endo file or endo explore. The goal is having the whole canal filled with blood to the level of the cementoenamel junction. Once a blood clot is formed, 3 mm of MTA is carefully placed on top of the blood clot to serve as the coronal barrier.
However, in clinical, the intracanal bleeding is sometimes difficult to achieve sufficient amount and always needs more than 15 minutes to form the stable blood clot
(Jung et al., 2008). The combined use of biodegradable matrix such as collagen sponge to help the blood clot formation and provide structural support for the MTA coronal barrier is usually a kind of improvement (Kontakiotis et al., 2015). In addition to this, the field of regenerative endodontics also dedicates to incorporate signaling molecules with biodegradable materials for promoting proliferation, migration, and differentiation of stem cells.
1.5 Melatonin
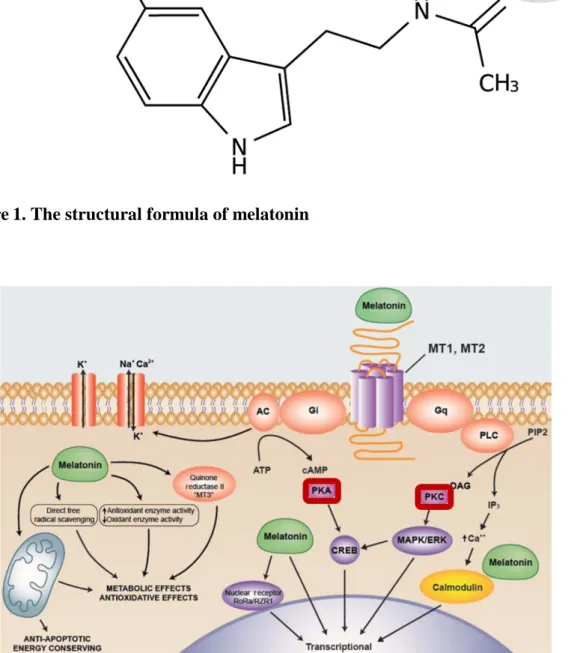
Melatonin (N-acetyl-5-methoxy tryptamine) is a molecule predominantly produced by the pineal gland (Reiter, 1991). The chemical structure is shown in Figure 1.
Melatonin regulates the coupling of circadian rhythms, especially core temperature and sleep-wake cycle but also influences physiological functions such as immune function, tumor growth inhibition, antioxidant protection and redox homeostasis (Carrillo-Vico, Guerrero, Lardone, & Reiter, 2005; Hardeland, Madrid, Tan, & Reiter, 2012; Mauriz, Collado, Veneroso, Reiter, & Gonzalez-Gallego, 2013; Mills, Wu, Seely, & Guyatt, 2005).
The synthesis and release are activated during darkness and inhibited by light.
Information on light/dark environments is transmitted via the retinohypothalamic tract to the suprachiasmatic nucleus (SCN). After that, an electrical signal is transferred to the pineal gland via complex autonomic neural circuitry, which is ultimately conveyed by postganglionic sympathetic fibers. The postganglionic terminals release norepinephrine, which activates melatonin production via β1 adrenergic receptors in the pinealocyte.
Pinealocytes take up tryptophan from the blood and convert it to serotonin by hydroxylation and decarboxylation. In the darkness, serotonin is converted into N-acetyl-
serotonin by the enzyme N-acetyltransferase (NAT). Subsequently, the enzyme hydroxyindole-O-methyl transferase acts on N-acetylserotonin causing its methylation and forming melatonin (Gomez-Moreno, Guardia, Ferrera, Cutando, & Reiter, 2010).
Melatonin is also produced in the brain, retina, gastrointestinal tract, bone marrow, skin, reproductive organs and lymphocytes, from which it may have similar physiological functions through paracrine, autocrine and antioxidant actions (Pandi-Perumal et al., 2008;
Reiter et al., 2016).
As a medicine, it is used to prevent phase shifts from jet lag and little improvements in insomnia. It is categorized by the US Food and Drug Administration (FDA) as a dietary supplement and is sold over-the-counter in both the US and Canada (Costello et al., 2014).
According to current evidence, melatonin has a very slight side effect profile and limited evidence of habituation and tolerance.
1.5.1 Mechanisms of melatonin action
Melatonin performs its functions using receptor-dependent and receptor- independent pathways (Fig. 2). Melatonin can diffuse through biological membranes easily and acts as a direct scavenger in subcellular compartments. Intracellularly, melatonin can serve as a direct free radical scavenger in all subcellular compartments as well as bind the cytosolic calcium-binding messenger protein calmodulin, cytosolic quinone oxidoreductase 2 (NQO2, also known as MT3) (Nosjean et al., 2000) and the nuclear retinoic acid receptor subfamily including retinoid-related orphan receptors (RORs) and retinoid Z receptors (RZRs). Furthermore, melatonin can also bind and activate two membrane melatonin receptors, MT1 and MT2.
Both of MT1 and MT2 receptors belong to the G protein-coupled receptor superfamily with seven transmembrane domains (Jockers, Maurice, Boutin, &
Delagrange, 2008). The alpha subunits of G protein which coupled with MT1 and MT2 receptors can directly inhibit adenylyl cyclase activity. This inhibition lowers cAMP levels and suppresses protein kinase A (PKA) activity, which influences phosphorylation and activity of the cellular transcription factor CREB (cAMP response element-binding protein) (Dubocovich, Rivera-Bermudez, Gerdin, & Masana, 2003; Witt-Enderby, Bennett, Jarzynka, Firestine, & Melan, 2003).
Besides, MT1 and MT2 receptors can also couple to the beta/gamma subunit of G protein and activate phospholipase C (PLC), which leads to increase inositol-(1,4,5)- triphosphate (IP3) and diacylglycerol (DAG). DAG activates protein kinase C (PKC), which modulates the activity of the mitogen-activated protein kinase/extracellular signal- related kinase (MAPK/ERK) pathway, again ultimately influencing the activity of transcription factors including CREB. Moreover, IP3 also stimulates the release of intracellular calcium and activate signaling by Calmodulin (Slominski, Reiter, Schlabritz- Loutsevitch, Ostrom, & Slominski, 2012).
Regarding the distribution and expression of MT1 and MT2, the published studies are largely on MT1. MT1 receptors are extremely widespread in various tissues of the body, while MT2 receptors are relatively less expressed (Pandi-Perumal et al., 2008). In several tissues, the co-expression of both receptor types has been reported, and the formation of MT1-MT2 heterodimer has also been found (Ekmekcioglu, 2006; Jockers et al., 2008).
As for the MT3 receptor, the existence was theorized at one time. However, this biological target of melatonin was found to actually be a cytosolic enzyme, quinone oxidoreductase 2 (NQO2) (Nosjean et al., 2000). This enzyme catalyzes the reduction of quinones.
1.5.2 Melatonin in tissue engineering and regenerative medicine
Among the numerous functions of melatonin, the regulatory effect on the viability, proliferation, and differentiation of MSCs has recently been reported. Numerous studies demonstrate that melatonin regulates the differentiation of MSCs into chondrogenic, osteogenic, and myogenic lineages. Studies carried out on osteogenic differentiation suggest that melatonin enhances osteogenesis through the activation of Wnt/β-catenin and MAPK signaling pathways and increasing the expression of osteoblast-related markers (Luchetti et al., 2014). Other studies suggest that melatonin, by decreasing PPARγ in MSCs, directly inhibits adipogenic differentiation and enhances osteoblastogenesis to gaining bone formation in tissue repair (Takada, Kouzmenko, & Kato, 2009; Zhang et al., 2010). Recently, a study describes the melatonin’s stimulation of osteoblastogenesis and inhibition of osteoclastogenesis under the mechanisms of OPG and RANKL (Maria et al., 2018). As for odontogenic differentiation, a study demonstrates the effects of melatonin on the differentiation of human dental pulp cells (hDPCs). The hDPCs cultured in osteogenic induction medium with melatonin presented an increase of ALP activity, expression of DSPP, mRNA levels of ALP and DSPP, and mineralization nodules formation (Liu et al., 2017).
Melatonin also protects MSCs against oxidative stress-induced apoptosis as well as has the beneficial effects in wound healing. It involves as an antioxidant and anti- inflammatory agent in the suppression of the chronic wound severity and enhancement of the wound contraction (Pugazhenthi, Kapoor, Clarkson, Hall, & Appleton, 2008).
Owing to its vast biological activities, melatonin emerges as a novel and potential molecule use in tissue engineering and regenerative medicine. For this reason, it is wondering if the protective/regenerative effects of melatonin can be applied in
regenerative endodontics. However, there have been no studies reported biological activity of melatonin in human apical papilla cells.
1.6 Odontogenic/osteogenic transcription factors
Runx2 is a master transcription factor during the early stage of osteogenesis. And Osterix/SP7, a zinc-finger-containing transcription factor, is a second transcription factor that participates in osteogenesis at mid-late stages (Komori, 2006). Moreover, Osterix is expressed in functional osteoblasts and required for mature bone formation (Nakashima et al., 2002).
Runx2 was also expressed in the dental papilla and dental sac, suggesting it might be viewed as a transcription factor of odontoblast differentiation. Its presence in dental papilla at the bud and cap stages of odontogenesis has an osteogenic-like influence, while its removal triggers terminal events in odontoblast differentiation (Camilleri & McDonald, 2006). In addition, a previous study demonstrated that knockout of Osterix inhibited odontoblast differentiation in mice, leading to thin root dentin with disordered dentinal tubules (Kim et al., 2015). Taken together, Runx2 is upstream of Osterix in the odontogenic/osteogenic differentiation signaling pathway and determines the odontoblast and osteoblast lineage from mesenchymal cells (S. Chen et al., 2009; Du, Wang, Yang,
& Wang, 2016).
1.7 Odontogenic/osteogenic differentiation markers
The main component of dentine, cementum and bone substance are mineralized extracellular matrices consisting of organic and inorganic substances. In all of the components, the organic component is comprised of 90% (by weight) of type I collagen
fibers and 10% of non-collagenous proteins. The inorganic phase is constituted by small crystals of an alkaline mineral character, hydroxyapatite (HA) (Goldberg, Kulkarni, Young, & Boskey, 2011).
Type I collagen is the most abundant and important matrix molecule. It forms a three-dimensional network into which non-collagenous proteins and the nucleation of hydroxyapatite crystals are deposited. Although the non-collagenous proteins are minor constituents of the matrix, most of them play an important role in regulating the mineralization process. Thus, the non-collagenous proteins are often used as markers of odontogenic/osteogenic differentiation.
For example, bone sialoprotein (BSP) is a marker of osteogenic differentiation. It promotes the formation of initial apatite crystals (Hunter & Goldberg, 1993). Then, as the mineral grows on the collagen matrix, BSP acts as an inhibitor in directing the growth of the crystals. In the tooth, BSP can be observed in cementum, predentin and under the physiologic conditions of primary or secondary dentinogenesis (Moses, Butler, & Qin, 2006).
Osteocalcin (OCN) is another non-collagenous proteins secreted by osteoblasts to stimulate the bone mineral maturation, and finally, the mature osteoblasts are embedded in the bone matrix to become osteocytes (Komori, 2006). Although odontoblasts also synthesize OCN, it has closer relations with bone maturation to be viewed as a late-stage marker of bone formation (Zhou et al., 2017).
Alkaline phosphatase (ALP) is an enzyme that hydrolyzes pyrophosphate and provides inorganic phosphate to promote mineralization. Thus, ALP is widely used as a marker of hard tissue cell differentiation. The measurement of increased ALP expression
enzymatically, histochemically or at the mRNA level is taken as a reliable indication of the osteoblastic or odontoblastic phenotype (Golub & Boesze-Battaglia, 2007).
Lastly, Nestin is an intermediate filament most related to neurofilaments and expressed predominantly in the developing nervous system and muscles. But some studies founded that Nestin has been shown to be preferentially expressed in odontoblasts or odontoblast-like cells when in the active secretory function. The results from these studies indicate that Nestin expression could be used in conjunction with other markers to identify odontoblast-like cells better (About, Bottero, et al., 2000; About, Laurent- Maquin, Lendahl, & Mitsiadis, 2000)
1.8 Chemotaxis and cell migration
In cases in which apical papilla is still viable, SCAP may be present and could be attracted into the canal space to regenerate the pulp by the evoked bleeding step. Thus, applying signal molecules to enhance chemotaxis and cell migration into the canal space that is an important factor to achieve tissue regeneration.
Actin is a protein that forms several cytoskeletal structures, such as filopodia, lamellipodia, invadopodia, stress fibers, and cortical actin networks. Actin filament dynamics and reorganization are fundamental for a variety of cell activities, including migration, secretion, gene expression, and polarity formation (Mizuno, 2013). The cell responds to a chemotactic signal by activating actin polymerization; then the cell forms a protrusion oriented towards the source (Hitchcock-DeGregori, 2006).
Cofilin is an actin-depolymerizing factor that stimulates severance and depolymerization of actin filaments and promotes actin filament turnover. Cofilin is
inactivated by phosphorylation at Ser-3 by LIMKs, and that is one of important regulation in actin cytoskeletal dynamics (Mizuno, 2013).
Moreover, cadherins are a family of transmembrane proteins that mediate calcium- dependent cell-cell adhesion involved in the regulation of various biological processes.
Among them, N-cadherin has been shown to modulate cell migration and motility (Diamond, Sun, Ottaviano, Joseph, & Munshi, 2008; Hazan, Phillips, Qiao, Norton, &
Aaronson, 2000). N-cadherin is normally expressed in neuroectodermal and mesoderm- derived tissues. In addition, N-cadherin is strongly expressed in osteoblast and regulates odontoblast differentiation (Marie, 2002). N-cadherin has also been reported as an important role for odontoblast function in normal development and under pathological conditions (Heymann et al., 2002).
Chapter II Research Purposes and Hypothesis
Melatonin is becoming widely used in various areas including stem cell biology and tissue engineering. However, the biological activity of melatonin on the human apical papilla cells has not been reported. According to the previous relative studies, we hypothesized that human apical papilla cells express melatonin receptors. Moreover, melatonin could promote cell proliferation, odontogenic/osteogenic differentiation and mediate cell migration in apical papilla cells. Therefore, we examined the presence of melatonin receptors and measured the effect of melatonin on differentiation by analysis of the expression of transcription factors, genes, and proteins, which are related to odontogenic/osteogenic differentiation. We also evaluated the effect of melatonin on the cell migration by detecting the expression of actin depolymerizing factors and actin filament formation. In addition, we also conducted experiments that apical papilla cells have pretreated with PKA or PKC inhibitor before melatonin treatment to determine the mechanism.
Chapter III Materials and Methods
3.1 The culture of human apical papilla cells
Healthy human premolars with immature root development were extracted from 6 donors due to orthodontic treatment under the approval of Ethics Committee, National Taiwan University Hospital and the written consent of patients and their guardians. The apical papilla tissues were detached from root apex and minced into small pieces (about 1x1x1 mm3). The outgrowth apical papilla cells were seeded in a 10-cm dish and cultured with Dulbecco’s modified Eagles medium (DMEM) containing 10% fetal bovine serum (FBS), 1% penicillin and 2% glutamine in the condition of 37℃, 5% CO2 and 95% air.
The medium was changed twice a week. The apical papilla cells at passages 4 to 8 were used in our experiments.
3.2 Observation of cell morphology
(1) About 1.5 x 10⁶ cells/well apical papilla cells were seeded into 10 cm dish with DMEM containing 10% fetal bovine serum (FBS), 1% penicillin and 2% glutamine and cultured for 24 hours in the condition of 37℃, 5% CO2 and 95% air.
(2) After 24 hours of incubation, replaced the medium. Cells were cultured with fresh medium containing different concentrations of melatonin (10, 50, 100, 250, 500 μg/ml) and 0.5-1% DMSO (v/v) as vehicle control for another 5 days.
(3) The morphological changes of cells were observed at 100x magnification by a Phase- contrast Microscope.
3.3 MTT assay
The cell viability was estimated by an MTT assay. MTT [3-(4,5-Dimethylthiazol- 2-yl)-2,5-diphenyltetrazolium bromide] would be metabolized into purple formazan by mitochondrial dehydrogenase in living cells.
(1) About 1 x 10⁵ cells/well apical papilla cells were seeded into 24-well plates with DMEM containing 10% fetal bovine serum (FBS), 1% penicillin and 2% glutamine and cultured for 24 hrs.
(2) After 24 hours of incubation, replaced the medium. Cells were cultured with fresh medium containing different concentrations of melatonin (10, 50, 100, 250, 500 or 2,10, 50, 100, 250 μg/ml) and 0.5-1% DMSO (v/v) as vehicle control for another 5 days.
(3) After incubation, each well was replaced with 1 ml fresh medium and incubated for 30 minutes. Then 20 μl MTT was added into each well and incubated for 2 hours in a dark place.
(4) Two hours later, removed the medium and added 500 μl dimethylsulfoxide (DMSO) into each well. Then gently shook the plate to fully dissolve the MTT formazan.
(5) 100 μl of discolored solution from each well was transferred to 96-well plate and read against the blank (DMSO) at 540 nm with a Dynatech Microwell plate reader (Dynatech Microwell, Alexandria, Virginia, USA).
(6) The estimated cell viability (%) = [(sample OD540 value - blank OD540 value) ∕ (control OD540 value - blank OD540 value)] x 100.
3.4 RNA extraction and reverse transcription-PCR
About 1.5 x 10⁶ cells of apical papilla cells were seeded into 10 cm culture dishes with DMEM containing 10% fetal bovine serum (FBS), 1% penicillin and 2% glutamine and exposed to different concentrations of melatonin (10, 50, 100, 250, 500 μg/ml) and DMSO as vehicle control (0.5% final concentration) for 24 hours or 5 days.
3.4.1 Isolation of total RNA
NucleoSpin® RNA (Macherey-Nagel, Germany) isolation kits were used to isolate cellular RNA.
(1) Removed the medium and the cells were washed twice with 1ml PBS.
(2) Lysis buffer was prepared by adding 35 μl β-mercaptoethanol to 3.5 ml RA1. Added 360 μl lysis buffer (RA1: β-mercaptoethanol = 100:1) to each culture dish was added to inactivate RNases and lyse cells for 30 minutes.
(3) The lysed cells were scraped off and collected to the NucleoSpin® Filter in a Collection Tube. The solution was centrifuged at 11,000 rpm for 1 minute to clear the lysate.
(4) Discarded the NucleoSpin® Filter and 350 μl 70% ethanol was added to the lysate with mixing by pipetting up and down for 5 times.
(5) The mixed solution was transferred to the NucleoSpin® RNA Column Tubes and centrifuged at 10,000 rpm for 30 seconds.
(6) Added 350 μl Membrane Desalting Buffer, then centrifuged at 11,000 rpm for 1 minute.
(7) DNase reaction mixture was prepared with 10 μl DNase and 90 μl Reaction Buffer for DNase. Then 95 μl DNase reaction mixture was added to each Column and incubation at room temperature for 60 minutes to lyse cellular DNA.
(8) Wash and dry silica membrane by the following sequence: 200 µl Buffer RAW2 11000 rpm for 30 seconds, 600 µl Buffer RA3 11000 rpm for 30 seconds, 250 µl Buffer RA3 11000 rpm for 2 minutes
(9) Final elution of RNA was performed by adding 80 μl of RNase-free water into a nuclease-free microcentrifuge tube and centrifuged at 14,000 rpm for 1 minute.
(10) The samples were stored at -20℃ or can be used for RT-PCR immediately.
3.4.2 RNA quantitation
The RNA concentration was quantified using an Epoch® plate reader (Biotek Instruments, Winooski, VT, USA) using Take3® plate and Gen5® software (version 2.09) (1) 2 μl of DEPC was taken for blank reference and reset the instrument. Then 2 μl of
each isolated RNA was used for measurement.
(2) The absorbance (A) values and the ratio A260/A280 was used to evaluate the purity of RNA mixture and calculate the concentration of RNA mixture.
3.4.3 Reverse transcription (RT)
Invitrogen Superscript® III First-Strand Synthesis System was used for RT-PCR.
(1) The RNA sample (total 1 μg) was prepared according to the results of RNA quantification, and total volume was made up to 8 μl by adding DEPC water.
(2) Each sample was added with 1 μl Random Hexamers and 1 μl 10 mM dNTP mix and incubated in the PCR machine (2720 Thermal Cycler, Applied Biosystems, CA, USA) for 5 minutes at 65℃ and then placed on ice for at least 1 minute.
(3) Each sample was added with 10 μl cDNA synthesis mixture consisting of 4 μl 5X RT buffer, 2 μl 50 mM MgCl2, 2 μl 0.1 M DTT, 1 μl RNaseOUTTM (40 U/μl), 1 μl SuperScriptTM III RT (200 U/μl). These samples were incubated at 25℃ for 10
minutes, followed by 50℃ for 50 minutes, and terminated the reactions at 85℃ for 5 minutes then stored at -20℃ or can be used for PCR immediately.
3.4.4 Polymerase chain reaction (PCR)
(1) Specific primers (Table 1) were used to detect the expression of various target genes, and BAC (218 bp) was used as the control.
(2) Each PCR mixture contained 5 μl 10X PCR buffer, 1.5 μl 50 mM MgCl2, 1 μl 10 mM dNTP, 0.4 μl Taq DNA polymerase, 1 μl sense primer primers, 1 μl antisense primer and 1~4 µl cDNA depending on the concentration then add 36.1~39.1 μl DEPC water to the final total volume as 50 μl.
(3) PCR was begun with denaturation at 94oC for 5 minutes, followed by 20~40 cycles of incubation at 94℃ for 30 seconds, 55℃ for 30 seconds, 72℃ for 30 seconds, then a final elongation at 72℃ for 7 minutes, and soaked at 4℃.
3.4.5 Gel electrophoresis
(1) 1.8% agarose gels were prepared by adding 4.5 g agarose in 250 ml 0.5X TBE buffer, microwaved for dissolving and followed by adding 100 μl of 10 mg/ml ethidium bromide. Poured the gel into the gel former and immersed the comb. Gels were placed in room temperature for setting and then stored in the freezer before electrophoresis.
(2) Mixed each PCR product with 2 µl 6X DNA loading dye, then 12 μl of each PCR product and 2.5 μl of marker were loaded into the wells of agarose gels separately.
(3) The electrophoresis was run at 100V for about 30 minutes.
(4) The images were photographed by using the UV transilluminator (Major Science).
3.5 Western blot
About 1.5 x 10⁶ cells of apical papilla cells were seeded into 10 cm culture dishes with DMEM containing 10% fetal bovine serum (FBS), 1% penicillin and 2% glutamine and exposed to different concentrations of melatonin (10, 50, 100, 250, 500 μg/ml) and DMSO as vehicle control (0.5% final concentration) for 24 hours or 5 days. In the groups to examine the mechanism of melatonin action, we pretreated the apical papilla cells with/without H89 or H7 (Abcam, Cambridge, UK) (10, 20 μM) for 30 minutes and then treated with melatonin.
3.5.1 Protein extraction
(1) Remove the medium of the dishes and wash the cells with PBS gently 2 times.
(2) The protein extraction buffer (Table 2) was prepared and added 150 μl of the buffer to each dish.
(3) The lysed cells were scraped from the dishes and collected into 1.5 ml Eppendorf tubes.
(4) The cell lysate was placed on ice for 20 minutes, vortex every 5 minutes, and then centrifuged at 13000 rpm for 15 minutes at 4℃.
(5) The supernatant was collected into a new 1.5-ml Eppendorf tube and store at -80℃.
3.5.2 Protein quantification
(1) Diluted protein assay dye (BIO-RAD) was prepared by mixing dye and ddH2O at a ratio of 1:4 and filtering it.
(2) Dilute the standard protein with ddH2O to specific concentrations as following: 0.125, 0.25, 0.5, 1 μg/ml.
(3) For standards (0.125, 0.25, 0.5, 1 μg/ml), 980 μl Protein Assay Dye and 20 μl of standard protein were mixed. And 1 ml protein assay dye was used as the blank.
(4) For samples, 998 μl Protein Assay Dye and 2 μl of protein samples were added. Each sample was vortexed and incubated at room temperature for 5 minutes.
(5) All the standards, samples and blank were changed into 1.5 ml cuvettes to detect OD595nm with the Hitachi U2001 Spectrophotometer
(6) The results of the standard solutions could be formulated to a standard curve (R>0.98). Therefore, the concentrations of protein samples and the loading amount for electrophoresis could be calculated according to the regression equation.
3.5.3 Sodium dodecyl sulfate-polyacrylamide gel electrophoresis (SDS- PAGE)
(1) The 10% resolving gel (Table 3) and stacking gel (Table 4) were made.
(2) The setting gel was fixed onto the gel holder and placed in the tank. The chamber of the tank was filled with new 1X SDS-PAGE running buffer (Table 5).
(3) The quantified protein samples and 2X loading dye were mixed together. The samples were heated at 100℃ for 5 minutes then centrifuged and chilled on ice.
(4) All protein samples (30 μg/lane) and 5 μl protein ladder marker were loaded in the wells of the gels in sequence.
(5) The running machine voltage was set at 80 V. When the marker ran apart; the voltage was switched to 100 V. Until the front of the blue running band approximated the bottom of the gel, the electrophoresis would be terminated.
3.5.4 Transfer gel
(1) After SDS-PAGE, took out the gels and cut to appropriate size. Soaked the Immobilon-P PVDF membrane (Millipore Corporation) in methanol.
(2) Assemble the transfer sandwich in cassettes in the sequence as sponge pad, filter paper, membrane, gel, filter paper, sponge pad. And check no air bubbles are trapped in the sandwich.
(3) Placed the cassette in the transfer tank and placed an ice block in it then filled the tank with transfer buffer (Table 6).
(4) The proteins were electrophoretically transferred to the membranes. The transfer mode was set at 400 mA and run for 2.5 hours.
3.5.5 Blocking and antibody hybridization
(1) After transfer finish, the membranes were immersed in 5% non-fat milk under gently shaking for 1 hour.
(2) The membranes were trimmed and incubated with primary antibodies at 4℃
overnight.
(3) The specific primary antibodies (Table 7) were used in this study to detect the expression of various target proteins, and GAPDH (36 kD) was used as the control.
(4) The next day, membranes were removed from primary antibodies and washed with 1% TBST (Table 8) under gentle shaking for 5 minutes. This procedure was repeated twice.
(5) Then, the membranes were incubated with corresponding secondary antibody solution for 1 hour. The secondary antibodies were human anti-mouse, anti-goat, and anti-rabbit horseradish peroxidase (HRP)-labeled secondary antibodies (Thermo) diluted in 5% skim milk in TBST at the ratio of 1:5000.
(6) After 1 hour, the membranes were washed with 1% TBST under gently shaking for 5 minutes. This procedure was repeated 3 times.
3.5.6 Chemiluminescence photography
(1) The Western Blotting Luminol Reagent (Santa Cruz Biotechnology, Inc., CA, USA) was prepared before use, by mixing solution A and B at a ratio of 1:1 (2 ml and 2ml).
(2) The membranes were immersed in the mixed luminol solution for 15 seconds, and exposed under chemiluminescence and photographed using the Fujifilm LAS-4000 Luminescent Image Analyzer (Fujifilm Life Science, Tokyo, Japan). The exposure time ranged from 10 seconds to 8 minutes, depending on the intensity of protein bands.
3.6 Immunofluorescence (IF) staining
(1) The 10 mm circular cover glasses were placed in 24-well plate. Then 1 x 10⁵ cells of apical papilla cells were seeded into the wells of culture plate with DMEM containing 10% fetal bovine serum (FBS), 1% penicillin and 2% glutamine in the condition of 37℃, 5% CO2 and 95% air.
(2) Replaced the medium after incubation for 24 hours. Cells were cultured with fresh medium containing different concentrations of melatonin (10, 50, 100, 250, 500 μg/ml) and DMSO as vehicle control (0.5% final concentration) for another 5 days.
(3) After incubation, removed the medium and washed the cells with PBS three times and fixed with 1 ml of 4% paraformaldehyde per well for 20 minutes.
(4) After fixation, washed with PBS 3 times and removed PBS.
(5) To let the cells be permeable, 1 ml of 2% PBST (2 ml Tween 20 and 98 ml PBS) was added to each well for 20 minutes and then removed.
(6) Rinsed with 1 ml of 0.3% H2O2 (v/v) for another 20 minutes.
(7) Each well was added 300 μl of blocking solution, 5% bovine serum albumin(BSA), for 1-hour incubation and then washed twice with PBS.
(8) 15 μl of specific primary antibodies were diluted in 1:100 (v/v) with 75 μl of 0.1%
PBST, 300 μl of 5% BSA and 1110 μl PBS. Then 250 μl of the mixture solution was added into each well and stored at 4℃ for incubation overnight.
(9) The next day, cells were then incubated in 300 μl of secondary antibodies (diluted 1:200 in PBS for anti-mouse, anti-rabbit, or anti-goat secondary antibodies) for 1 hour.
(10) Subsequently, 300 μl of DAPI (diluted 1:1000 in PBS) was added and stained for 30 minutes to detect cell nucleus.
(11) Finally, the cover glasses were picked up and glued on slides.
(12) Fluorescence was detected and photographed by the Olympus IX70 Inverted Microscope (Tokyo, Japan).
3.7 Phalloidin staining
(13) The 10 mm circular cover glasses were placed in 24-well plate. Then 1 x 10⁵ cells of apical papilla cells were seeded into the wells of culture plate with DMEM containing 10% fetal bovine serum (FBS), 1% penicillin and 2% glutamine in the condition of 37℃, 5% CO2 and 95% air.
(14) Replaced the medium after incubation for 24 hours. Cells were cultured with fresh medium containing different concentrations of melatonin (10, 50, 100, 250, 500 μg/ml) and DMSO as vehicle control (0.5% final concentration) for another 5 days.
(15) After incubation, removed the medium and washed the cells with PBS three times and fixed with 1 ml of 4% paraformaldehyde per well for 15 minutes.
(16) After fixation, washed with PBS 3 times and removed PBS.
(17) To let the cells be permeable, 1 ml of 2% PBST (2 ml Tween 20 and 98 ml PBS) was added to each well for 15 minutes and then removed.
(18) Each well was added 300 μl of blocking solution, 5% bovine serum albumin(BSA), for 1-hour incubation and then washed twice with PBS.
(19) 20 μl of Rhodamine Phalloidin was mixed with 2 μl of DAPI, 200 μl of 5% BSA and 2 ml PBS. Then 300 μl of the mixture solution was added into each well and incubated in the dark for 30 minutes.
(20) Washed three times with PBS, then the cover glasses were picked up and glued on slides.
(21) Fluorescence was detected and photographed by Olympus IX70 Inverted Microscope (Tokyo, Japan).
3.8 Statistical analysis
Difference between control and experimental groups was analyzed by One-way ANOVA and post hoc Tukey test using the SPSS 12.0 software. The p-value < 0.05 was considered to have a statistically significant difference between groups.
Chapter IV Results
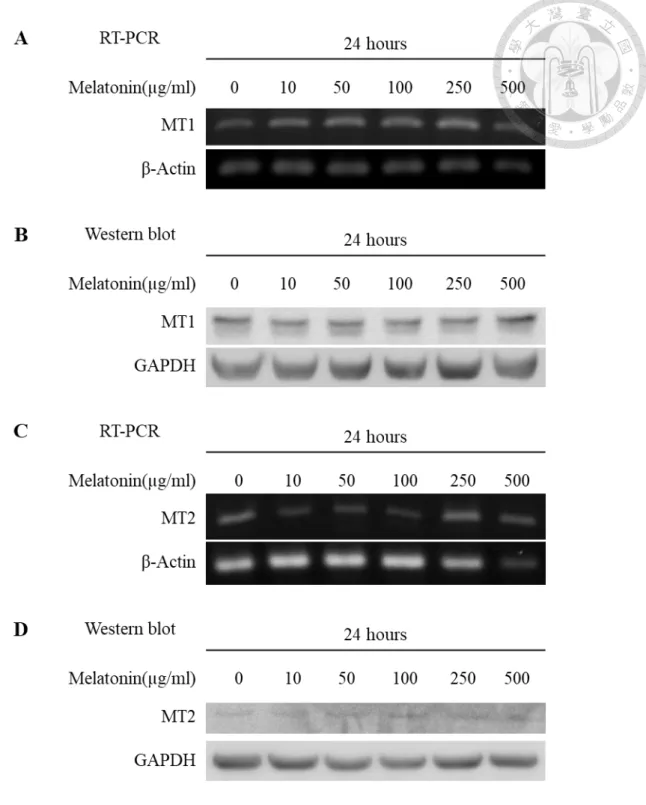
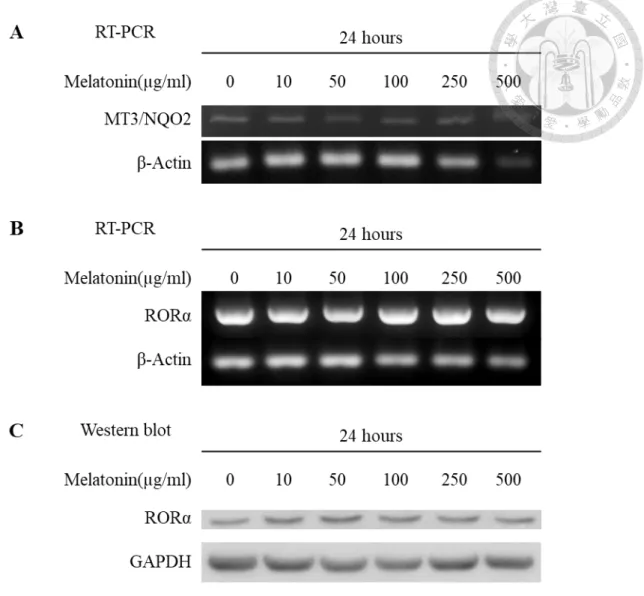
4.1 Expression of melatonin receptors
We examined the gene and protein expression of membrane melatonin receptors MT1 and MT2, cytosolic receptor MT3/NQO2, and nuclear melatonin receptor RORα in apical papilla cells. We also examined the influence of melatonin on the expression of receptors by treating apical papilla cells with different concentrations of melatonin for 24 hours. The RT-PCR and Western blot analysis showed that MT1 and MT2 receptors, as well as MT3/NQO2 and RORα, could be found in apical papilla cells. However, the expression of these melatonin receptors showed no apparent change by melatonin (Fig.
3&4).
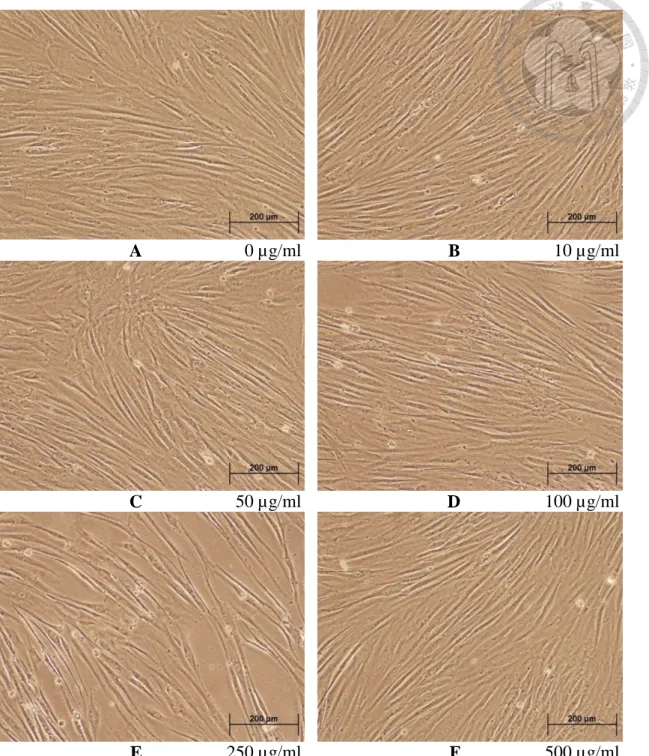
4.2 Cell morphological observation
The apical papilla is a smooth-surface connective tissue attached to the apex of developing root and can be detached by a scalpel. When observed under a phase-contrast microscope, primary cultured apical papilla cells showed spindle shape with extended cellular processes. Similar cell shapes were observed under different concentrations of melatonin (0, 10, 50, 100, 250, 500 μg/ml) for 5 days (Fig. 5).
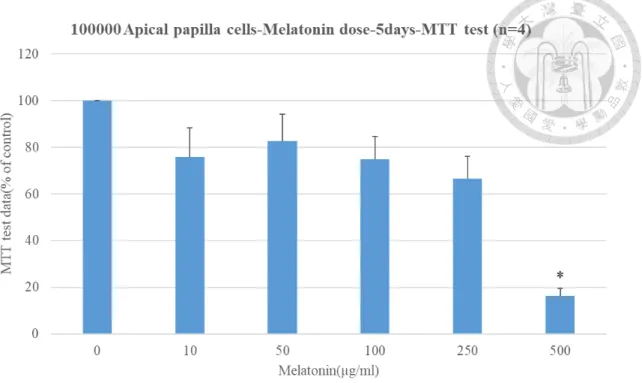
4.3 Effects of melatonin on cell viability of apical papilla cells - MTT assay
In our experiment, MTT assay was performed in apical papilla cells treated with different concentrations of melatonin (0, 10, 50, 100, 250, 500 μg/ml) for 5 days. Cell
number significantly decreased after treatment with 500 µg/ml melatonin for 5 days (Fig.
6).
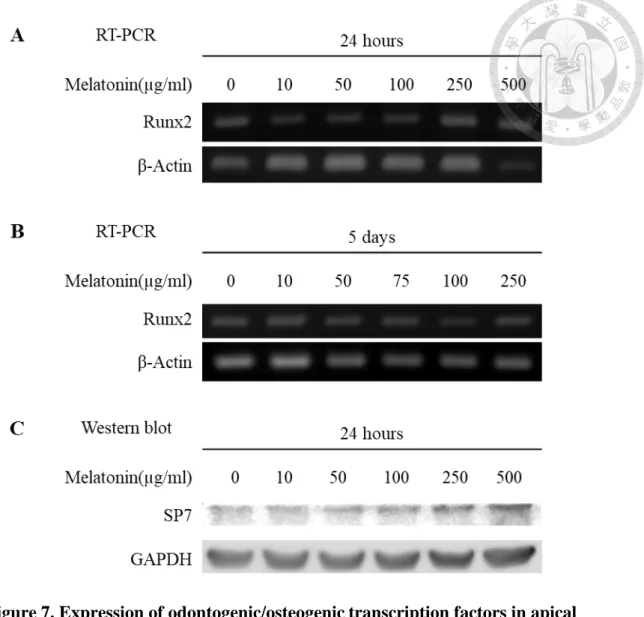
4.4 Effect of melatonin on the expression of transcription factors
We examined the gene or protein expression of Runx2 and Osterix/SP7 in apical papilla cells treated with different concentrations of melatonin for 24 hours or 5 days. RT- PCR analysis showed the expression of Runx2 mRNA increased in the group treated with 500 µg/ml melatonin for 24 hours. However, the enhancement of Runx2 mRNA did not express in other groups treated with lower concentrations of melatonin for 24 hours or 5 days. Western blot analysis showed that expression of Osterix/SP7 slightly increased in a dose-dependent manner (Fig. 7).
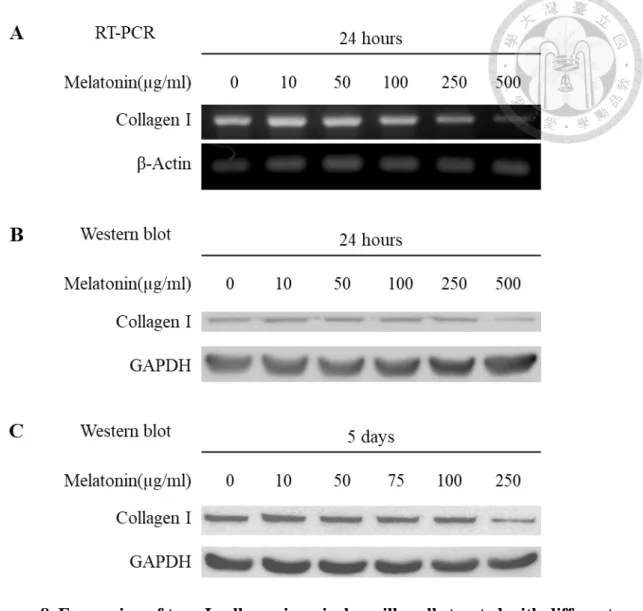
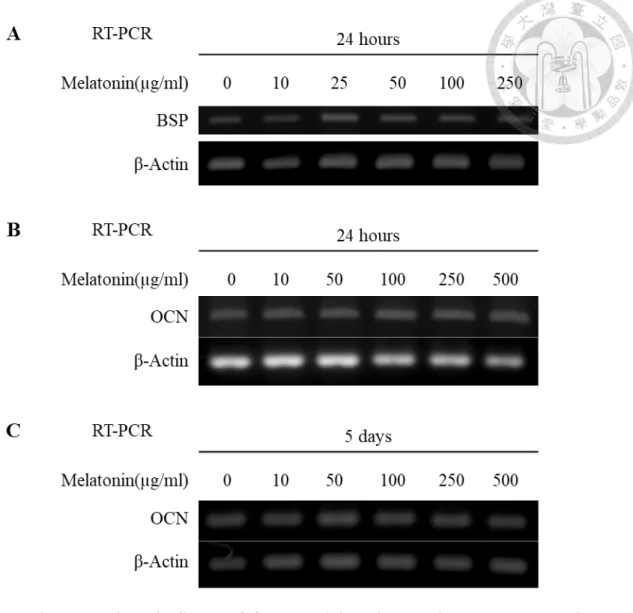
4.5 Effect of melatonin on the expression of odontogenic/osteogenic differentiation markers
We examined the expression of Collagen I, BSP, OCN, ALP and Nestin in apical papilla cells treated with different concentrations of melatonin for 24 hours or 5 days. RT- PCR and Western blot analysis showed the expression of Collagen I decreased in a dose- dependent manner. In the 500 µg/ml melatonin-treated groups, the expression of Collagen I was significantly decreased compared with 0 µg/ml group (Fig. 8). While the expression of BSP, OCN, ALP, and Nestin in apical papilla cells has not be influenced by treatment with melatonin (Fig. 9, 10&11).
4.6 Effect of melatonin on the regulation of cofilin
We examined the gene and protein expression of total cofilin1 and p-cofilin in apical papilla cells treated with different concentrations of melatonin for 24 hours or 5 days. The western blot analysis showed the expression of p-cofilin increased in a dose- dependent manner. But both RT-PCR and western blot analysis showed that expression of total cofilin1 would not change in different concentrations of melatonin groups (Fig.
12&13).
4.7 Effect of melatonin on the expression of N-cadherin
We examined the gene and protein expression of N-cadherin in apical papilla cells treated with different concentrations of melatonin for 24 hours or 5 days. The RT-PCR and western blot analysis showed the expression of N-cadherin increased in a dose- dependent manner in both 24-hour and 5-day groups (Fig. 14).
4.8 Effect of H89 on the melatonin regulation
H89 is known as a PKA inhibitor. We examined the PKA mediated pathway that might be involved in the melatonin regulation by treating the apical papilla cells with/without 10 or 20 µM H89 for 30 minutes then with 250 µg/ml melatonin for 5 days.
The western blot analysis showed that enhancement of N-cadherin and the suppression of Collagen I expression were not influenced, but the expression of p-cofilin was even more increased in the group treated with 10 µM H89 and melatonin (Fig. 15).
4.9 Effect of H7 on the melatonin regulation
H7 is known as a PKC inhibitor. We examined the PKC mediated pathway that might involve in the melatonin regulation by treating the apical papilla cells with/without 10 or 20 µM H7 for 30 minutes, then with 250 µg/ml melatonin for 5 days. The western blot analysis showed the enhancement of N-cadherin expression was not influenced, but the expression of N-cadherin was slightly increased in the group treated with 10 µM H7 alone. Regarding the p-cofilin and cofilin1, the treatment with 10 µM H7 significantly suppressed the stimulatory effect of melatonin on cofilin1 phosphorylation, but the expression of p-cofilin was increased in the group treated with 20 µM H7 alone.
Otherwise, the expression of cofilin1 is slightly decreased by the treatment with H7. But the effect was reversed by melatonin (Fig. 16).
4.10 Effect of melatonin on the actin filament formation
We examined the polymerization of actin filament in apical papilla cells treated with different concentrations of melatonin for 5 days. The phalloidin staining showed the formation of actin filaments increased in a dose-dependent manner (Fig. 17&18).
4.11 Effect of melatonin on the expression of p-CREB
We examined the expression of p-CREB in apical papilla cells treated with different concentrations of melatonin for 5 days. The immunofluorescence staining showed the expression of p-CREB increased in a dose-dependent manner (Fig. 19&20).
Chapter V Discussion
5.1 Tissue distribution of melatonin receptors
Melatonin receptors have been found in many tissues, but the studies published are largely on membrane melatonin receptors, MT1 and MT2. Both MT1 and MT2 receptors are expressed in the SCN, retina, vasculature, immune system, reproductive system, pancreas, skin, gastrointestinal tract, and kidneys, while studies only reported that MT1 receptor had been detected in bone (Slominski et al., 2012). MT1 receptors have been found in osteoblasts, osteoclasts, osteosarcoma cells and also bone marrow stromal cells (Suzuki, Somei, Kitamura, Reiter, & Hattori, 2008; Toma et al., 2007). In dental tissues, the MT1 receptor has been detected in fibroblasts of the oral mucosa (Cutando et al., 2011). Kumasaka et al. reported that MT1 receptors had been detected by immunohistochemical analysis in secretory ameloblasts, odontoblasts and the cells of stratum intermedium, stellate reticulum, outer enamel epithelium in the tooth germs of human mandibular third molars. In addition, RT-PCR and Western blot analysis also revealed that HAT-7, a rat dental epithelial cell line, expressed MT1 receptors (Kumasaka et al., 2010).
In contrast to the MT1 and MT2 receptors, MT3 is a low-affinity melatonin binding site and has been characterized as the cytosolic enzyme, NQO2. It is expressed in the brain, liver, kidney, heart, lung, adipose tissue, and eye (Nosjean et al., 2000; Pintor, Peláez, Hoyle, & Peral, 2003). As for the nuclear receptors of melatonin, they belong to the ROR/RZR family. RORβ is a brain and retina-specific receptor, while RORα is also expressed in many tissues including liver, heart, and skin (Pozo, García‐Mauriño,
Guerrero, & Calvo, 2004; Smirnov, 2001). However, these receptors have not yet been detected in dental tissue.
Our study first demonstrated that apical papilla cells expressed melatonin receptors, MT1, MT2, MT3/NQO2, and RORα. Previous research has shown that both 1 mM and 2.5 mM melatonin enhanced the protein expression of MT1, MT3, and RORα in HepG2 human hepatocarcinoma cells (Carbajo-Pescador et al., 2009). However, the expression of these melatonin receptors showed no obvious change by melatonin treatment in our study.
5.2 Effect of melatonin in odontogenesis and osteogenesis
Stimulatory effects of melatonin on bone formation and its inhibitory effects on bone resorption have been reported in many studies (Maria & Witt-Enderby, 2014). It has been suggested that the osteoblast-enhancing function of melatonin is mediated by its direct action on the differentiation and proliferation of the bone-forming cells.
Nakade et al. demonstrated the effect of melatonin on osteogenic actin in normal human bone cells (HOB-M cells) and human osteoblastic cell line (SV-HFO). Melatonin dose-dependently increased the proliferation of HOB-M cells and SV-HFO with a maximal effect at a concentration of 50 µM after 24-hour incubation. The effect on bone cell differentiation was evaluated after 48-hour melatonin treatment. While the result showed that melatonin did not affect either the ALP activity or the OCN secretion, it significantly increased the type I collagen synthesis at concentrations between 50 and 100 µM in human bone cells (Nakade, Koyama, Ariji, Yajima, & Kaku, 1999). Radio et al.
reported that melatonin promoted the differentiation of human adult mesenchymal stem cells (hAMSCs) into osteogenic lineages. Melatonin at a physiological concentration (50
nM) in combination with an osteogenic medium following a 10-day incubation, significantly increased ALP activity relative to osteogenic medium alone (Radio, Doctor,
& Witt-Enderby, 2006).
Satomura et al. performed a study to evaluate the effect of melatonin on the proliferation and differentiation of primary cultured human osteoblasts and also measured newly bone formation after intraperitoneal administration of melatonin to mice. RT-PCR and Western blot analysis showed that human osteoblasts expressed MT1 receptor. Later than 5-days incubation, melatonin at pharmacological concentrations (100 µM or over) stimulated the proliferation, ALP activity, mineralized matrix formation and promoted the gene expression of type I collagen, osteopontin, BSP, and OCN. Moreover, the volume of the newly formed cortical bone of femur increased after the mice were treated with for 21 days (Satomura et al., 2007).
In addition, Park et al. demonstrated that melatonin promoted differentiation and migration in MC3T3-E1 cells (mouse osteoblastic cells) at physiological concentrations (25, 50, 75, 100 nM). After melatonin treatment for 2 and 3 days, the expression of osteogenic markers such as OCN, BMP-2 and -4 increased in a dose-dependent manner.
Melatonin treatment also activated Runx2 expression following a short period incubation (2- and 3-hour) (Park et al., 2011). Han et al. found that melatonin (1µM) promoted osteoblast differentiation of C2C12 cells (mouse pre-myoblast cells) (Han, Kim, Kim, &
Lee, 2017). After C2C12 cells cultured in BMP-4 osteogenic induction medium and treated with melatonin for 3 days, the expression of osteogenic markers, Runx2, ALP, BSP, OCN and Osterix significantly increased relative to BMP-4 osteogenic medium alone. The enhancement was especially on Osterix, which is an essential transcription factor in the late stage of osteogenesis for the differentiation of preosteoblasts into mature
osteoblasts. Furthermore, treatment with PKA inhibitor H89 and PKC inhibitor Go6976 blocked the melatonin-induced transcriptional activity of Osterix, indicating that melatonin regulated Osterix expression via the PKA and PKC signaling pathways.
Another study has also been reported that physiological concentrations of melatonin (nanomolar range) induced mRNA expression of nestin in the C17.2 neural stem cell line.
However, nestin was thought to be a neural stem cell marker in this study.
In our examination, we did not find the similar result that melatonin has the stimulatory effect on the expression of odontogenic/osteogenic differentiation markers BSP, OCN, ALP and Nestin in apical papilla cells. As for collagen, our results demonstrated that collagen I expression would be inhibited by high-dose melatonin.
However, we found the mRNA expression of Runx2 and the protein level SP7 expression were in a trend to increase in a melatonin dose-dependent manner. These different results between transcription factors and differentiation markers might be the regulation involved in different stages of cell differentiation. While the treatment periods, 24-hour and 5-day, in our experiment did not short or long enough distinguish the difference. In addition, the melatonin concentrations in our study are different from previous studies which used the physiological concentrations or less than 1µM melatonin. Our results of MTT assays showed the significant suppression of cell number in 500 µg/ml melatonin-treated groups.
This higher dose of melatonin might also be a reason to explain that our results were different to which in previous studies.
5.3 Effect of melatonin on actin filaments
Reorganization of actin filaments plays a central role in cell migration. To migration, normally a cell must become polarized and continuously protrude a