國立臺灣大學公共衛生學院
流行病學與預防醫學研究所 生物醫學統計組 碩士論文
Division of Biostatistics
Graduate Institute of Epidemiology and Preventive Medicine College of Public Health
National Taiwan University Master Thesis
評估大腸鏡轉介對於大腸直腸癌效益之統計方法 Statistical methods to evaluate the efficacy of referral
colonoscopy on colorectal cancer
陳冠至 Kuan-Chih Chen 指導教授:陳秀熙 博士 Supervisor: Hsiu-Hsi Chen, Ph.D.
中華民國 108 年 7 月
July 2019
誌謝
首先我要感謝 陳秀熙教授的指導,老師不僅傳達了知識更是傳達了許多人 生哲理,對於我在往後學術研究上或是生活上都有重要的啟發。於課堂上,老師即 時的補充更有如醍醐灌頂,常使我們茅塞頓開。老師也總是不厭其煩地在不同場合 再次提醒我們許多知識之間的關聯性,於是乎「整套」的觀念便慢慢地形成在我們 的腦海裡。另外,也感謝老師煞費苦心將許多課程錄製成線上課程,讓教學變得更 為彈性及增加可近性;雖然,似乎還是有許多觀念不清楚的地方,然而,藉著線上 課程便可以不斷溫習線上課程的教材來自主學習。
此外,我也要特別感謝 許辰陽老師的指導, 王威淳博士及 任小萱博士的 協助,還有整個 陳教授團隊的幫忙,才使得此論文得以完成。感謝 邱瀚模教授及 李宜家教授在論文口試時給予我的寶貴意見。感謝同學間的彼此扶持,一起渡過撰 寫論文的艱困時期。
最後,我要感謝家人的支持,使我在念書時無後顧之憂,陪我一同渡過這有 歡笑亦有淚水的時光。
但願畢業不是結束,而是研究之路的開始,學海無涯,我願意更加虛心受 教,謹記這兩年所學,發揮研究精神,以期造福人群,並回饋社會。
中文摘要 背景
雖然許多研究已經證實大腸鏡檢查能有效降低大腸直腸癌的死亡及晚期癌的發 生,但此效益僅能及於糞便潛血檢查陽性個案中後續接受大腸鏡確診者。先前的研 究已顯示糞便潛血濃度(fecal hemoglobin concentration)為大腸直腸癌之替代指標,
因此陽性個案若未接受轉介將會造成大腸直腸癌死亡或進展為晚期癌之風險,而這 些危害,若個案能接受大腸鏡轉介卻可達到有效預防之效益。雖然不轉介之個案對 於大腸鏡效益具有重要的影響,但此一情境在倫理考量以及實際執行上並不適合運 用傳統的隨機分派試驗進行評估。因此必須透過一系列的包含傾向分數方法
(propensity score-based approach)及閥值(hurdle-based approach)模型之統計方 法來評估未接受轉介的行為對於大腸直腸癌死亡及晚期癌發生的影響。此外,不治 療意向分析(intention-to-untreat)亦需要用來調整自我選擇偏差並量化未轉介之有 害的影響,而遵從性調整(compliance adjustment)則用來評估當所有陽性個案皆 接受大腸鏡確診時,其所增加的效益。
目的
本研究欲發展一系列的統計方法,來評估在糞便潛血檢查篩檢計畫下,轉介 所帶來的影響。
材料與方法 資料來源
基隆社區整合式篩檢計畫
基隆社區整合式篩檢資料從 1999 年至 2010 年,共計有 2591 為陽性個案,
並追蹤至 2016 年底。本研究利用傾向分數調整分析及傾向分數配對分析探討接受 大腸鏡轉介與否其後續死於大腸癌或發生晚期癌之風險。
台灣全國組織性大腸癌篩檢計畫
台灣於 2004 年起開始提供兩年一次糞便潛血檢查之全國組織性大腸癌篩 檢,目標族群為 50 歲至 69 歲之民眾,並在 2013 年上修至 74 歲。篩檢結果為陽性
有 49830 位陽性個案,本研究追蹤此族群至 2014 年底,收集研究個案之大腸癌的 發生及死亡。
統計方法
本研究運用傾向分數調整分析及傾向分數配對分析以評估大腸鏡確診對於後 續大腸直腸癌死亡或晚期癌發生的影響。本研究並運用閥值卜瓦松模型(Hurdle Poisson model)及閥值寇斯多相模型(Hurdle Coxian phase-type model)以釐清未轉 介之傾向及等待大腸鏡確診時間之過程的對於大腸鏡效益之影響。前述運用於評估 轉介對於大腸鏡影響之效益統計方法並與不治療意向分析之結果進行比較。利用遵 從性調整分法可評估當轉介率為 100%的情境時,大腸鏡確診的效益為何。
結果
利用傾向分數配對分析於基隆資料之結果顯示,未接受轉介對於大腸直腸癌 死亡的風險增加 108%,而晚期癌則為 61%,此結果相較傳統的寇斯回歸模型來得 高。
利用閥值寇斯多相模型並結合傾向分數配對分析於台灣全國資料之結果顯 示,未接受轉介對於大腸直腸癌死亡的風險增加 52%,而晚期癌則為 28%。而等待 時間較長的人,其後續發生晚期癌的風險達統計顯著,但對於大腸直腸癌死亡並無 顯著差異。與傳統的寇斯回歸模型相比,將等待時間納入模型中考量,此變項可多 解釋 7%的死亡風險。
不治療意向分析結果顯示,未接受大腸鏡轉介對於大腸直腸癌死亡的風險增 加 66%。若所有陽性個案皆接受大腸鏡確診,大腸鏡檢查將可降低 48%的死亡風 險。
結論
本研究發展了一系列的統計方法來評估未接受確診對於後續大腸直腸癌死亡 及晚期癌發生的影響,更評估當轉介率為 100%的情形下,大腸鏡確診在台灣全國 大腸癌篩檢之效益。
關鍵字: 大腸直腸癌、大腸鏡、傾向分數分析、閥值卜瓦松模型、閥值寇斯多相模 型、不治療意向分析、遵從性調整
Abstract
Background Although there is a body of the evidence supporting the efficacy of colonoscopy in reducing advanced-stage colorectal cancer (CRC) and its death, the benefit of FIT-based screening programme followed by colonoscopic confirmation for FIT-positive subject can only be attained for those who comply with referral. As the Faecal haemoglobin concentration (FHbC) is the surrogate for colorectal neoplasm, the non-referral behavior among FIT-positive subjects thus results in the harmful effect of CRC death and the progression of colorectal neoplasm to advanced stage that can be averted through the referral on colonoscopy. Assessing the impact of referral on colonoscopy based on the conventional randomized controlled design is obviously
infeasible and unethical. A series of statistical methods are required to evaluate the impact of non-referral on the advanced-stage CRC and its death, including propensity score- based approach and the Hurdle-based approach. The intention-to-untreat method is also required to quantify the detrimental effect of non-referral on colonoscopy making
allowance for self-selection referral. The compliance adjustment is also required to assess the additional benefit when noncompliance is improved with full compliance.
Aims We aimed to develop a series of statistic methods to quantify the impact of referral on colonoscopy under the context of FIT-based service screening programme.
Material and methods Data Sources
Data on Keelung Community-based Integrated Screening Programme
Data on Keelung Community-based integrated Screening programme (KCIS) spanned from 1999 to 2010 was used to explore the impact of referral on colonoscopy
using CRC mortality and the risk of advanced CRC among the FIT-positive subjects (n=2,591) by using the propensity score adjustment and propensity score matching analysis. This cohort was followed till the occurrence of CRC with the stage information collected and also the occurrence of CRC death till the end of 2016.
Data on Taiwanese nationwide population-based colorectal cancer screening Programme
The Taiwanese organized service CRC screening program was launched in 2004 by using FIT at biennial basis. The target population was those aged between 50 and 69 years and later extended to 74 years in 2013. Screening attendants with positive FIT were referred to receive confirmatory examination using colonooscopy as a major tool. A total of 49,830 subjects with positive FIT during the period of 2004-2009 were enrolled. This cohort was followed to identify the occurrence of CRC and the stage information and CRC death by comparing the national cancer registry and national death registry till the end of 2014.
Statistical Methods The propensity score approach including the adjustment and matching was applied to quantify to impact of referral on colonoscopy in terms of CRC mortality and the risk of advanced CRC. To elucidate the mechanism of non-referral including the propensity of being non-complaint and the waiting process including the waiting time and the tendency of being long-waiting for colonoscopy, the Hurdle Poisson and Hurdle Coxian phase-type model, respectively were applied. The estimated results based a series of statistical methods were compared with that derived from the principle of intention-to-untreat analysis. By using the non-compliance adjustment approach, the efficacy of colonoscopy under the scenario of 100% compliance was the assessed.
Results The detrimental effect of non-referral results in the increase in the risk of CRC mortality and advanced CRC by 108% (95% CI: 32-223%) and 61%(95 % CI: 8-144%), respectively, by using the propensity score matching approach based on the data on KCIS cohort. The magnitude regarding the impact of non-referral derived by using the
conventional method was lower compared with that derived by using the propensity score matching approach.
Regarding the impact of non-referral at the nationwide scale, those who were non- referral were at increased risk for CRC mortality by 61%. The impact of non-referral behavior results in the increase in the risk of CRC mortality and advanced CRC by 52%
(95% CI: 16-96%) and 28% (95% CI: 9-49%) by using the Hurdle Coxian-phase type in conjunction with the propensity score matching analysis. While the tendency of being the type of long-waiting showed a significant impact on the risk of advanced CRC (aHR:
4.02, 95% CI: 1.71-9.46), the detrimental impact for CRC mortality was not statistically significant (aHR: 1.74, 95% CI: 0.24-12.65). Compared with conventional Cox
regression model, the consideration of transition from low to long waiting time waiting explained the additional 7% of risk of CRC mortality.
The intention-to-untreat estimate gave the results on the impact of non-referral for colonoscopy in the increase of CRC mortality risk by 66% (95% CI: 46-87%). Given the scenario that all FIT-positive subjects compliant with referral, the efficacy of colonoscopy will reduce the risk of CRC mortality by 48% (95% CI: 39-56%), indicating 13% extra benefit given full compliance.
Conclusions We developed a series of statistical methods to assess the impact of non- referral on CRC mortality and advanced CRC and further evaluated the efficacy of
colonoscopy with 100% compliance under the context of Taiwan nationwide colorectal cancer screening programme.
Key words: Colorectal cancer、Colonoscopy、Propensity score analysis、Hurdle Poisson model、Hurdle Coxian phase-type model、Intention-to-untreat estimate、
Compliance adjustment
Contents
Chapter 1 Introduction ... 1
Chapter 2 Literature review ... 2
2.1 Strategies for colorectal cancer prevention ... 2
2.1.1 Screening modalities ... 2
2.1.2 Factors associated with efficacy ... 6
2.2 Barriers on receiving confirmatory colonoscopy for FIT-based screening programme ... 6
2.3 Methods for the evaluation of intervention efficacy based on observational study ... 8
2.3.1 Propensity score analysis ... 8
2.3.2 Correct non-compliance bias in case-control studies by employing external data from previously published RCT of screening ... 10
2.3.3 Bayesian model for self-selection adjustment ... 11
2.3.4 Further application of propensity score analysis for self-selection adjustment ... 11
2.3.5 The relative risk adjusted for the self-selection bias ... 12
Chapter 3 Material and Methods ... 13
3.1 Keelung Community-based Integrated Screening Programme ... 13
3.2 Statistical methods for the impact of non-referral on colonoscopy ... 15
3.3.1 Propensity score analysis ... 16
3.3.2 Propensity score analysis with two-stage process of referral ... 16
3.3.3 Impact of referral to colonoscopy evaluated by intention-to-untreat and non-compliance adjustment ... 20
Chapter 4 Results ... 24
4.1 Results on the analysis for the impact of referral for colonoscopy based on KCIS cohort ... 24
4.1.1 Demographic characteristics ... 24
4.1.2 Estimated results of crude and adjusted hazard ratios for CRC death and advanced stage of CRC ... 25
4.1.3 Estimated results on the effect of factors associated with referral rate .... 26
4.1.4 Propensity score analysis for the impact of referral on colonoscopy ... 27
4.2 Results on the analysis for the impact of referral for colonoscopy based on Taiwan nationwide colorectal cancer screening programme ... 28
4.2.1 Demographic characteristics of FIT positive subjects ... 28
4.2.2 Estimated results by using Cox regression model ... 29
4.2.3 Results on two-stage referral process ... 29
4.3 Analysis of Intent-to-untreat and Noncompliance Adjustment ... 33
Chapter 5 Discussion ... 36
5.1 The impact of referral on colonoscopy ... 36
5.2 Elucidation the process of non-referral and the impact of referral on colonoscopy ... 37
5.4 Limitation ... 40
5.5 Conclusions ... 41
List of Tables ... 42
Table 2.1 The main randomized control trials of guaiac fecal occult blood test ... 42
Table 2.2 Summary of effect of fecal immunochemical test versus guaiac fecal occult blood test and flexible sigmoidoscopy ... 43
Table 3.1 Information on the derivation of CRC mortality for FIT-positive subject under untreated scenario ... 45
Table 4.1.1 Colorectal cancer mortality rate by characteristics of subjects with positive fecal immunochemical test, the KCIS cohort ... 46
Table 4.1.2 Advanced stage of colorectal cancer incidence rate by characteristics of subjects with positive fecal immunochemical test, the KCIS cohort ... 47
Table 4.1.3 Characteristics of referral and non-referral subjects and referral rate, the KCIS cohort ... 48
Table 4.1.4 Estimated results of crude and adjusted hazard ratio for colorectal cancer death, the KCIS cohort ... 50
Table 4.1.5 Estimated results of crude and adjusted hazard ratio for advanced stage of colorectal cancer, the KCIS cohort ... 51
Table 4.1.6 The effect of factors on referral rate, the KCIS cohort ... 52
Table 4.1.7 The estimated efficacy of colonoscopy on colorectal cancer mortality and advanced colorectal cancer incidence by adjusting with propensity score, the KCIS cohort ... 54
Table 4.1.8 Characteristics of referral and non-referral subjects in data matched by propensity score, the KCIS cohort ... 55
Table 4.1.9 Estimated results of the effect of referral on colorectal cancer mortality by using matched data set, the KCIS cohort ... 57
Table 4.1.10 Estimated results of the effect of referral on advanced colorectal cancer by using matched data set, the KCIS cohort ... 58
Table 4.2.1 Numbers of colorectal cancer deaths and advanced cancer by characteristics of study subjects with positive FIT, Taiwanese nationwide CRC screening program* ... 59
Table 4.2.2 Referral rate and median waiting time for confirmatory exam among subjects with positive FIT, Taiwanese nationwide CRC screening program ... 60
Table 4.2.3 Estimated results on the risk of colorectal cancer mortality by using Cox regression model, Taiwanese nationwide CRC screening program ... 61
Table 4.2.4 Estimated results on the risk of advanced colorectal cancer by using Cox regression model, Taiwanese nationwide CRC screening program ... 63
Table 4.2.5 Estimated results on the risk scores for noncompliance and waiting time by characteristics of study population based on Hurdle Poisson regression model, Taiwanese nationwide CRC screening program ... 65
Table 4.2.6 Propensity score adjusted analysis on risk of colorectal cancer mortality by three kinds of model, Taiwanese nationwide CRC screening program ... 66
Table 4.2.7 Propensity score adjusted analysis on risk of advanced colorectal cancer by three kinds of model, Taiwanese nationwide CRC screening program ... 68 Table 4.2.8 Propensity score matching analysis on risk of colorectal cancer mortality
by three kinds of model, Taiwanese nationwide CRC screening program ... 70 Table 4.2.9 Propensity score matching analysis on risk of advanced colorectal cancer by three kinds of model. ... 72 Table 4.3.1 Number of CRC death and CRC mortality by areas and adenoma
detection rates (ADR) among compliers with colonoscopy exam ... 74 Table 4.3.2 Estimated results on the risk of colorectal cancer mortality by using Cox regression model ... 75 Table 4.3.3 Estimated results of risk of CRC death with intention-to-untreat
adjustment ... 76 Table 4.3.4 Estimated results of risk of CRC death with adjustment for non-
compliance ... 77 Table 5.1 Summary on the estimated results on the impact of referral on
colonoscopy based in KCIS data ... 78 Table 5.2 Summary on the estimated results on the impact of referral on
colonoscopy based in Taiwanese nationwide colorectal cancer screening data ... 79 List of Figures ... 80 Figure 4.1.1 Cumulative colorectal cancer mortality by referral status ... 80 Figure 4.1.2 Cumulative incidence rate of advanced stage of colorectal cancer
mortality by referral status ... 81 References ... 82
Chapter 1 Introduction
As a major strategy in preventing Colorectal cancer (CRC), the third most common malignancy and the fourth leading cause of cancer death world-wide, population-based screening programme have demonstrated its efficacy through the scientific methodology of randomized controlled trials. With the support from the ground of evidence medicine, the provision of CRC screening in the form of service screening programmes have been implemented in several of developed and developing countries.
However, the purpose of the evaluation of efficacy in the era of service screening for CRC is often hampered by the issue of compliance. For subjects with positive screening results, he/she may choose not to follow the referral provided by screening programme, which not only dilutes the efficacy of screening programme but also makes the
comparison between complier and non-complier not feasible for the purpose of evaluation. Furthermore, the rationale of the necessity for referral given a positive screening result also render the RCT design neither feasible nor ethical.
In this study, we aimed to develop statistic methods for evaluation of colonoscopy efficacy among fecal immunochemical test (FIT)-positive patients based on the compliance to referral under the context of CRC screening.
Chapter 2 Literature review
2.1 Strategies for colorectal cancer prevention
The disease burden of CRC is still high. CRC is the third most commonly diagnosed malignancy and the fourth leading cause of cancer death in the world. CRC accounts almost 10% of the global cancer incidence burden in 2012 (Bosman FT, 2014).
The global burden of CRC is expected to increase by 60% to more than 2.2 million new cases and 1.1 million deaths by 2030 (Arnold M, 2017).
Because of high disease burden of CRC, mass screening for early detection has been launched in many countries. Many approaches including opportunistic,
programming, sequential, and risk-stratified methods for mass CRC screening are provided to detect early-stage CRCs and precancerous lesions in asymptomatic people with average risk (Levin TR, 2011; Morbidity and mortality weekly report, 2012; Ma GK, 2014). There are many ways for mass screening for population with average risk of CRC. According to U.S. Multi-Society Task Force, there are three tiers for CRC
screening (Rex DK, 2017). The tiers 1 which includes colonoscopy every 10 years and annual fecal immunochemical test (FIT) is the cornerstone of CRC screening. The tier 2 includes CT colonography every 5 years, FIT–fecal DNA every 3 years, and flexible sigmoidoscopy every 10 years (or every 5 years). The tier 3 includes capsule colonoscopy every 5 years.
2.1.1 Screening modalities Guaiac fecal occult blood test
Guaiac fecal occult blood test (gFOBT) for CRC screening was first proposed by
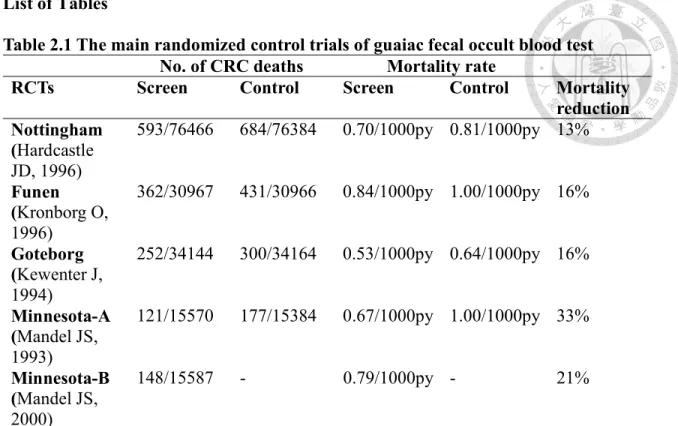
Greegor (Simon JB, 1985). The principle of gFOBT is based on the fact that peroxidase enzyme can make a chromogen such as guaiac oxidation by receiving an oxygen from hemoglobin. One review article using combined results from the 4 eligible randomized controlled trials (RCTs) shows a statistically significant 16% reduction in the relative risk of CRC mortality (RR 0.84; CI: 0.78-0.90) in the subjects allocated to gFOBT screening (Table 2.1) (Hol L, 2010; Kewenter J, 1994; Mandel JS, 1993; Hardcastle JD, 1996;
Hewitson P, 2007).
Fecal immunochemical test
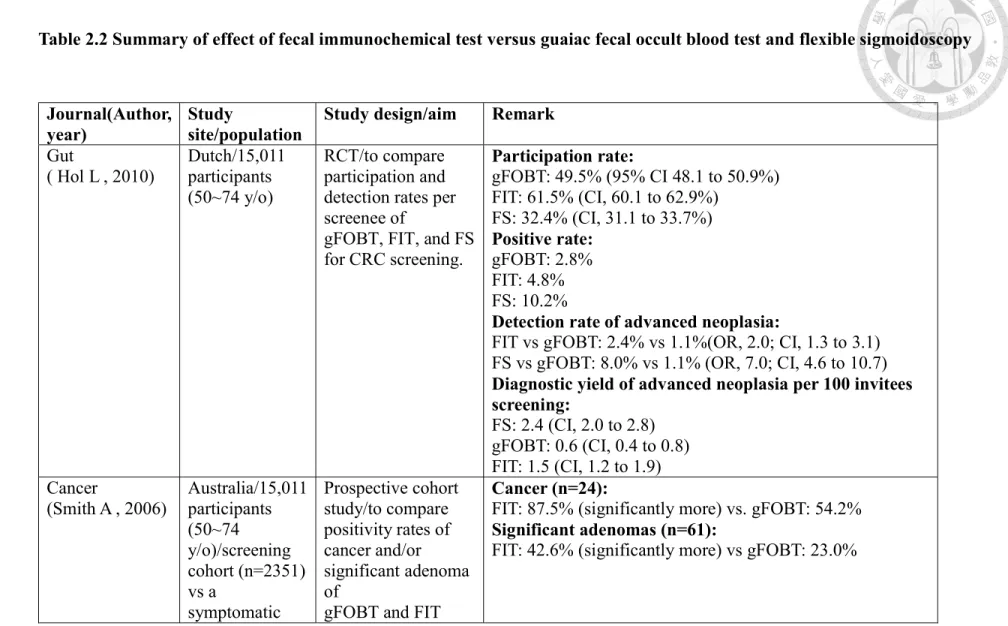
There were many literatures revealed that FIT is superior to gFOBT because it demonstrated more sensitive for detection of cancers and advanced adenoma, and FIT also had higher participation rate because no limitation of dietary restriction and easy to operate (Table 2.2) (Hol L, 2010; Smith A, 2006; Park DI, 2010). Park et al. demonstrated that FIT provides a higher sensitivity for detecting advanced colorectal neoplasia than gFOBT with acceptable specificity (Park DI, 2010). One meta-analysis revealed that the pooled sensitivity and specificity of FITs for CRC were approximately 79% and 94%, respectively, with overall accuracy up to 95% (Lee JK, 2014). Besides, FIT with quantitative property could be used to identify high risk patient for tailoring CRC screening strategy.
Fecal hemoglobin concentration (FHbC) using different cutoff value could provide risk stratification in many aspects. A prospective cohort study revealed that the incidence of colorectal neoplasia increased from 1·74 per 1000 person-years for those with baseline FHbC 1–19 ng/mL, to 7·08 per 1000 person-years for those with a baseline
concentration of 80–99 ng/mL. The adjusted hazard ratio (aHR) increased from 1.43 (95% CI 1.08-1.88) for baseline FHbC of 20-39 ng/mL, to 3.41 (2.02–-5.75) for a baseline concentration of 80-99 ng/mL (trend test p<0.0001), relative to 1-19 ng/mL (Chen L-S, 2012). And the impact of dose-dependent fashion was also seen in CRC mortality and all-cause death. The effect of an incremental increase in FHbC on the risk for CRC mortality was noted, increasing from a slightly increased risk for the category of FHbC of 20-49 ng Hb/mL (aHR=1.09; 95% CI 0.68 to 1.75) to 11.67 (95% CI 7.71 to 17.66) for the group with FHbC≥450 ng Hb/mL as compared with the group considered baseline with FHbC of 1–19 ng Hb/mL (p<0.001) (Chen LS, 2013). A similar but less marked increasing trend was found for all-cause mortality, with aHR increasing from 1.15 (95% CI 1.07 to 1.24) for the group with FHbC of 20–49 ng Hb/mL to 1.67 (95% CI 1.54 to 2.07) for the group with FHbC ≥450 ng Hb/mL (Chen LS, 2013). The result demonstrated that FHbC could provide not only information of individually tailored screening for CRC but also a significant predictor for life expectancy.
FIT is feasible for population-based screening with robust evidence. Taiwanese government offered biennial FIT to the general population between the ages of 50 and 69 years for nationwide CRC screening service program since 2004 (Yang KC, 2006; Chen TH, 2004). The overall FIT positive rate was 4%. The positive predictive value of FIT was 39.5% for adenoma, 11.7% for advanced adenoma, and 6.1% for invasive cancers (Chiu HM, 2015). The effect of biennial FIT screening for reducing CRC mortality in Taiwan was first studied by Chiu et al (Chiu HM, 2015). This is a prospective cohort study of the follow-up of approximately 5 million Taiwanese from 2004 to 2009 in comparison of CRC mortality between screened group and unscreened group. The
screening program was linked to the National Death Registry of Taiwan and the Taiwan Cancer Registry, from which the causes of death could be obtained. It showed a
significant 10% mortality reduction from CRC attributable to the 21.4% coverage of the FIT screening after adjusted for the self-selection bias and increasing incidence of CRC (Duffy SW CJ, 2002; Tabar L, 2003; Wu JC, 2010). Lee et al also demonstrated that FIT- based screening made a greater contribution than universal health insurance over CRC mortality reduction by using age-period-cohort analysis (Lee YC, 2018).
Because FIT has characteristics of easy use (just needs one sample) and high sensitivity with acceptable specificity for early CRC detection, it was widely used for population-based screening in the world currently (Park DI, 2010; Lee JK, 2014; Allison JE, 2014).
Colonoscopy
FIT-positive patients were referred for further confirmatory exam which was mainly colonoscopy. One RCT study for comparing colonoscopy with FIT in CRC screening revealed that subjects in the FIT group were more likely to participate in screening than were those in the colonoscopy group. On the baseline screening
examination, the numbers of subjects in whom CRC was detected were similar in the two study groups, but more adenomas were identified in the colonoscopy group (Quintero E, 2012). In the Unites States, sequential approach with single step colonoscopy screening strategy was adopted, because they proposed that FIT has little impact on CRC incidence (Rex DK, 2017).
For evaluating the efficacy of colonoscopy in reducing CRC, it is crucial to know
the natural history of CRC. After knowing the natural history of CRC, the efficacy on CRC reduction can be studied in the people with positive FIT who receive subsequent colonoscopy. The natural history of CRC composed of two theories: adenoma-carcinoma sequence and de novo carcinoma theory. A case-cohort study using five-state model revealed that dwelling times of small (0.6–1 cm) and large adenoma (> 1 cm) are 7.75 and 5.27 years for the model without considering de novo, and 17.48 and 15.90 years for the model taking de novo carcinoma into account. The overall efficacy of colonoscopy in reducing CRC was 73% for the model allowing for de novo carcinoma and 88% for the model without considering de novo carcinoma theory (Chen CD, 2003).
2.1.2 Factors associated with efficacy
As previously mentioned, there were several approaches for CRC screening (Rex DK, 2017), and Taiwanese government has adopted programmatic screening with FIT since 2004 for eligible population, and it already showed the effectiveness on CRC mortality reduction (Chiu HM, 2015). However, to maximize CRC screening efficacy, it depends mainly on coverage rate, attending rate, and compliance rate to subsequent confirmatory colonoscopy for those screenees with positive FIT. Besides, the quality control of colonoscopy with indicators such as bowel preparation quality, cecal intubation rate, adenoma detection rate and complication rate is as important as well (Rex DK, 2015).
2.2 Barriers on receiving confirmatory colonoscopy for FIT-based screening
programme
Although subsequent colonoscopy is crucial for positive FIT patients, about 10%
to 20% of people with positive FIT declined further colonoscopy, this made the effectiveness of CRC screening compromised (Chiu HM, 2015; Zorzi M, 2015; van Rossum LG, 2008).
Different races have different adherence rate to CRC screening. Lations and Asians (mainly Chinese) were found of completing screening more often than African Americans. Besides, FIT was adhered more often by non-white participant, and
meanwhile colonoscopy was adhered more by white participants (Inadomi JM, 2012).
Adherence to CRC screening/surveillance was also affected by perception of various levels of risks according to family history of CRC. Those with higher familiar risk had higher adherence rate to current colonoscopic guidelines, and this study also shed the light of delivery of individualized risk-based screening recommendations according to both personal and family risk factors (Taylor DP, 2011). Identified factors with poorer adherence rate to screening colonoscopy were female sex, younger age, and insurance type (Rex DK, 2017; Thomas D Denberg, 2005). Fear about CRC screening related pain was found as the strongest barrier in previous study. However, it can be improved by better communication with patients. One study in New York City had also shown that increasing referral rate for screening colonoscopy can be achieved by patient education and activation at a primary care clinic (Sriphanlop P, 2016). The coordinated efforts by central government, local health departments and community had shown increased CRC screening test rates by Morbidity and Mortality Weekly Report from American Centers for Disease Control and Prevention (Morbidity and mortality weekly report, 2008).
2.3 Methods for the evaluation of intervention efficacy based on observational study The bias of population-based screen will come from the eligible screening
population who choose not to attend. They will have different incidence and survival rates of the disease in question from those of the general population (Tabar L, 1992).
Thus, there were some methods proposed to correct the such kind of known bias.
2.3.1 Propensity score analysis
Because the effect of CRC mortality rate decreased by population based FIT screening is not easily to be evaluated via randomized control study, observation study after adjustment is an alternative method. However, a randomized control study is conducted through an important step, i.e. randomization mechanism to reach the comparability which is lacking in observation study. Because of lacking randomization allocation, confounding factors are inevitable in observation study. Propensity score analysis is one of the methods to solve the problem of imbalance of covariates across difference groups. Besides, because of elimination of bias by propensity score analysis, casual effects can be derived further (Qin R, 2008).
In our scenario of this study, our intervention (X) is either compliance or noncompliance to colonoscopy after positive FIT, and our outcome variable (Y) is mortality rate of CRC. As we just mentioned, confounding factors are inevitable in observation study design due to lack of randomization mechanism, so the effect of X on Y is needed to be adjusted by confounding factors (Z). The confounding factors including patient characteristics, clinical conditions, context of care, and treatments are put into the
regression of interventional group (X). The choose of confounding factors into propensity score analysis is determined by clinical expertise and evidence of previous studies. Those confounding factors simultaneously related to X and Y are used to generate propensity scores. Those confounding factors not related to X but related to Y should enter the final regression step, however, those either not related to X nor related to Y should not. The first step of propensity score analysis is to generate propensity score using logistic regression to model the relationship of Z and X which is dichomotous to reduce many confounding factors into a score.
The propensity score is related to the conditional probability of being assigned to one of the intervention group (Xi=1) versus control (Xi=0) given a constellation of observed covariates.
e(zi)=P(Xi=xi|Zi=zi)
Assumption: The Xi are independent given the Z’s
P(X1=x1,X2=x2,……..XN=xN|Z1=z1,Z2=z2,……ZN=zN)
=∏𝔦 𝑒(𝑍𝔦)xi{1 − 𝑒(z𝑖 )}1−x𝑖
The function of e(z) is called propensity score. The algorithm of propensity score analysis was shown in Figure 1.
After getting propensity score of each individual, the effectiveness of intervention on reducing CRC mortality rate is possibly to be estimated by propensity score analysis to generate comparability of two group. There are three methods to adjust the fact of lacking randomization in observation study: multivariate regression analysis,
stratification, and matching (RALPH B. DÕAGOSTINO J, 1998).
Multivariate regression analysis:
Propensity scores, intervention (X), and other variables are put into multivariate regression analysis. The effect of X on outcome (Y) can be obtained after adjusting propensity score and other variable.
Stratification:
The propensity scores are used to stratify patients into five groups, and then separate multivariate regression analyses can be done within each stratum.
Matching analysis:
The subjects who received intervention are matched on their propensity scores to subjects who did not receive intervention by using logit function of propensity score.
2.3.2 Correct non-compliance bias in case-control studies by employing external data from previously published RCT of screening
The problem exists in the case-control studies which is conducted within the context of a population screening programme, in which the invitation to screening is extended to the whole population within a given age range, is bias due to self-selection of those exposed to screening (since those who are exposed to screening are those who have voluntarily complied with the invitation and those not exposed are those who decided not to accept the invitation). Duffy SW et al. proposed a simple method to correct non-
compliance bias in case-control studies to evaluate cancer screening programmes by employing external data from previously published RCT of screening (Duffy SW CJ, 2002). The idea came out from Cuzick et al. to estimate the effect of non-compliance in randomized trials of screening (Cuzick J, 1997). There are two methods for estimation of relative risk of cancer death. One is using intention-to-treat method, and the other method
different from using intention-to-treat effect has three quantities for correcting self- selection bias: 1. estimated relative risk of breast cancer death for compliers compared with non-compliers, 2. previously published randomized trials, and 3. the proportion of subjects complying with invitation to screening from the current study.
2.3.3 Bayesian model for self-selection adjustment
To evaluate the effect of screening, control group is important. Control group is either from the uninvited group or prescreening period, however concurrent control is not so available while evaluating the effect of screening. Comparator group in some studies are from the non-responders to the invitation. The advantage of using non-attenders as comparator is that using contemporaneous data can eliminate history effect which means that therapy changes over time or increasing incidence. However, using non-attenders is prone to have self-selection bias. Bayesian acyclic graphic model was a method proposed for correcting self-selection bias with or without incorporation of prior information derived from previous studies by Wu et al (Wu JC, 2010). It could be used in self- selection bias adjustment to evaluate an organized but non-randomized cancer screening program in a small geographic area. The acyclic Bayesian graphic model was used sequentially to obtain a global estimate of effect that corresponds to meta-analysis.
2.3.4 Further application of propensity score analysis for self-selection adjustment One study with matched dataset using propensity score analysis for selection bias adjustment revealed that a 1.69-fold (95% CI 1.47 to 2.08) increased risk for mortality from CRC in noncompliance group (Lee YC, 2017). The variables, age, sex, FHbC, brand
of FIT, and the prevalence/subsequent screen, were included in the calculation of the propensity score.
2.3.5 The relative risk adjusted for the self-selection bias
When comparing relative risk of referral with non-referral group about CRC mortality rate, self-selection bias is needed to be adjusted. Because of ethical concern, uninvited group (FIT positive patient assigned to not to receive colonoscopy) as control group is not feasible in our scenario. We can use the mortality rate of same length as that of screening period before screening era as the uninvited group as the reference (Duffy SW, 2002). The equation for the relative risk (RR) adjusted for the self-selection bias is as following (Chiu HM, 2015; Chen LS, 2010):
(Compliance Rate[CR]) x RRcompliance/uninvited + (1-CR) x RRnon-compliance/uninvited.
Chapter 3 Material and Methods
3.1 Keelung Community-based Integrated Screening Programme
Data on the evaluation of the impact of referral for colonoscopy was derived from the cohort attending Keelung Community-based integrated Screening programme (KCIS) between 1999 and 2010. Details of the study design, target population, screening process, handling of referrals, and surveillance have been described in full elsewhere (Chen TH, 2004). In brief, the service of a multiple-screening programme for five neoplastic diseases including CRC, liver cancer, breast cancer, cervical cancer, and oral cancer and three chronic disease including hypertension, diabetes, and hyperlipidaemia was provided to the residences of Keelung at annual basis. For CRC screening, the FHbC measured by FIT was provided to eligible subjects at biennial basis. Subjects with positive results defined by the FHbC higher than 20 μg/g feces were referred to receiving the
confirmatory diagnosis of colorectal neoplasm using colonoscopy. During the process, the screening result of FIT value, whether the subjects with positive FIT results were compliant to the referral, and the results of confirmatory colonoscopy were collected.
Information on the demographic characteristics, comorbidity, behavior exposure such as exercise habit, dietary pattern, smoking and alcohol consumption, betel quid chewing, and social economic status such as education level were also collected by structured questionnaire. Due to the availability on the information on the methods of confirmatory examination following a positive FIT during the early period, we included all
confirmatory methods in current analysis.
A total of 2,591 subjects of the KCIS cohort with positive FIT during the period of 1999 to 2010 were enrolled for analysis. This cohort was followed till the occurrence
of CRC with the stage information collected and also the occurrence of CRC death till the end of 2016.
3.2 Data on Taiwanese nationwide population-based colorectal cancer screening program
The Taiwanese organized service CRC screening program was launched in year 2004 aimed at detecting colorectal neoplasm at their early stage based on FHbC measured by FIT at biennial basis. The target population was those aged between 50 and 69 years and later extended to 74 years in 2013. Consistent with the cutoff value for positive FIT applied in Keelung, the cutoff used in Taiwanese nationwide population-based colorectal cancer screening program was set at 20 μg/g feces. Screening attendants with positive FIT result were referred to receive confirmatory examination using colonoscopy as a major tool. Although the referral for colonoscopy for FIT-positive subjects was
considered as the standard, alternatives including double contrast barium enema with or without sigmoidoscopy, and sigmoidoscopy alone during the rolling out period of the nationwide colorectal cancer screening programme. To evaluate the impact of referral on colonoscopy, we focus mainly on the use of colonoscopy as the confirmatory tool and using the estimates derived from referral for all confirmatory examinations as an auxiliary result.
Information on screening attendance including demographic characteristics, history of screening attendance, characteristics of the unit where the screening service was provided, and the results of FIT and confirmatory examination were collected in national screening registry. In addition to the screening and confirmatory results, the
process including the date of the provision for FIT results, referral, and confirmatory examination were also recorded. Information on whether the attendants are developed into the status of colorectal cancer, the staging results, and the occurrence of CRC death and other cause of death were derived by the comparison of the national screening registry, national cancer registry, and national death registry.
In current analysis, 49,830 subjects with positive FIT result attending the Taiwanese nationwide population-based colorectal cancer screening program during the period of 2004-2009 were enrolled. The enrolled subjects were followed to identify the occurrence of CRC and the stage information and CRC death by comparing the national cancer registry and national death registry till the end of 2014.
On assessing the impact of referral on colonoscopy, CRC mortality was used as the primary outcome. The detrimental effect of non-referral on the incidence of advanced CRC defined by stage II, III, and IV was also evaluated.
3.2 Statistical methods for the impact of non-referral on colonoscopy
Although the efficacy of colonoscopy on reducing the risk of CRC death and the occurrence advanced CRC have been well demonstrated (Chiu et al., 2015), the benefit of FIT-based screening programme followed by the colonoscopic confirmation to reach the aim of early diagnosis and treatment can only be attained for those comply with referral.
As the FIT-positivity is the surrogate for colorectal neoplasm, the non-referral behavior thus results in the harmful effect of colorectal cancer death and the progression of advanced colorectal lesion from the early stage that may be averted through the referral for colonoscopy. On assessing the impact of referral on colonoscopy the conventional
designed-based approach is obviously not feasible. We thus applied a series of statistical methods including propensity score-based approach and intention-to-untreat and non- compliance adjustment methods to quantify the detrimental effect of non-referral for colonoscopy.
3.3.1 Propensity score analysis
The score on assessing the propensity of complying with the referral for colonoscopy was first derived by using a logistic regression model incorporating the factors that may have effect on the referral behavior. On assessing the impact of referral on colonoscopy, the detrimental effect of non-referral was evaluated with the adjustment for between-group differences in baseline characteristic summarized by the propensity score. Regarding the propensity matching analysis, then matched data set was derived through a comparable propensity score for referred and non-referred subjects. By using the matched data set, we estimated the hazard ratio and the corresponding 95%
confidence interval (CI) of the CRC-specific mortality rate and the incidence rate of advanced stage of CRC of the compliance group vs that of noncompliance group using Cox regression model. As a comparison, the Cox regression model using the factors relevant with referral behavior as the adjusting covariate was also applied to quantify the impact of non-referral on CRC mortality and the risk on the occurrence of advanced CRC.
3.3.2 Propensity score analysis with two-stage process of referral Hurdle Poisson regression model
The hurdle regression model proposed by Mullahy in 1986 as modified count data model to fit the over- and under- dispersion encountered in standard Poisson regression model. There are two components in the hurdle Poisson model, one is the binary part (hurdle part) to depict whether the event occur or not, and the other is the count part (non- hurdle part) to measure the number of event when it occurred. Jen et al. (2019) applied it to the Taiwanese nationwide CRC screening program with FIT during the 2004-2013. In the study, the hurdle Poisson regression model not only accommodate the issue of
whether subjects refer to confirmatory exam or not, but also consider the concern of how long they have waited for confirmatory exam among these compliers. The first part is the hurdle part, we assumed Y is a binary outcome of taking confirmatory exam or not (Y=1 for non-compliance and Y=0 for compliance), which followed a Bernoulli distribution with probability of non-compliance p. This hurdle part can be modelled by the logistic regression model to identify which factors affect subjects refusing to undergo
confirmatory exam. The other part is the non-hurdle part, we assumed T is time to undergo confirmatory exam, which followed an exponential distribution with mean waiting rate λ. It can be transformed into Poisson distribution to model the number of count (compliers underwent confirmatory exam) within waiting time t. Therefore, the non-hurdle part can be modelled by a truncated Poisson regression model given the count greater than one to capture which factors affect the waiting time for confirmatory exam among compliers. After constructing the Hurdle Poisson regression model, the probability mass function (p.m.f) can be expressed as
P(𝑌 = 𝑦) =
𝑝 , 𝑓𝑜𝑟 𝑦 = 0 (1 − 𝑝) ( )
! , 𝑓𝑜𝑟 𝑦 > 0 (1)
To take covariates (x) into account, we model p by the logistic regression model with
𝑙𝑜𝑔𝑖𝑡(𝑝) = 𝒙𝜸 (2)
, and λ by the Poisson regression model with
𝑙𝑜𝑔(𝜆𝑡) = 𝒙𝜷 (3)
Because this study did not follow up the outcomes such as incident advanced CRC and death from CRC, we therefore extended this study by incorporating the hurdle Poisson regression model into the propensity score analysis to evaluate the efficacy of referral on CRC mortality and advanced cancer incidence.
Hurdle Coxian phase-type regression model
As using the hurdle Poisson regression model, the waiting time was captured by the non-hurdle part and followed an exponential distribution with constant hazard.
However, it might exist the heterogeneity on the waiting time among these compliers, therefore, we can apply the Coxian phase-type model to the waiting time and optimize how many number of phase can accommodate the heterogeneity. The Coxian phase-type process often used to describe the positive-skewed time-to-event data of a finite discrete states in continuous time. As applied Coxian phase-type model to waiting time for confirmatory exam, we suppose this process has k+1 phases, where 1st-kth are transient phases and (k+1)th is absorbing phase, and it can only start from the 1st transient phase:
Assume T be the time to undergo confirmatory exam (waiting time) followed by Coxian phase-type distribution which has three necessary components:
Initial probability vector 𝝅 = (1,0, … ,0), (4) and Intensity matrix restricted to the transient phases of
𝐐 =
−(𝜆 + 𝜇 ) 𝜆 ⋯ 0
⋮ −(𝜆 + 𝜇 ) ⋱ ⋮
0 0 ⋯ −𝜇
(5)
Transition rates from transient phases to the absorbing phase
𝒒 = (0, μ , ⋯ , μ ) (6)
Therefore, the probability density function (p.d.f) can be expressed as
f(t) = 𝝅exp(𝑸t)𝒒. (7)
Because the transient phases (dashed box) are hidden phases which cannot be observed directly, we don’t know how many phases are the best one. Firstly, we have to do the model selection with BIC, so the number of phases in waiting time can be optimized.
After determining the number of phases, we can use the proportional hazard regression form to consider covariates such as score of waiting time derived from non-hurdle part of Hurdle Poisson regression model, and FHbC value. The proportional hazard regression form can be given as
Transition rate: 𝜆 = 𝜆 exp (𝛽 × 𝑆𝑐𝑜𝑟𝑒 + 𝛽 × 𝑓𝐻𝑏)
Absorbing rate: 𝜇 = 𝜇 exp(𝛽 × 𝑆𝑐𝑜𝑟𝑒 + 𝛽 × 𝑓𝐻𝑏). (8) As a result, the Hurdle Coxian phase-type model here is incorporate the concept of the Hurdle Poisson regression model with the Coxian phase-type process by altering the non- hurdle part from truncated Poisson model to Coxian phase-type model
Propensity score analysis with the two-stage referral process
In our analysis, we firstly used the hurdle Poisson regression model to model the event of referral as well as the waiting time of confirmatory exam. Then, we calculated the scores based on the regression coefficients of the multivariable analysis and got two scores as follows.
𝑠𝑐𝑜𝑟𝑒 = 𝑙𝑜𝑔𝑖𝑡(𝑝) = 𝒙𝜸,
𝑠𝑐𝑜𝑟𝑒 = 𝑙𝑜𝑔(𝜆𝑡) = |𝒙𝜷| (9) The first one was the score of noncompliance (score1) representing the greater score, the less likely to comply with confirmatory exam, and the second one was the score of waiting time (score2) meaning the greater score, the longer waiting time. Afterwards, we regarded the score of noncompliance as a propensity score to do the propensity score adjusting analysis and propensity score matching analysis, and also utilized the score of waiting time for further adjustment.
Regarding the Coxian phase-type approach for the two-stage referral process, the score depicting the tendency of being non-referral can be derived similarly as that for Hurdle Poisson regression model. Based on the derived score for being non-referral, the propensity score analysis with adjustment and matching can be applied with the phase of waiting derived from the Coxian phase-type modeling can be incorporated to quantify the impact of non-referral on colonoscopy. Note that under the context of Coxian-phase type approach, the probability estimated from the model is a quantity depicting the tendency of transition between the phases of waiting status rather than the score for longer waiting time as derived by using the Hurdle Poisson regression model.
3.3.3 Impact of referral to colonoscopy evaluated by intention-to-untreat and non- compliance adjustment
Intention-to-untreat adjustment
Cuzick et al. proposed two indicators to evaluate the efficacy of treatment among compliers when the study design is not a RCT. The first one is similar to intent-to-treat
analysis to adjust the self-selection bias. In our study, we applied it to the issue of non- referral for colonoscopy exam among FIT positive subjects. Here we named it as intent- to-untreat (ITU) adjustment. The equation can be expressed as
ITU − RR =𝑃(𝐶𝑅𝐶 𝑑𝑒𝑎𝑡ℎ|𝑅) 𝑃(𝐶𝑅𝐶 𝑑𝑒𝑎𝑡ℎ|𝑅)
= 𝐶𝑅𝐶 𝑑𝑒𝑎𝑡ℎ 𝑅, 𝐶 × 𝐶 𝑅 𝐶𝑅𝐶 𝑑𝑒𝑎𝑡ℎ 𝑅, 𝐶̅ × 𝐶̅ 𝑅
𝐶𝑅𝐶 𝑑𝑒𝑎𝑡ℎ 𝑅
= 𝑃(𝐶|𝑅) ×𝑃(𝐶𝑅𝐶 𝑑𝑒𝑎𝑡ℎ|𝐶)
𝑃(𝐶𝑅𝐶 𝑑𝑒𝑎𝑡ℎ|𝑅)+ 𝑃(𝐶|𝑅) ×𝑃(𝐶𝑅𝐶 𝑑𝑒𝑎𝑡ℎ|𝐶̅) 𝑃(𝐶𝑅𝐶 𝑑𝑒𝑎𝑡ℎ|𝑅)
= (1 − 𝑟) × 𝑅𝑅 / + 𝑟 × 𝑅𝑅 / (10)
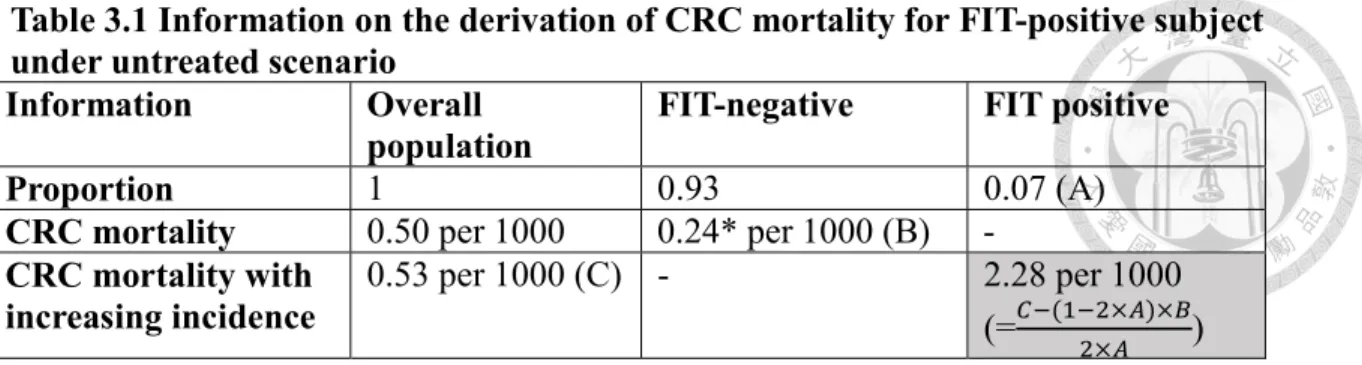
where r is the noncompliance rate of colonoscopy exam; C and 𝐶̅ represent those who had exact complied with colonoscopy exam and those who had not complied with colonoscopy, separately; R and 𝑅 represent those FIT positive subjects who needed to be referred to colonoscopy and those FIT positive subjects but haven’t been provided colonoscopy, separately. Because it is not a RCT, we cannot know the baseline CRC mortality if all FIT positive did not receive colonoscopy exam (nonreferral group), which is the gray area in the following layout. Therefore, we need the information before implementation of nationwide CRC screening program (2003) to project the baseline CRC mortality with extrapolation method. The layout of collected information is listed as in Table 3.1.
It is pretty complicated to project the CRC mortality of FIT positive if they have not been provided the colonoscopy exam, because actually they would receive the exam in the real situation, so we started from those who had negative results and recalculated it back. The formula is given by
𝑀𝑜𝑟𝑡𝑎𝑙𝑖𝑡𝑦 = 𝑝 × 𝑀𝑜𝑟𝑡𝑎𝑙𝑖𝑡𝑦 + (1 − 𝑝) × 𝑀𝑜𝑟𝑡𝑎𝑙𝑖𝑡𝑦 (11) where p is the total positive rate.
In our nationwide data, it shows 7% positive rate (A) in the prevalent screen and also subsequent screen, so we assume the total positive rate among total positive subjects is 14% (2 × 𝐴). As a results, the CRC mortality of FIT positive is overall CRC mortality deducted by the CRC mortality of FIT negative then divided by the total positive rate, which can be derived from
𝑀𝑜𝑟𝑡𝑎𝑙𝑖𝑡𝑦 =𝑀𝑜𝑟𝑡𝑎𝑙𝑖𝑡𝑦 − (1 − 𝑝) × 𝑀𝑜𝑟𝑡𝑎𝑙𝑖𝑡𝑦 𝑝
= . . × .
. = 0.00228 (12)
This baseline mortality of FIT positive is the same as the mortality of non-referral 𝑃(𝐶𝑅𝐶 𝑑𝑒𝑎𝑡ℎ|𝑅).
In order to adjust for confounding factors, we used the Poisson regression model to estimate the relative risk of CRC death, which can be given by
log(μ) = log(person − year) + α + 𝛽 × 𝐼 + 𝛽 × 𝐼 + 𝜸𝑿 (13) where 𝐼 = 1 represents compliance group, 𝐼 = 1 represents noncompliance group, 𝐼 = 0 and 𝐼 = 0 represent nonreferral group, and X are other confounding factors such as areas. By using the regression form, the ITURR can be derived by
ITU − RR = (1 − 𝑟) × exp (𝛽 ) + 𝑟 × exp (𝛽 ) (14)
Non-compliance adjustment
The other indicator is for noncompliance adjustment. In our study, we applied it to explain the efficacy of referral if all positive subjects comply with colonoscopy exam.
The formula can be expressed as
NCRR = × /
( )× / (15)
because we have already had the baseline CRC mortality of non-referral
(𝑀𝑜𝑟𝑡𝑎𝑙𝑖𝑡𝑦 ), we could calculate the relative rate adjusted for noncompliance (NCRR) with the Poisson regression model directly by using the identical method of ITU analysis.
Chapter 4 Results
4.1 Results on the analysis for the impact of referral for colonoscopy based on KCIS cohort
4.1.1 Demographic characteristics
Table 4.1.1 shows the demographic distribution of CRC mortality for FIT-positive subjects in KCIS attendants. A total of 43 and 63 CRC deaths were observed in referred and non-referred group with 11670.7 and 16292.9 person-year of follow-up, respectively, which gives the mortality of 368.4 and 386.7 per 100,000, respectively. The
characteristics of male, current smoker, current drinker, those with exercise habit had an elevated CRC mortality. The higher the FHbC level, the higher the CRC mortality.
Subjects with the education level of illiterate had the highest risk of CRC mortality, followed by elementary school and senior high school.
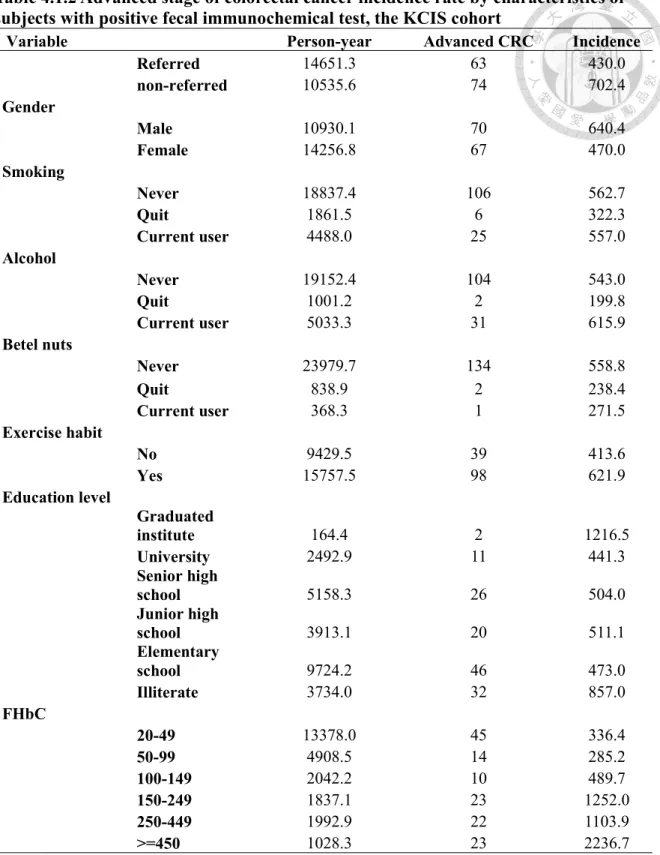
Table 4.1.2 shows the demographic distribution of the incidence of advanced CRC for FIT-positive subjects attending KCIS. The total number of advanced CRC of 63 and 74 subjects were identified with incidence rates of 430 and 702 per 100,000 person-years in referral and non-referral group, respectively. Male, current drinker, subjects with exercise habit had a higher incidence of advanced CRC (defined by stage II, III, and IV).
The attendees who stated the smoking status of never and current user had a higher incidence of advanced CRC. Consistent with the observation in CRC mortality, an increasing trend in the incidence of advanced CRC was observed for the increasing in FHbC.
Table 4.1.3 shows demographic distribution for referral and non-referral for FIT positive subjects of KCIS attendee. Male (58.9%) have higher referral rate compared with
female (54.0%). Those reported the smoking status of never (55%) and current user (58.2%) have a lower referral rate compared with those abstinence from smoking (63%).
Attendee with the habit of exercise have a lower referral rate (51.3%) compared with those without the habit (58.8%). Among the diet habit, vegetable intake, meat
consumption, sea food consumption, bean/egg intake, and fruit consumption
demonstrated a significant difference for referral behavior. Compared with those with the habit of drinking coffee (Sometimes: 56.8% Often: 56.4%), those without such a habit (48%) have a substantially low referral rate. Similar phenomenon is observed for the habit of soft drink consumption.
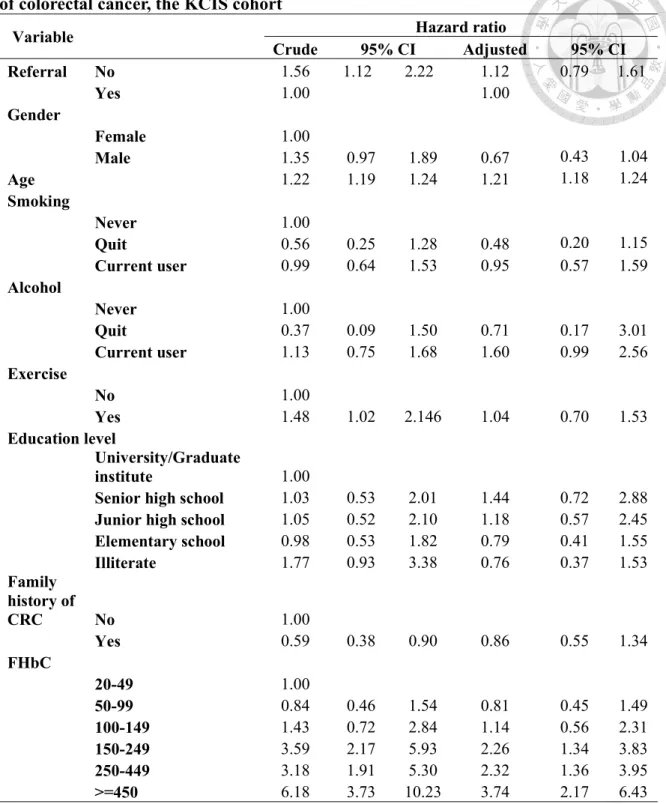
4.1.2 Estimated results of crude and adjusted hazard ratios for CRC death and advanced stage of CRC
Estimated results of the crude and adjusted hazard ratio for CRC death and advanced stage of CRC incidence are listed in Table 4.1.4 and Table 4.1.5, respectively.
The crude estimate on the risk of CRC death due to non-referral was 2.08 (95%
CI 1.43-3.13, Table 4.1.4). Factors associated with the risk of CRC death including sex, the habit of exercise, and the increase in FHbC. The effect of non-referral resulted in the increase in CRC death by 69% (95% CI: 14-156%, Table 4.1.4) was estimated after adjusting for relevant factors.
The crude estimate for the detrimental effect of non-referral on the occurrence of advanced CRC was estimated as 1.56 (95% CI: 1.12-2.22, Table 4.1.5). Consistent with the observation in demographic distribution, male and attendee reported as having the habit of exercise have a higher risk of advanced CRC. An increasing trend in the risk of
advanced CRC was observed for the increased FHbC level. After adjusting for the factors relevant with advanced CRC, the risk of non-referral behavior results in the increasing in advanced CRC by 12% (95% CI: -21-61%, Table 4.1.5).
4.1.3 Estimated results on the effect of factors associated with referral rate
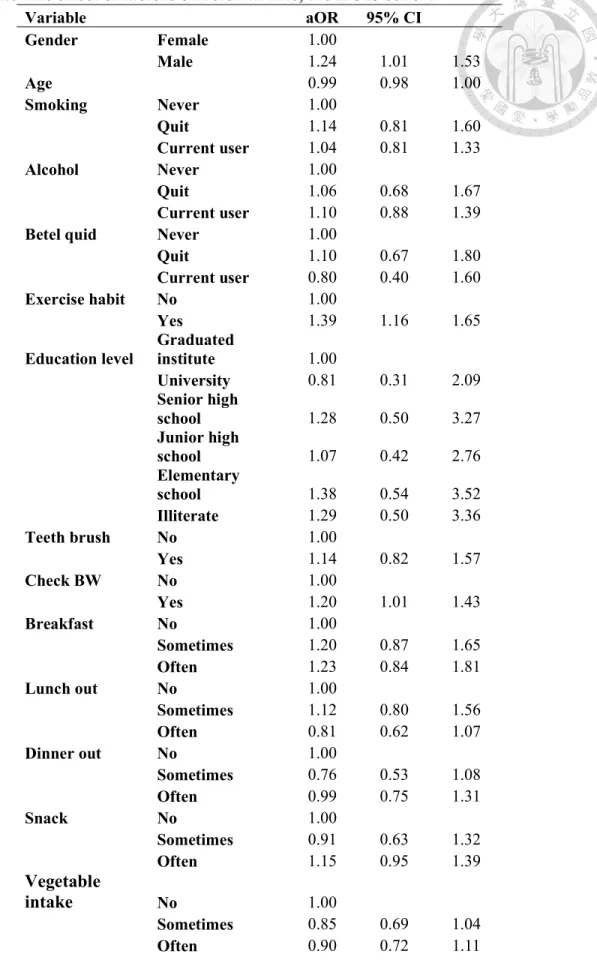
Table 4.1.6 lists the estimated results on the effect of factors on referral rate for KCIS cohort. Among a pile of factors, gender, the habit of exercise, the habit checking body weight, and the habit of soft drink consumption were significantly associated with referral behavior. The KCIS attendees have at least one unanswered item of the enrolled questions also have a lower probability of being referral. Specifically, the estimated results on the effect of factors associated with referred rate were shown in Table 4.1.3.
Male subjects, exercise habit, habit of checking body weight, soft drink sometimes and often, and missing data had statistically significant higher inclination to receive
confirmation colonoscopy with odds ratios of 1.24 (95% CI: 1.01-1.53), 1.39 (95% CI:
1.16-1.65), 1.20 (95% CI: 1.01-1.43), 1.44 (95% CI: 1.02-2.03), 1.38 (95% CI: 1.03-1.85) and 1.71 (95% CI: 1.15-2.54) respectively. Meat intake sometimes and often had
statistically significant lower inclination to receive confirmation colonoscopy with odds ratios of 0.74 (95% CI: 0.56-0.97) and 0.62 (95% CI: 0.44-0.88) respectively. Based on these factors relevant to being compliant with referral, a score depicting the propensity of attending referral visit was derived for each subject, which entails us the mating the referral and non-referral to evaluate the efficacy of referral on CRC mortality. In the following analysis using the score on the propensity of being referral, we first applied the propensity score adjusting approach followed by the propensity matching approach.
4.1.4 Propensity score analysis for the impact of referral on colonoscopy Analysis with adjustment for the propensity score
Table 4.1.7 shows the estimated results on the impact of non-referral on
colonoscopy regarding CRC mortality and the risk of advanced CRC. After adjusting for the propensity of referral, the behavior of non-referral brings the detrimental effect on the risk of CRC mortality and advanced CRC by 82% (95% CI: 22-170%) and 49% (5- 113%), respectively. Compared with the estimated results on the harmful effect of non- referral for colonoscopy estimated by using conventional Cox regression model, the adjustment using propensity score results in an estimate away from the null.
Analysis with propensity score matching
In addition to making use of propensity score as an integrated covariate taking into account all factors that may have effect on referral behaviour, we also adopted the propensity score matching aimed for the derivation of a comparable group for the estimation of the effect of non-referral for colonoscopy. The demographic characteristic for the cohort of 1,023 matched subjects are listed in Table 4.1.8. After using the
propensity score matching, the distribution of factors among the referral and non-referral group showed a homogenous result. Table 4.1.9 shows the results by using the propensity score matching approach. The estimated results on the non-referral behavior on
colonoscopy for CRC mortality is 2.04 (95% CI: 1.30-3.23), corresponding to the increase in the risk by 104% (95% CI: 30-223%). The result is consistent after further adjusting for FHbC (108%, 95% CI: 32-223%).
Regarding the non-referral on the risk of having advanced CRC, the estimated results based on propensity matching approach is 1.67 (95% CI: 1.11-2.50, Table 4.1.10), which gives the increase in risk by 67% (95% CI: 11-150%). The estimated result with further adjustment for FHbC gives the figure of increase in the risk of advanced CRC by 61% (95% CI: 8-144%, Table 4.1.10).
4.2 Results on the analysis for the impact of referral for colonoscopy based on Taiwan nationwide colorectal cancer screening programme
4.2.1 Demographic characteristics of FIT positive subjects
During the period, there were 497 CRC deaths and 1450 advanced CRCs (defined as AJCC staging above 2) among non-referred group and referred for colonoscopy group.
The proportion of CRC death and advanced CRC among subjects without referral are higher than those with referral (Table 4.2.1). Male, elderly, southern residents, those underwent screening at hospital and screened at first round, and those with higher FHbC have higher risk of CRC death as well as advanced CRC. In Table 4.2.2, there are not much difference on the referral rate between gender, age group, and FHbC. Those lived in southern Taiwan, underwent screening at public health centers, and screened at
subsequent round have more likelihood of referral with confirmatory exam. For those compliers, the median waiting times for confirmatory exam are distinct among
geographic area, and type of screening units. The overall median waiting time is around 27 days.
4.2.2 Estimated results by using Cox regression model
In Table 4.2.3 (a), the result of univariate analysis shows the effect of non-referral for colonoscopy increased by 65% CRC mortality (crude HR=1.65, 95% CI=1.36-2.00) and non-referral for all confirmatory exam by 53% (crude HR=1.53, 95% CI=1.27-1.84).
In the multivariate analysis after adjusting gender, age group, geographic are, type of screening units, screening round, and FHbC, it shows 59% (aHR=1.59, 95% CI=1.30- 1.92) and 46% (aHR=1.46, 95% CI=1.21-1.77) CRC mortality increased in comparison with referral with colonoscopy and all confirmatory exam, separately. Table 4.2.3 (b) lists the estimated results on the impact of referral taking into account all confirmatory
examination. The crude HR of non-referral on the risk or CRC mortality was estimated as 1.53 (95% CI: 1.27-1.84). After adjusting for factors associated with referral, the aHR for non-referral was estimated as 1.46 (95% CI: 1.21-1.77).
In Table 4.2.4 (a) and (b), compared with non-referral group, the crude HRs on advanced CRC are 1.37 (95% CI=1.22-1.54) and 1.30 (95% CI=1.16-1.46) in referral with colonoscopy group and with all confirmatory exam, respectively. After adjustment on confounding factors, the corresponding aHRs decline to 1.22 (95% CI=1.09-1.39) and 1.18 (95% CI=1.05-1.33). Table 4.2.4 (b) shows the corresponding results for FIT-
positive subjects referral for all confirmatory examinations with the HR and aHR of non- referral estimated as 1.30 (95% CI: 1.16-1.46) and 1.18 (95% CI: 1.05-1.33),
respectively.
4.2.3 Results on two-stage referral process Hurdle Poisson regression model
Table 4.2.5 shows the results on the regression coefficients derived by using Hurdle Poisson regression model. The left column lists the estimated regression
coefficients of the hurdle part (whether subject referred or not) and the left column lists that of non-hurdle part (how long subject waited among compliers). The estimated coefficients were further used for the derivation of the score for non-noncompliance and the score for waiting time as follows.
Score of noncompliance= -0.7344 - 0.0767×Male + 0.0312×Age(55-59) + 0.0323 ×Age(60-64) + 0.2188×Age(65-69)
- 0.2437×Area(Northern) - 0.0457×Area(Middle) - 0.1724×Area(Southern) + 0.1531×Unit(Hospital)
- 0.7677×Unit(Public health centers) - 0.6407×round(Subsequent), and
Score of waiting time = | -4.0137 + 0.0055×Male - 0.0137×Age(55-59) - 0.0046 ×Age(60-64) - 0.0053×Age(65-69)
+ 0.1525×Area(Northern) + 0.2359×Area(Middle) + 0.1600×Area(Southern) - 0.0982×Unit(Hospital)
+ 0.2047×Unit(Public health centers) + 0.0737×round(Subsequent) |.
The two scores representing the two-stage of the referral process, namely the compliant to referral and the waiting time among those compliant with referral and thus further be used for the propensity score analysis. In the propensity score analysis, we use the score of non-compliance to be a propensity score for adjustment and also matching with non-
complier and complier.
Table 4.2.6 and Table 4.2.7 show the estimated results by using the Hurdle Poisson regression in conjunction with the propensity score adjusting analysis for assessing the two-stage process for referral on the risk of CRC mortality and that for advanced CRC, respectively. In the propensity score analysis adjusting for the non- referral score, the estimated results show that compared to referral for colonoscopy, aHR is 1.59 (95% CI=1.32-1.92, Table 4.2.6 (a)) on CRC death and 1.23 (95% CI=1.10-1.39, Table 4.2.7 (a)) on advanced CRC after adjusted non-compliance score, and FHbC.
Regarding the referral for all confirmatory examinations, the estimated aHR decrease to 1.46 (95% CI: 1.21-1.77, Table 4.2.6 (b)) on CRC death and 1.19 (95% CI:
1.06-1.34, Table 4.2.7 (b)) on advanced CRC. Both of these models demonstrate the greater the non-compliance score, the higher risk on CRC death and advanced CRC. After taking into account the score of waiting time, the estimated results on the effect of non- referral are robust for both the risk of CRC mortality and advanced CRC. Although greater score of non-compliance or score of waiting time has higher risk of CRC death, both of these covariates are not statistically significance for CRC death.
We further applied the propensity score matching together with the Hurdle Poisson mode to elucidate the impact of referral process on colonoscopy with the
estimated results shown in Table 4.2.8 (for CRC morality) and Table 4.2.9 (for advanced CRC incidence). The score of non-compliance (score 1) derived as mentioned above was used as the propensity score to match between the compliers and non-compliers. The results show that the aHR of non-referral reduce to 1.49 (95% CI=1.15-1.92, Table 4.2.8 (a)) on CRC mortality and 1.22 (95% CI=1.04-1.43, Table 4.2.9 (a)) on advanced CRC
incidence in comparison with referral for colonoscopy.
The corresponding estimated results for the effect of non-referral taking into account all referral examinations are 1.40 (95% CI:1.09-1.81, Table 4.2.8 (b)) and 1.15 (95% CI: 0.99-1.34, Table 4.2.9 (b)) for CRC death and advanced cancer incidence, respectively. Similar to the analysis regarding only referral for colonoscopy, the effect of waiting time was significantly associated with the risk of advance CRC (aHR: 3.56, 95%
CI: 2.17-3.85, Table 4.2.9 (b)) but not for the risk of CRC mortality (aHR: 1.67, 95% CI:
0.72-3.91, Table 4.2.8 (b)).
Hurdle Coxian phase-type regression model
In addition to the Hurdle Poission model, we also adopted the Hurdle Coxian phase-type regression model to disentangle the effect of two-stage process of referral on CRC mortality and the occurrence of advanced CRC. Regarding the determination of number of phases required for depicting the waiting process among those compliant with referral, a BIC criteria was adopted. Based on the results of model selection, the optimal number of phases describing the process of waiting for colonoscopy is 2, corresponding to the short-waiting state and long-waiting state. The compliers were thus classified into high-risk group (higher waiting time score) and low-risk group (lower waiting time score) by using the estimated results of transition probability from short-wait status to long-wait status.
The estimated results on the detrimental effect of non-referral for colonoscopy by using the propensity score adjustment analysis show that after taking score of non-
compliance and the probability of long-wait status, the aHR is 1.61 (95% CI=1.32-1.96,
Table 4.2.6 (a)) for CRC death and 1.25 (95% CI=1.11-1.41, Table 4.2.7 (a)) for advanced CRC. The corresponding results taking into account all confirmatory examination show that the aHR is 1.47 (95% CI=1.21-1.78, 4.2.6 (b)) for CRC death and 1.21 (95%
CI=1.07-1.36, 4.2.7 (b)) for advanced CRC.
In the propensity score mating analysis, the aHR of non-referral was estimate as 1.52 (95% CI=1.16-1.96, Table 4.2.8 (a)) for CRC mortality and 1.28 (95% CI=1.09- 1.49, Table 4.2.9 (a)) for the risk of advanced cancer. The corresponding results taking into account all confirmatory examination show that the aHR is 1.42 (95% CI=1.10-1.85, 4.2.8 (b)) for CRC death and 1.20 (95% CI=1.03-1.41, 4.2.9 (b)) for advanced CRC.
By using the Hurdle Coxian phase-type model, the long-wait status has a significant impact on the risk of advanced CRC but which is not statistically significant for CRC mortality. This can be interpreted as that in comparison with those with lower tendency for transition into long-waiting status, subjects with high tendency in such a transition have a 4-fold and 3.7-fold risk for advanced CRC regarding the referral for colonoscopy and all confirmatory examinations, respectively.
4.3 Analysis of Intent-to-untreat and Noncompliance Adjustment Intention-to-untreat analysis
We further applied an intent-to-untreat analysis for assessing the impact of referral on colonoscopy among the FIT-positive subjects identified through the Taiwanese
nationwide colorectal cancer screening programme. In this approach, the heterogeneity between the areas in Taiwan and the adenoma detection rate (ADR) representing the quality of colonoscopy was considering by using a Bayesian regression model for