Chapter Three Methodology
In this chapter, brief theoretical bases are proposed first, followed by a description of research design. It is divided into three sections. The first section deals with the
selection of the subjects, introducing their major, age, and how they are recruited.
The second section elaborates the procedures of the investigation starting from questionnaire administration, pre-test, administration of oral-written dialogue journal activity, types of feedback, self-evaluation of the speaking improvement, and post-test.
Following the procedures comes the introduction of instruments used for pre- and post-test, the questionnaire, the speaking learning log, and the interview. Finally, the
coding principles are presented, aiming to analyze the areas of spoken fluency, grammatical accuracy and vocabulary development.
3.1 Theoretical Bases
3.1.1 Swain’s output hypothesis
Swain’s proposal of output hypothesis seems to provide a strong theoretical foundation for oral-written dialogue journals. It was proposed that through producing language, either spoken or written, language acquisition/learning may occur (Swain, 1985). Swain contended that output is necessary because it aids second language acquisition in many ways: “Its role is, at minimum, to provide opportunities for contextualized, meaningful use, to test out hypotheses about the target language, and to move the learner from a purely semantic analysis of the language to a syntactic analysis of it” (p. 252). First, language production provides an opportunity for meaningful practice of one’s linguistic competence, which permits the development of automaticity in their use. Second, producing language may push the learner to move from semantic processing to syntactic processing. This process
promotes ”noticing,” from which learners may notice a gap between what they want to say and what they can say (Swain, 1999, p. 125). Second language learners not only consciously recognize some of their linguistic problems but also pay their attention to something such as vocabulary or grammar that they are deficient in.
Third, output offers the opportunity to test out hypothesis – to try out means of expression and to see if they work. The interlocutors’ feedback then leads learners to modify or “reprocess” their output (Swain, 1999, p. 126). Feedback may take the form of confirmation checks, clarification requests, or implicit and explicit corrections.
Swain’s output hypothesis may apply to the use of dialogue journal since keeping OWDJs can be viewed as one opportunity to encourage students to produce the foreign language in a meaningful and authentic context. By keeping the oral journals, subjects recognize their inadequacies in vocabulary, grammar or pronunciation and they will know if their intentions are fully understood by the researcher. If not, they will modify their expressions to attain a more effective communication.
3.1.2 Vygotsky’s perspective
According to Vygotsky (1978), social interaction is a mechanism for individual development. It was in this context that he developed his concept of “zone of proximal development” (ZPD). Vygotsky argued that “an essential feature of learning is that it creates the zone of proximal development; that is, learning awakens a variety of internal developmental processes that are able to operate only when the child is interacting with people in his environment and in cooperation with his peers”
(1978, p. 90). The conditions that could realize the development must meet two criteria: one criterion is that the assistance should enable the learner to collaborate with others so as to achieve what he or she is yet unable to achieve alone. From the
scaffolding of a more capable participant, the novice can gradually internalize the process of interaction with the guidance, support, and assistance of the experienced individual. Thus, the interaction between individuals of unequal abilities is a way for the novice to extend current competence. A second criterion is that the activity should be perceived as meaningful, satisfying and relevant to life. As Nassaji &
Cumming (2000) observed, the exchange of written dialogue journals between an ESL student and his teacher successfully established a ZPD. Certain patterns in their exchanges characterized the interaction that constructed a ZPD. This evidence, therefore, sheds light on keeping OWDJs to improve speaking English in the present study.
3.1.3 The second language interactionist view
The interactionist view regards language development as a result both of input factors and of innate mechanism. It claims that language acquisition depends upon not only the provision of input but also the learner’s innate language competence.
Through the collaborative efforts of the learner and his interlocutors, learners can receive input from the interaction and the input involves a dynamic interplay with the internal factors (Ellis, 1996). Besides, according to Long (1985), interactional modification promotes acquisition. Interactional modification refers to examples such as comprehension checks and clarification requests. Comprehension checks are
“efforts by the native speaker to determine that the learner understands” (Lightbown and Spada, 1997, p. 30). Clarification requests refer to “efforts to get the learner to clarify something which has not been understood” (Lightbown and Spada, 1997, p.
30). The interactionist theory seems to strongly support the activity of the present study. When recording oral journals, the subjects sometimes need to modify what they say in order to clearly express what they want to say and make the researcher understand easily and quickly. It is this kind of interactional modification that
consolidates the researchers’ conviction in conducting this experiment.
3.2 Method
3.2.1 The subjects
A total of eleven English non-majors participated in this study. Nine of them are students of National Taiwan Normal University and two of them are students of National Taiwan University. Among these students, eight are sophomores, and three juniors. Their majors are also different including biology, geography, health education, industrial education, Chinese literature, special education, botany, and electrical engineering. To recruit them, the researcher went to several classes to introduce this activity to them. Attracted by the idea, they decided to participate in this project. They also passed this information to their friends and invited them to join in. To gain more opportunities to practice speaking English and to improve their oral English, they were motivated to participate in this project.
3.2.2 The procedures
At the beginning of the project, two kinds of questionnaires (Appendix A) were given to the subjects to explore their own perceptions and expectations. The pre-test was then conducted to investigate their initial speaking performance. After the pre-test, the subjects began to keep the OWDJ for three months from August second to November fifth in 2002. In the mid and end stages of this experiment, they were asked to fill out the speaking learning logs to evaluate their own speaking performance. Then, the post-test was administered to examine their speaking performance after joining this activity. Last, the interview was administered to explore their perceptions of this activity and further verified the quantitative analyses and the learning log results.
3.2.2.1 Questionnaire
At the beginning of the project, two kinds of questionnaires were given to the
subjects to examine their weaknesses and difficulties in speaking English as well as types of feedback they would like to get from the researcher. The results of the questionnaire will be discussed later.
3.2.2.2 Pre-test
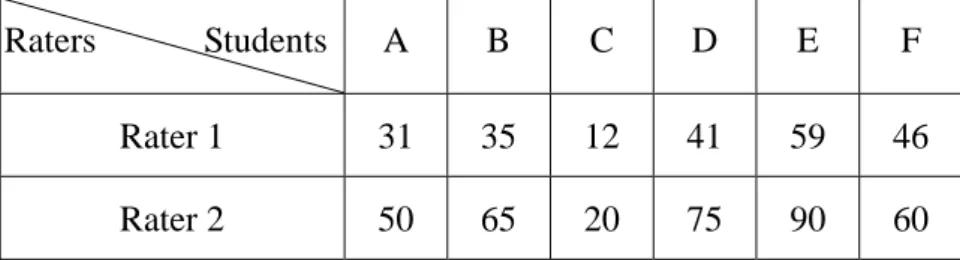
As the research aims to answer the question related to improvement in overall English speaking proficiency, it is necessary to administer a speaking proficiency test to assess the subjects’ speaking performance. The General English Proficiency Test (GEPT) high-intermediate speaking test (Appendix B) was adopted as a pre-test to evaluate the subjects’ entry levels. It was administered in a language laboratory during their free time, lasting about 20 minutes. Their answers were recorded on the audiotapes and then evaluated by two raters following the criteria of GEPT speaking test (Appendix C). The two raters are students in the graduate school of TESOL program of National Taiwan Normal University. One is a third-year M.A. student, and the other is a third-year PhD student. They were trained in a pilot study to evaluate oral performance. Before rating the pre- and post-test, they had assessed the speaking performance of other six university students in the GEPT high-intermediate speaking test (Appendix B) following the criteria of GEPT speaking test (Appendix C). The speaking performance of these six students was scored as follows (Table 3.1) and it was found that the interrater reliability had reached .94.
Table 3.1 The scores of the six subjects in the GETP high-intermediate speaking test in the pilot study
Raters Students A B C D E F
Rater 1 31 35 12 41 59 46
Rater 2 50 65 20 75 90 60
3.2.2.3 The administration of oral-written dialogue journal activity
After the pre-test, the eleven subjects began to engage in the oral-written dialogue journal activity for three months from August second to November fifth in 2002. In the orientation for this research, the purpose of the study, the time, the content and the procedure of this activity were introduced to the subjects and the handout of the introduction (Appendix D) was passed out to ensure that they understood the whole activity clearly. In short, the subjects recorded whatever they liked, including their interests, concerns, problems, complaints or opinions about certain issues, etc. If they could not think of the topics to talk about, they could select a topic from a list of reference topics given by the researcher (Appendix E).
But they were told that the topics were only for their reference, and they could not depend on the list too much. After all, this activity is learner-centered with an attempt to improve English speaking through the real communication between the subjects and the researcher. As for the time of the recording, the minimum recording time was five minutes every time and was no more than ten minutes at most. After receiving the tapes from the subjects, the researcher listened to their tapes and gave individual feedback to each of them by e-mail. Basically, such interaction maintained two times a week and for three months. Generally, these subjects handed in on Tuesday and Friday. The researcher responded within two or three days.
However, since subjects sometimes were busy with their work, went abroad or got sick, they failed to record their tape and hand it on time. Therefore, the span of the project was longer than originally scheduled. On the whole, every subject kept a total of twenty-six oral journals for the project.
3.2.2.3.1 Types of feedback
Following the introduction of the whole project, the types of feedback the researcher gave in response to the subjects’ oral journals are presented. The present
study mainly adopted Todd et al.‘s (2001) categories, with some adjustments. Since in Todd et al.’s study, the purpose of keeping dialogue journals is not to learn a foreign language, but to exchange ideas and information about language teaching,
“evaluating” might be perceived as playing an important role in affirming the participants’ (experienced teachers) ideas and feelings. However, the purpose of dialogue journals in the present study was to improve students’ spoken English, so it was assumed that “evaluating” may not play such an important role as that in Todd et al.’s study. Accordingly, among the four most useful feedback types, “adding information,” “suggesting,” “supporting,” and “evaluating,” identified by Todd et al., only “adding information”, “suggesting” and “supporting” were selected because they had something in common with most of the feedback types used in other studies.
For example, “adding information” included sharing information and opinions, responding to the topics that students recorded, answering questions and giving clarification. “Suggesting” contained the tips that could facilitate learners’ speaking or the alternatives that might help learners view problems in another way.
“Supporting” referred to the empathy that was given to show the understanding and encouragement to the subjects. Finally, “probing” and “correction,” having been proved to be helpful in many studies (Henry, 1994; McGrath, 1992; Peyton, 1991;) were included in this study. “Probing” included requesting clarification to deal with the incomprehensibility of students’ speaking and asking questions to prompt them to think critically. The way to give “correction” is to model correct forms in the researcher’s written journals or to point them out at the end of each journal in the part of “P.S.”
Judged from the results of the literature, “adding information,” “suggesting,”
“probing,” “supporting,” and “correction” were included in the present research. In order to further investigate the necessity of these five types of feedback on the
subjects, a questionnaire was given to explore their real needs.
3.2.2.4 Self evaluation of the speaking improvement
In the mid of this experiment, the subjects filled out the speaking learning log (Appendix F) to evaluate their improvement in speaking English. After the experiment was over, they were required to fill out the learning log again to evaluate their speaking performance in the second half of this experiment.
3.2.2.5 Post-test
After the three-month experiment, the GEPT high-intermediate speaking test was conducted to examine the subjects’ speaking performance after receiving the training.
There are several reasons to use the same test for the pre- and post tests. First, in order to ensure the fairness and consistency, the same test was adopted as the post-test.
Second, the subjects were not told that they would take the same test again, so they were probably not psychological prepared, not to mention highly motivated to find out the correct answers. Third, the test is not a factual memory test; instead, it tests students’ speaking skills judged from fluency, vocabulary, and grammar, etc.
Therefore, the carry-over effect might be limited.
3.2.2.6 Interview
Finally, shortly after the three-month activity was over, an interview (Appendix G) was conducted in Chinese. All of the subjects were individually interviewed face to face by the researcher during their free time and the time of each interview lasted from forty minutes to one hour. All of the interviews were recorded and transcribed subsequently (see Appendix H, for example).
3.2.3 Instruments
In order to answer the research questions of the study, the instruments include questionnaires, proficiency tests, speaking learning logs, objective measurements, and the interview.
3.2.3.1 Questionnaire
A five-point likert scale questionnaire and an open-ended questionnaire were given to the subjects before the implementation of this activity. The first section of this questionnaire is the open-ended questionnaire with an attempt to explore the subjects’ strengths, weaknesses, difficulties in speaking English, the types of feedback they would like to obtain, and the subjects’ expectations of this activity. The second section is a five-point likert scale. The question items of this scale are mainly based on the researcher’s observations and the analysis of speaking performance of a small sample of three university students in a pilot study. It is not uncommon that lack of confidence, anxiety, pauses, repetitions are the problems likely to be found in EFL learners’ speaking. Besides, errors of tense, plural forms, verbs (e.g. verb after auxiliary; confusion of active and passive voice), and prepositions were found to be the most common types of grammatical errors among the three students.
Furthermore, as previously mentioned, all these five types, namely, “adding information,” “suggesting,” “supporting,” “probing,” and “grammatical correction”
are included to double check if the subjects need these types of feedback as suggested by the previous research. In brief, the questionnaire is based on the generalization of literature review, the pilot study, and some personal observations.
3.2.3.1.1 Questionnaire results
From the two questionnaires, a wealth of information of students’ weaknesses, difficulties, and types of feedback they wanted to receive is summarized in this section.
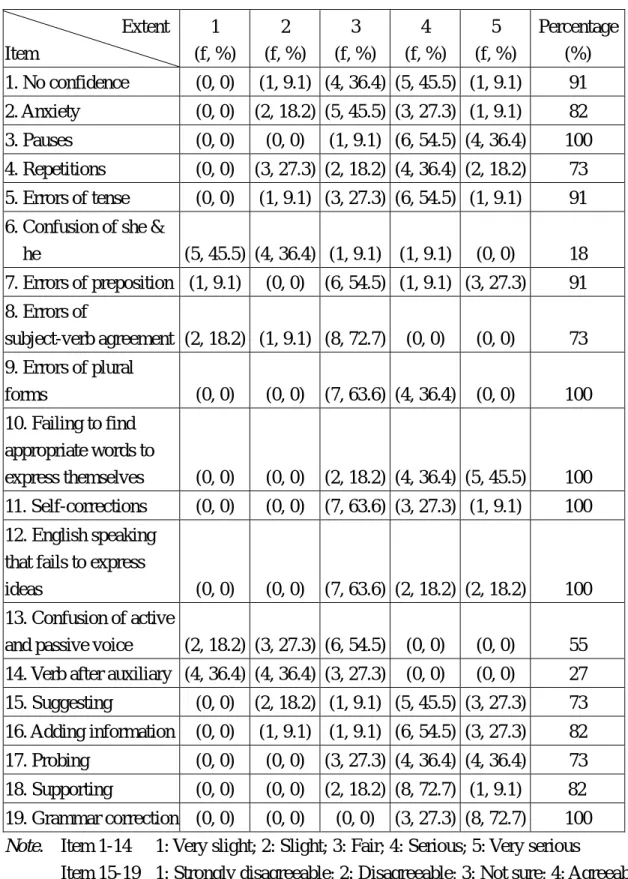
As far as the five-point likert scale was concerned, an examination of the frequency counts (number of subjects) and the percentage indicated that the most serious problems these subjects encountered in speaking English were confidence, anxiety, pauses, repetitions, errors of tense, prepositions, plural forms, and
subject-verb agreement, and vocabulary. The results were shown in Table 3.2.
Table 3.2 Questionnaire results Extent
Item
1 (f, %)
2 (f, %)
3 (f, %)
4 (f, %)
5 (f, %)
Percentage (%) 1. No confidence (0, 0) (1, 9.1) (4, 36.4) (5, 45.5) (1, 9.1) 91 2. Anxiety (0, 0) (2, 18.2) (5, 45.5) (3, 27.3) (1, 9.1) 82 3. Pauses (0, 0) (0, 0) (1, 9.1) (6, 54.5) (4, 36.4) 100 4. Repetitions (0, 0) (3, 27.3) (2, 18.2) (4, 36.4) (2, 18.2) 73 5. Errors of tense (0, 0) (1, 9.1) (3, 27.3) (6, 54.5) (1, 9.1) 91 6. Confusion of she &
he (5, 45.5) (4, 36.4) (1, 9.1) (1, 9.1) (0, 0) 18 7. Errors of preposition (1, 9.1) (0, 0) (6, 54.5) (1, 9.1) (3, 27.3) 91 8. Errors of
subject-verb agreement (2, 18.2) (1, 9.1) (8, 72.7) (0, 0) (0, 0) 73 9. Errors of plural
forms (0, 0) (0, 0) (7, 63.6) (4, 36.4) (0, 0) 100 10. Failing to find
appropriate words to
express themselves (0, 0) (0, 0) (2, 18.2) (4, 36.4) (5, 45.5) 100 11. Self-corrections (0, 0) (0, 0) (7, 63.6) (3, 27.3) (1, 9.1) 100 12. English speaking
that fails to express
ideas (0, 0) (0, 0) (7, 63.6) (2, 18.2) (2, 18.2) 100 13. Confusion of active
and passive voice (2, 18.2) (3, 27.3) (6, 54.5) (0, 0) (0, 0) 55 14. Verb after auxiliary (4, 36.4) (4, 36.4) (3, 27.3) (0, 0) (0, 0) 27 15. Suggesting (0, 0) (2, 18.2) (1, 9.1) (5, 45.5) (3, 27.3) 73 16. Adding information (0, 0) (1, 9.1) (1, 9.1) (6, 54.5) (3, 27.3) 82 17. Probing (0, 0) (0, 0) (3, 27.3) (4, 36.4) (4, 36.4) 73 18. Supporting (0, 0) (0, 0) (2, 18.2) (8, 72.7) (1, 9.1) 82 19. Grammar correction (0, 0) (0, 0) (0, 0) (3, 27.3) (8, 72.7) 100 Note. Item 1-14 1: Very slight; 2: Slight; 3: Fair; 4: Serious; 5: Very serious
Item 15-19 1: Strongly disagreeable; 2: Disagreeable; 3: Not sure; 4: Agreeable;
5: Strongly agreeable
f = Number of the subjects Item 1-14: Percentage = 3 + 4 + 5 Item 15-19: Percentage = 4 + 5
The combination percentage of “Fair” item, “Very serious” item and “Serious” item was very high in the statement of questions number one, two, three, four, five, seven, eight, nine, ten and twelve corresponding to no confidence, anxiety, pauses, repetitions, errors of tense, prepositions, subject-verb agreement and plural forms, failing to find appropriate words to express themselves and failure to express ideas.
It was inferred that they felt less competent in these parts. When speaking in English, they may lack confidence, become anxious, have many pauses and repetitions, often make errors in tense, prepositions, subject-verb agreement and plurals, and encounter difficulty in finding appropriate words to express themselves as well as in effectively conveying ideas in English. Besides, in terms of the types of feedback, the data showed that the combination percentage of “agree” and ”strongly agree” is very high in questions number fifteen, sixteen, seventeen, eighteen, and nineteen. The percentage is 73 %, 82 %, 73 %, 82 %, and 100 % respectively. Most of the subjects considered it necessary to include all five types — suggestion, adding information, probing, supporting, and grammar correction.
On the other hand, while obvious individual differences could be discerned, the findings of the open-ended questionnaire demonstrated a trend among these subjects in terms of weaknesses, difficulties in speaking English and types of feedback.
Weaknesses are those aspects in which the subjects consider that they are deficient.
Difficulties refer to the problems that cause troubles in speaking English. It seems that weaknesses and difficulties in speaking English are very similar, but there are still a slight difference. For example, five subjects considered pronunciation one of their weaknesses, but only one considered it a difficulty. That is, although their pronunciation is not good, they still can get their messages across, which does not necessarily cause a problem in speaking English. In short, weaknesses in speaking English may not result in difficulties in speaking. In terms of the weaknesses, most
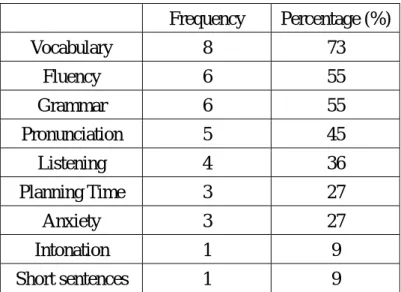
subjects’ weaknesses fell on vocabulary, fluency, and grammar (Table 3.3).
Table 3.3 Subjects’ weaknesses in speaking English Frequency Percentage (%)
Vocabulary 8 73
Fluency 6 55
Grammar 6 55
Pronunciation 5 45
Listening 4 36
Planning Time 3 27
Anxiety 3 27
Intonation 1 9
Short sentences 1 9
Note. N (number of subjects) =11; F= the number of subjects
About seventy-three percent of subjects considered their speaking performance inadequate in the aspect of vocabulary. Besides, about fifty-five percent of subjects thought that they did not perform well in the aspects of fluency and grammar, respectively.
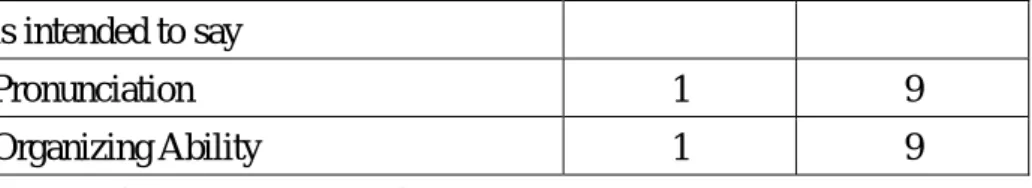
Concerning the difficulties in speaking English, the aspect of vocabulary was shown to be the most serious problem (Table 3.4).
Table 3.4 Difficulties in speaking English
Frequency Percentage (%)
Vocabulary 8 73
Fluency 4 36
Anxiety 3 27
Grammar 2 18
Attitudes towards speaking English 2 18
Confidence 2 18
Planning Time 2 18
Opportunity of speaking English 2 18
Intelligibility 1 9
Unsure whether the expression is what 1 9
is intended to say
Pronunciation 1 9
Organizing Ability 1 9
Note. N (number of subjects) =11; F= the number of subjects
About seventy-three percent of subjects considered they had difficulties in the aspect of vocabulary. About thirty-six percent of learners thought they had difficulties in the aspect of fluency.
Regarding the type of feedback, most subjects would like to get feedback on vocabulary, appropriate expression, pronunciation, and suggestion (Table 3.5).
Table 3.5 Types of feedback
Frequency Percentage (%)
Vocabulary 7 64
Appropriate Expression 5 45
Pronunciation 5 45 Suggestion 5 45
Grammar Correction 3 27
Correction 3 27
Fluency 2 18
Intonation 2 18
Responses to the Content 1 9
Organizing Ability 1 9
Note. N (number of subjects) =11; F= the number of subjects
About sixty-four percent of subjects hoped that they could gain feedback on vocabulary. About forty-five percent of subjects hoped that the researcher could give them the feedback on appropriate expression, pronunciation, and suggestion respectively. Judged from the three tables, the subjects’ most apparent concern was vocabulary. In other words, enhancing the ability of vocabulary use in their speaking had been their immediate appeal.
In sum, judged from the literature findings and the analysis of five-point likert scale, “adding information,” “suggesting,” “supporting,” “probing,” and “correction”
were included in the feedback every time. Besides, with the comparison of analysis of the five-point likert scale and the open-ended questionnaire, the findings indicated that the subjects were eager to improve the command of vocabulary use and hoped to get more appropriate ways of expression. Fluency was also proved to be one of the most important aspects that needed emphasizing. The aspect of grammar also deserved our attention. How to give the types of “adding information,”
“suggesting,” “supporting,” and “probing” has been introduced in Section 3.2.2.3.1.
Next, the way to provide feedback on improving “vocabulary” and “more appropriate ways of expression” “fluency,” “grammar,” and “pronunciation” will be exemplified.
When listening to the subjects’ oral journals, the researcher took notes of as many errors as possible. When the subjects’ way of expression was obviously far from the correct one, the more appropriate expressions were provided. For example, I suggested “There is a time difference of 6 hours between Taiwan and Europe” rather than “Taiwan and Europe have the jet lag of six hours.” Another example is that I offered the correct expression, “We have been traveling for three days” to replace “we have continued for three days.” As for vocabulary, an example is: “The correct word is “electronic dictionary,” not “electric dictionary.” Other examples are: “You said,
‘it is full much cloud in the sky.’ You may simply say ‘it has been cloudy recently’”
and “You can use the term ‘mentally retarded’ to describe ‘喜憨兒.’” ”With regard to fluency, examples were given to the subjects such as “I found that you often get stuck in certain points where you don’t know what to say next. So, I suggest that you strengthen your organization to make it more fluent and coherent. Of course, it is not easy to do so, but you still need to figure out the way you think useful to improve on that. For example, before you start to speak, you can roughly organize your ideas into several points that you will mention in your talk. Otherwise, when you speak, it is easy to lose the focus and don’t know what to say next.” Another
example is “Since you pause quite often in your speaking, I suggest you pause between sentences, rather than within sentences. In this way, the audience can comprehend more quickly and clearly.” Regarding grammar, for “After I listening to my recording, I know I often pause for a long time,” I suggested, “you may say ‘after listening to my recording, I know…’ or ‘after I listen to my recording, I know….’”
As for pronunciation, I pointed out their errors and provided subjects with correct pronunciation so that they could feel the differences between their own pronunciation and the correct one. For instance, “I think you kind of confuse [r] and [l]. For example, you pronounced ‘play’ very similar to ‘pray.’ ‘Spelling,’ not ‘spraying.’”
3.2.3.2 Proficiency test
The General English Proficiency Test (GEPT) high-intermediate speaking test was adopted as a pre-test to evaluate the subjects’ entry level. In brief, the GEPT, developed by the Language Training & Testing Center (LTTC) in 1999, aims to promote the idea of life-long learning and to encourage the study of English.
Because of the fairness and reliability of this test, it has been selected by government agencies, many universities and private organizations to measure English proficiency.
This test has been chosen by the National Police Administration to test foreign affairs police candidates, by the Ministry of Education to examine applicants for government scholarships for overseas study, and by the Judicial Yuan to examine applicants for positions as notary public (LTTC, 2002). Besides, more and more universities have selected the GEPT for graduation English proficiency test including National Taiwan University, National Sun Yat-sen University, and Tatung University. This test is administrated at five levels, Elementary, Intermediate, High-intermediate, Advanced, and Superior, and includes listening, reading, writing, and speaking components.
Each level includes two stages. After passing the first stage including listening and reading, the testee can proceed to the second stage including writing and speaking.
There are several reasons to adopt the GEPT high-intermediate speaking test as the pre-test and post-test in this study. Firstly, the English ability of those who pass this level is roughly equivalent to that of university graduates in Taiwan whose major is not English. They are assumed to be capable of using English to express their opinions on common social occasions and at working sites. Presently the subjects in this study are sophomores and juniors, so they may regard taking this test as a warm-up exercise and view passing the test as a goal to achieve in the future.
Second, the test has high fairness and reliability in Taiwan as stated above. Third, the holistic scoring is suitable for the evaluation of overall speaking proficiency in this study. It includes pronunciation, intonation, vocabulary, grammar, comprehensibility, appropriateness, and fluency.
3.2.3.3 Speaking learning log
In order to make a research sturdy and reliable, triangulation is indispensable.
Data triangulation is the most common type among it. Qualitative researchers Marshall and Rossman (1989) defined “data triangulation” as “the act of bringing more than one source of data to bear on a single point” (p. 146). In light of their suggestions, another way of assessment – speaking learning log – was included.
This evaluation offered subjects with an opportunity to self-examine their speaking performance, to reflect the speaking process, and to contemplate which aspects of speaking should be improved and what efforts to make during the rest of the time. In the mid and end of the project, the subjects had to fill out the speaking learning log designed by the researcher. Items checked include confidence, fluency, grammatical accuracy, vocabulary and pronunciation. After listening to their own tapes, they not only checked the appropriate statements but also explained their reasons on this learning log.
3.2.3.4 Interview
A structured interview administered after the project was finished attempted to find out several things. A structured interview refers to “a situation in which an interviewer asks each respondent a series of preestablished questions with a limited set of response categories” (Fontana & Frey, 1998, p. 52). While most of the questions are structured, several open-ended questions are included at the beginning to explore their thoughts and experiences. One purpose of conducting the interview was to explore the subjects’ perceptions and reactions toward the project of keeping the oral-written dialogue journals. Still, another purpose was to investigate in which aspects of speaking the subjects considered they made improvement, especially in fluency, grammatical accuracy and vocabulary. Another purpose was to explore the role of the researcher’s written feedback in contributing to their speaking learning process. Finally, their observations on any flaws of this project and their suggestions for improvement were investigated.
3.2.3.5 Objective measurement
In order to obtain the objective evidence, the researcher decided to analyze the oral journals at entry, mid, and final stages of the research. The first and second oral journals in the first week were selected for the representation of subjects’ entry speaking performance. The thirteenth and fourteenth entries were chosen for data analysis at mid stage. The last two tape entries (25th and 26th) served as the final speaking performance. These entries were transcribed orthographically (see Appendix I for Grace’s 1st oral journal) for analyses of fluency, grammatical accuracy and vocabulary richness. How to conduct the analyses is presented in the next section.
3.3 The Coding Principles
In order to make clear the concepts of overall speaking proficiency and fluency,
fluency will be defined first, followed by an introduction of objective measurements of fluency, grammatical accuracy and vocabulary.
3.3.1 Definition of fluency
To measure fluency, firstly it is necessary to clarify the concept of fluency in the present study. When defining fluency, dictionaries provide a general consensus.
Longman Dictionary of Contemporary English defines “fluent” as “(1) able to speak a language very well; (2) speaking, writing, or playing a musical instrument confidently and without long pauses” (1995, p. 539). The New Oxford Dictionary of English defines fluency as “(of a person) able to express oneself easily and articulately
“ (1998, p. 707). According to Collins English Dictionary, fluency is “the quality or the state of being fluent” and fluent is defined as “(1) someone who is fluent in a particular language, or who speaks fluent Spanish, French, Russian, etc can speak or write the language easily and correctly, with no hesitation or inaccuracy. (2) someone whose speech, reading, or writing is fluent speaks, reads, or writes easily, smoothly and clearly with no hesitation or mistakes” (1987, p. 555). In short, fluency or fluent is the ability to speak easily, smoothly, articulately, confidently and correctly and without hesitation. Based on Longman Dictionary of Language Teaching & Applied Linguistics (1998, p. 178), in second and foreign language teaching, fluency which describes a level of proficiency in communication, includes:
(a) the ability to produce written and/or spoken language with ease
(b) the ability to speak with a good but not necessarily perfect command of intonation, vocabulary, and grammar
(c) the ability to communicate ideas effectively
(d) the ability to produce continuous speech without causing comprehension difficulties or a breakdown of communication.
It seems that these definitions only provide a vague and general concept of fluency or fluent, so a more precise and concrete definition that allows objective or quantifiable measurements is needed.
Fluency can be distinguished from the production perspective. Fillmore (1979) focused on the four qualities of fluency. The first kind of fluency is “the ability to talk at length with few pauses, the ability to fill time with talk” (p. 93). The speaker does not need to stop many times to think of what to say next. A second kind is “the ability to talk in coherent, reasoned, and ‘semantically dense’ sentence”, appearing to be a mastery of the semantic and syntactic resources of the language (p. 93). A third kind is “ the ability to have appropriate things to say in a wide range of contexts” (p.
93). A fourth kind is “the ability some people have to be creative and imaginative in their language use, to express their ideas in novel ways…” (p. 93). These definitions describe fluency in a broad manner.
Viewed as a performance phenomenon, fluency is defined by Lennon (1990) and Schmidt (1992) in a narrow sense. Lennon (1990) regarded fluency as one important element of oral proficiency, different from other elements such as idiomatic expressions, appropriateness, lexical range and syntactic complexity. Fluent speech can be characterized by the fact that “the psycholinguistic processes of speech planning and speech production are functioning easily and efficiently” (p. 391).
Meanwhile, Schmidt (1992) defined fluency as a “primarily temporal phenomenon”
and stated that “fluency in speech production is automatic procedural skill” (p. 358).
One can encode a given intention effortlessly, easily, and quickly. Furthermore, Chambers (1997) divided research into the qualitative and quantitative approaches to fluency to clarify the notion of fluency. Temporal variables in speech production appear to serve as not only a performance descriptor for oral assessment but also an indicator of progress in speech performance. It was suggested that using temporal variables in speech production analysis can contribute to a more precise definition of fluency. Meanwhile, Wood (2001) explored the phenomenon of second language speech fluency and how it may be facilitated through instruction. Since fluency was
defined in a narrow sense in Wood’s study, an overview of research on fluency presented mainly focused on the temporal variables in speech, such as rate or speed of delivery, pauses and length of fluent speech runs between pauses. In short, these studies revealed the importance of temporal variables in speech which would help not only clarify the notion of fluency but also contribute to the pedagogical implications.
As can be seen above, literature findings show that fluency can be defined in either broad or narrow sense. In this study, fluency was examined from a narrow perspective, rather than from a broad view because besides overall English speaking proficiency, the researcher attempted to explore whether the subjects could speak English more easily and quickly through this activity. Therefore, fluency was emphasized as a performance phenomenon and assessed by measuring a variety of temporal variables, such as speech rate, length of pauses, frequency of pauses and repetitions. In this sense, fluency would lend itself better to a quantitative approach, yielding more objective results.
3.3.2 Objective measurements of fluency
The followings will review several important literature findings, which present various measurements of spoken fluency.
Temporal variables and dysfluency markers have been used with various populations and for different purposes. Some studies employed these variables to compare speaking of different languages, speaking between native and non-native speakers as well as speaking between fluent and non-fluent groups. Raupach’s (1980) study of 5 German and 5 French students was an attempt to compare the German and French native language performance, their native language (L1) and their second language (L2) performance, and the pause profiles of two individual speakers. The temporal variables selected to measure the speech performance included the speech rate (number of syllables per minute), percentage of silent pauses time over total time,
articulation rate (number of syllables spoken per second excluding pause time), the length of runs (the average number of syllables between two pauses), length of silent pauses, the percentage of the hesitation phenomena including silent pauses, filled pauses, drawls, repetitions, and false starts. It was suggested that the temporal variables help determine different degrees of fluency.
In Ryuichi’s (1982) study, among the four factors (words per minute, percentage of hesitation pauses in the total time of speaking, mean length of hesitation pauses and number of sentences per minute), words per minute and percentage of hesitation pauses were found highly correlated with the native speakers’ impressions of fluency.
In addition, among the four aspects of speaking ability, i.e. grammar, vocabulary, pronunciation, and fluency, fluency scale was found to be the most integrative of the four when these are evaluated impressionistically by native speakers.
Temple (2000) analyzed speaking performance by calculating the speech rate, silence ratio (the percentage of total speaking time spent in silent pauses), pause rate (the number of filled and silent pauses per 100 syllables), repair rate (including false starts, incomplete words, as well as corrections or reformulations) and error rate (any deviant form, including both slips of the tongue and errors due to a lack of knowledge). The data showed highly significant differences between the native speakers and learners. The differences lay in error rate and pause rate, while the least discriminative variable was repair rate.
Riggenbach (1991) addressed what fluency is and what comprises fluency. The features chosen to measure the speech performance were hesitation phenomena (filled and unfilled pauses), repair phenomena (repetitions, restarts), rate (number of words/
semantic units per minute) and amount of speech (number of words/ semantic units per minute), interactive phenomena, and interactive features. It was concluded that rate of speech and the number of unfilled pauses contribute to judgment of
nonfluency.
In addition, the temporal variables were used to examine oral fluency improvement over time. Lennon (1990) investigated a range of quantifiable performance features that might function as objective indicators of oral fluency.
Twelve measures were assembled based on two broad approaches, temporal elements and dysfluency markers. For these measures, a cut-off point of 0.2 seconds was taken for a pause. Three variables were identified as being significant indices of improvement in English: words per minute [after pruning], filled pauses per T-unit and percent of T-units followed by pause [filled and unfilled]. It was noteworthy that self-correction appeared to be a very poor fluency indicator because it showed increase in three out of four subjects instead of showing decrease. Lennon explained
“perhaps because certain sorts of self-correction, particularly those involving reformulation of discourse, do not make for perceived dysfluency at all, and…part of fluency development in the advanced learner may involve increased ability to reformulate, monitor, and self-correct production on line” (pp. 412-413).
Like Lennon, O’Connor (1988) viewed self-repairs as an indicator of interlanguage variation and change. This research results showed that the difference between the beginning and advanced speakers is not the number of repairs they made but lies in the types of repairs. These two studies revealed that the number of repairs is not a good indicator to distinguish the different extent of fluency. Hence, it will not be used as a tool of assessing fluency.
Freed (1995) selected seven variables to measure speech performance as well as to identify the attributes of fluency that distinguished the two groups of second language learners. These factors, primarily temporal features of speech and various dysfluency markers, included amount of speech, rate of speech, unfilled pauses, frequency of filled pauses, length of fluent speech runs, repairs including repetitions
of exact words, syllabus or phrases; reformulations/ false starts; corrections/
grammatical repair as well as clusters of dysfluencies. Concerning the unfilled pauses, silent pauses of 0.4 seconds or longer, not occurring at a clause boundary were coded. However, the dysfluent silent pauses were also coded if they were close to a full second and were seemingly not rhetorical or intentional in nature but they occurred at juncture boundaries. The analyses of factors of fluency revealed few statistically significant differences and rate of speech is the only fluency feature which yields a significant difference.
Lam’s (1994) report used quantitative approach to investigate three related aspects of oral fluency: (1)fluency improvement; (2)correlation between subjective judgments and objective counts; and (3)variation of fluency in different speech interactions. The results indicated that there were no significant improvement in terms of three quantitative variables suggested by Lennon (1990): the number of
“pruned” words per minute, the number of filled pauses per T-unit and the percentage of T-units followed by pauses after the 20-week full-time In-service course. Thus, the qualitative inquiry was proposed to explain repeated words, self-corrections, repair or reformulation. Additionally, pausal phenomenon might not sufficiently signify speakers’ expressive inability because it was possible that they just could not think of what to say next; therefore, positions of pauses need to be considered because perceived fluency could be influenced by different pause positions. Finally, it was confirmed that speaking rate can serve as a powerful indicator of oral fluency because subjective judgments and objective counts are found to be correlated.
Nation (1989) examined whether a fluency-related communicative activity enabled students to enhance speaking fluency. Rate of speaking and occurrence of hesitation were the two criteria used to assess speaking fluency. The rate of speaking with the number of words per minute, and occurrence of hesitation with the number of
repetitions, false starts per 100 words were examined. The results showed significant differences in fluency judged by the two fluency measures.
The correlation of quantitative data concerning hesitation phenomena of the speakers and the subjective judgments was investigated by Fayer & Krasinski (1995).
The hesitation phenomena were measured on the basis of six temporal criteria. The results showed that subjective judgments of nonnative speech were based not so much on speech rate or pause rate but on total pausing time, percentage of pause time, and particularly on the length of the longest pause in discourse.
It was found that the most frequent and valid variables used by these studies are rate of speech, the number of filled and unfilled pauses per 100 words, repetitions per 100 words, the length of fluent speech runs and the ratio of hesitation pauses in the total time of speaking. The present study, therefore, used them to assess oral fluency at entry, mid, and final stages of the research. The first variable, “rate of speech,”
with the measure of words per minute (after pruning) has proved to serve as a powerful indicator of oral fluency in many studies (Freed, 1995; Lennon, 1990; Lam, 1994; Nation, 1989; Raupach, 1980; Riggenbach, 1991; Ryuichi, 1982). Pruning refers to the exclusion of repetitions and self-corrections when counting the number of words. The second variable is “the number of filled and unfilled pauses per 100 words,” criterion employed in Riggenbach’s (1991), Freed’s (1995) studies or “filled and unfilled pauses per 100 syllables” in Temple’s (2000) study. The third variable is “repetitions/ per 100 words,” criterion used in Raupach’s (1980), Riggenbach’s (1991) and Nation’s (1989) studies. The fourth variable is “the length of fluent speech runs,” criterion used in Freed’s (1995), Lennon’s (1990), and Raupach’s (1980) studies by measuring the average number of words between two pauses. The fifth variable is “ratio of hesitation pauses in the total time of speaking” on the basis of percentage of hesitation pauses in Fayer & Jrasubski’s (1995), Ryuichi‘s (1982), and
Raupach’s (1980) studies.
3.3.3 Objective measurements of grammatical accuracy
Grammatical accuracy is another important focus in the current study, which is defined as accuracy in verb tense, prepositions, plural forms, and subject-verb agreement. On the basis of the results of questionnaire conducted before the experiment, errors of tense, prepositions, plural forms and subject-verb agreement were found to be the most serious errors. It was found that the combination percentage of “Fair,” “Serious,” and “Very serious” was very high in these four aspects. The percentage is 91 %, 91%. 100 %, and 73% respectively (see Table 3.2).
Thus, the four types of errors were chosen to measure the subjects’ grammatical accuracy over time. Following Lay’s (1991) definitions, errors of plural forms refer to “missing S in plural nouns,” and “adding S in words where they should be singular” (p. 56). Prepositional errors refer to “wrong prepositions used,” “missing preposition,” “two-word verbs incorrectly used” and “preposition intruder” (p. 57).
Errors of subject-verb agreement mean that verbs do not change in form from singular to plural or vice versa. Following Nation (1989)’s method by calculating the number of errors made per 100 words, grammatical accuracy was measured by counting errors of verb tense, prepositions, plural forms, and S-V agreement per 100 words, the same unit as that in measuring dysfluency markers (i.e. repetitions and pauses) in the present study.
3.3.4 Objective measurements of vocabulary
In order to measure whether the subjects had made improvement in vocabulary acquisition, the researcher used two measures of lexical richness to assess the vocabulary development. One was the ratio of different words (Types) to the total number of words (Tokens), known as type-token ratio (TTR) to measure vocabulary variation, and the other was VocabProfile analysis (Cobb, 2001). TTR, seemingly
the most widely used measure of lexical richness, has been described as a measure of language variation (Laufer, 1994; Laufer & Nation, 1995), “a measure of vocabulary
‘flexibility’ or variability,” (Johnson, 1944, p. 1), and a measure of “vocabulary richness” (Andolina, 1980, p. 373). A high figure means that the text contains a wide range of different words and a low one indicates that the writer or speaker has relied on a small amount of words that are frequently repeated. The figure is known to vary with text length. As Carroll (1964) stated, “This ratio will tend to decrease as sample size increases, other things being equal, because fewer and fewer of the words will not have occurred in the sample already counted” (p. 54). For example,
“the type-token ratio of a 500-word text is lower than that for a 300-word one” (Read, 2000, p. 201). While the type/token ratio distinguishes between the different words used in speaking or writing, it does not show the quality of different words used.
The VP analysis, however, can compensate for such inadequacy. Cobb’s (2001) VocabProfile (VP) which is available online and allows color as well as numeric visualization of output compares words in a text with words lists that accompany the program. It divides any text into four categories by word frequency including the most frequent 1000 words of English, the second most frequent thousand words of English, i.e. 1000 to 2000, the academic words of English, and the remainder which are not found on the other lists (Cobb, 2001). The lists are from West’s (1953) General Service List, which contains 2000 word families and the Academic Word List (AWL) consisted of 570 word families which occurred with high frequency and wide range in the academic corpus. Here, the most frequent words refer to the base forms of the words. Under each headword are its inflected and derived forms. Therefore, the most frequent 2000 words include far more than this number and so does the Academic Word List. These lists are mainly based on printed texts, but also have been used quite often to evaluate richness of spoken language (Donzelli, 2002; Meara,
1993; Meara, Lightbown, & Halter, 1997). Laufer & Nation’s (1995) study validated VP analysis a reliable and valid measure of lexical use in writing. The results showed that the VP analysis is reliable across two pieces of writing by the same person provided the topics are of general nature and require no expert knowledge of the particular subject matter. It also discriminates between learners of different proficiency levels as well as correlates with an independent measure of vocabulary knowledge.
As for research on evaluating lexical richness in speaking, Meara’s (1993) study analyzed the vocabulary richness of BBC English broadcast by using VP. No difference was found between the lexical profiles of easy program series and more difficult ones. Just over half the words came from the Nat1 list, the 1000 most frequent words in English. A further 10 % came from the Nat2 list, the second thousand most frequent words. Meanwhile, Meara et al. (1997) investigated whether classrooms can be characterized as rich lexical environment. VP was used to analyze the vocabulary in the speech of ten teachers in intensive communicative ESL classes for children. Findings showed that over half of the vocabulary offering across these classrooms consisted of basic items from the 0-1000 frequency level. It was concluded that classrooms as rich lexical environment cannot be conclusively proved. Another research using VP to evaluate richness of spoken language is Donzelli (2002), which examined the lexical richness of teacher talk in three different class-levels of EFL classes. The results suggested that the level of words difficulty in the teacher’s speaking was found to be equal in the different class-levels. These studies showed that VP analysis has been viewed as a useful instrument to analyze the spoken data. Another study using written corpora for oral vocabulary analysis is Brown, Sagers & LaPorte’s (1999) research. Brown et al.’s (1999) research on the examination of incidental vocabulary acquisition from oral and written dialogue
journals found that the texts that advanced university EFL learners produced had no significant difference in the level of the vocabulary in the two modes by using the Brown University Corpus, a written corpus for word frequency analysis.
Accordingly, VP analysis is considered an appropriate measure to analyze vocabulary richness.
The level of most of the subjects in this case was intermediate level, so it was assumed that they may use simple words to express their ideas. Besides, the data are spoken language, rather than written, so the chance of the words being used beyond the most frequent 1000 words becomes even less. Based on these reasons, in this study, the original four levels (the most frequent 1000 words of English, the second most frequent thousand words of English, i.e. 1001 to 2000, the AWL, and the remainder which are not found on the other lists) were divided into two levels, one is basic vocabulary including the most frequent 1000 words and the other is non-basic vocabulary including the words beyond the 1000 words including the second most frequent 1000 words, the AWL and the words not found on the other lists. The oral journals at the entry (the 1st & 2nd journals), mid (the 13th & 14th journals), and end (the 25th & 26th journals) stages of the project were analyzed with the two measures.
To perform the VP analysis, the oral journals were transcribed and entered into the computer program for calculation. Because every time for the same subject, his or her utterances had different lengths, the present study following Laufer’s (1991) method by taking everyone’s least production length for analysis. Take one of the students, Sheree as an example, the total number of words she spoke in the 1st, 2nd, 13th, 14th, 25th, and 26th oral journals are 387, 302, 392, 390, 432, 459 respectively.
In order to make the calculation reliable and consistent, only the first 302 words for each oral journal were selected. Finally, comparisons of means (F-test) on the journals at entry, mid, and end stages were carried out between the percentages of
words at the two levels.
To sum up, the measurements in this present study were numerous. For fluency, the five variables were chosen including the rate of speech, the number of filled and unfilled pauses per 100 words, repetitions per 100 words, the length of fluent speech runs and the ratio of hesitation pauses in the total time of speaking. As for grammatical accuracy, errors of verb tense, prepositions, plural forms and subject-verb agreement were calculated for analyses. In terms of vocabulary, two measurements of vocabulary richness (i.e. TTR and VocabProfile analysis) were used to analyze the subjects’ oral journals.