R E S E A R C H
Open Access
Changes in the magnitude of social inequality in
the uptake of cervical cancer screening in Taiwan,
a country implementing a population-based
organized screening program
Shu-Ti Chiou
1,2, Chien-Yuan Wu
1, Baai-Shyun Hurng
1and Tsung-Hsueh Lu
3*Abstract
Introduction: We sought to examine changes in the magnitude of social inequality in the uptake of cervical cancer screening between 2001 and 2009 in Taiwan.
Methods: We used data from the 2001 and 2009 Taiwan National Health Interview Surveys to calculate the absolute (slope of index of inequality, SII) and relative (relative index of inequality, RII) summary measures of social inequality in the uptake of Pap smear tests to indicate the magnitude of social inequality.
Results: The prevalence of having had a Pap smear during the previous 3 years increased in each age and socioeconomic group from 2001 to 2009. The SII and RII by urbanization and education level decreased
significantly, while the SII and RII by income level increased significantly between the two study years. The largest increase in inequality of prevalence from 2001 to 2009 was between women living in suburban and rural areas with highest income level and women live in metropolitan areas with lowest income level.
Conclusions: The changes in magnitude of social inequality in the uptake of cervical cancer screening differed by indicators of socioeconomic position. Further studies are needed to explore the mechanisms that result in social inequality by different indicators of socioeconomic position.
Keywords: Mass screening, National Health Interview Survey, Socio-economic factors, Uterine cervical neoplasm Introduction
Studies using nationally-representative survey data have demonstrated prominent social inequality in the re-ported use of cervical cancer screening [1-13]. In most countries, women in a higher socioeconomic position have higher rates of Pap smear test uptake than their counterparts in a lower socioeconomic position. How-ever, according to a review, very few studies directly compare the trends in socioeconomic inequality in the uptake of cervical cancer screening [14]. An inter-national comparison study further indicated that the magnitude of social inequality in the prevalence of the uptake of cervical cancer screening is lower in countries implementing a population-based organized screening
program [11]. Nevertheless, little is known regarding the changes in the magnitude of social inequality in a coun-try implementing population-based organized screening program in an Asian country. In this study, we examine changes in the magnitude of social inequality in the reported uptake of cervical cancer screening between 2001 and 2009 in Taiwan, a country that has been imple-menting population-based organized screening program since 1995.
Methods
Organized screening program in Taiwan
According to the definition proposed by Miles et al., the cervical screening program in Taiwan is an organized system [15]. The National Cervical Cancer Screening Registry was established in 1995 to help public health nurses to identify women who should be invited for a
* Correspondence:[email protected]
3Institute of Public Health, National Cheng Kung University, Tainan, Taiwan
Full list of author information is available at the end of the article
© 2014 Chiou et al.; licensee BioMed Central Ltd. This is an open access article distributed under the terms of the Creative Commons Attribution License (http://creativecommons.org/licenses/by/2.0), which permits unrestricted use, distribution, and reproduction in any medium, provided the original work is properly cited.
Pap smear and to monitor whether any screening-detected abnormalities have been followed-up and treated [16,17]. However, one limitation of the National Cervical Cancer Screening Registry is that there is no personal information on socioeconomic position; therefore we have to use the National Health Interview Survey datasets to examine the relationship between socioeconomic position and preva-lence of Pap smear usage.
National Health Interview Survey in Taiwan
The National Health Interview Survey is a nationally-representative survey of the total population of Taiwan conducted by the Bureau of Health Promotion every four years. A multistage stratified systematic sampling design following the principle of probability proportional to size was applied in both the 2001 and 2009 surveys. Data were collected by face-to-face interview [18]. The response rate was 93.8% (25,464/27,160) in the 2001 survey and 84.0% (25,636/30,528) in the 2009 survey. One possible explanation of the difference in response rate between 2001 and 2009 is that the unit of sampling in 2001 was by household and in 2009 it was by indivi-dual person.
Variables
The dependent variable was having had a Pap smear during the previous 3 years, which was determined by
the question: “In what year and month did you have a
Pap smear, if ever?” The independent variables included age and three indicators of the respondent’s socioeco-nomic position: residential urbanization level, educational level, and monthly household income. The definitions of variables are illustrated in Table 1.
Analysis
The prevalence of having had a Pap smear in the previ-ous 3 years was calculated by age and three indicators of socioeconomic position. We then examined the correla-tions (Cramer’s V coefficient) among variables, and used the variation inflation factor (VIF) to address the con-cern of colinearity between covariates. The adjusted odds ratio (aOR) of having had a Pap smear in the previ-ous 3 years for women in each socioeconomic group compared with women in a reference group was com-puted according to multivariate logistic regression. We also examined the interactions between different inde-pendent variables in predicting the outcome. For vari-ables with significant interaction effects, we further stratified the variables and computed the aOR for strati-fied categories.
Measure of inequality
Because we used indicators of socioeconomic position with hierarchical order (urbanization, education and
income level), we were able to use regression-based measures of social inequality [19]. The slope index of in-equality (SII) is the linear regression coefficient which represents the relation between the frequencies of health behavior (i.e., undertaking a Pap smear in this study) in each socioeconomic category and the hierarchical Table 1 Definitions of variables
Variable Definition Dependent variable
Pap smear If the respondent received Pap smear in the previous 3 years; yes = 1, otherwise = 0 Independent variables
Age
30-39 If the respondent’s age is in 30–39 years; yes = 1, otherwise = 0 (reference group) 40-49 If the respondent’s age is in 40–49 years;
yes = 1, otherwise = 0
50-59 If the respondent’s age is in 50–59 years; yes = 1, otherwise = 0
60-69 If the respondent’s age is in 60–89 years; yes = 1, otherwise = 0
Urbanization level
Metropolitan If the respondent’s resident place is in Taipei City or Kaohsiung City; yes = 1, otherwise = 0 (reference group) Urban If the respondent’s resident place is in
Cities other than Taipei City or Kaohsiung City; yes = 1, otherwise = 0
Suburban If the respondent’s resident place is in “Zhen” (township); yes = 1, otherwise = 0 Rural If the respondent’s resident place is in
“Xiang” (village); yes = 1, otherwise = 0 Educational level
Primary or lower If the respondent’s highest education level is primary school or lower; yes = 1, otherwise = 0 (reference group)
Secondary If the respondent’s highest education level is junior high school; yes = 1, otherwise = 0 High school If the respondent’s highest education level is senior high school; yes = 1, otherwise = 0 College or university If the respondent’s highest education level is college or university; yes = 1, otherwise = 0 Graduate school If the respondent’s highest education level
is graduate school; yes = 1, otherwise = 0 Household monthly income (NT dollars)
≤29,999 If the respondent’s reported income is ≤29,999; yes = 1, otherwise = 0 (reference group) 30,000–49,999 If the respondent’s reported income is
30,000–49,999; yes = 1, otherwise = 0 50,000–69,999 If the respondent’s reported income is
50,000–69,999; yes = 1, otherwise = 0 70,000–99,999 If the respondent’s reported income is
70,000–99,999; yes = 1, otherwise = 0 ≥100,000 If the respondent’s reported income is
ranking of each category on the social scale [20]. The SII can be interpreted as the absolute change in frequency of health behavior when one goes from the lowest level in the social hierarchy to the highest level.
Because SII is an absolute measure, it is sensitive to changes in the mean frequency of health behaviors of population. If the mean frequency of health behavior in-creases in the same proportion in all the socioeconomic categories, the SII will increase, whereas the relative dif-ferences remain constant. One alterative that has been proposed is the relative index of inequality (RII), which can be estimated by dividing the predicted value of the regression at the highest point by the predicted value of the regression at the next highest point. The RII is fre-quently calculated by logistic regression at the lowest point. After the logistic transformation of the dependent variable, the exponent of the regression coefficient rep-resents the RII [20].
Here is a simple example to help readers better under-stand the implication of SII and RII. Suppose the preva-lence of taking Pap smear for low, middle, and high socioeconomic positions were 60%, 65% and 70%, re-spectively. In this example, there was a 5% point of increase in prevalence from low socioeconomic position to the adjacent higher socioeconomic position, the SII would be around 0.08 (5/60) and the RII would be around 1.08 (65/60 or 70/65).
As the main concern of this study was to examine changes in the magnitude of social inequality between 2001 and 2009, we pooled data from both years and in-cluded an interaction term between SII, RII, aOR and survey year in the model.
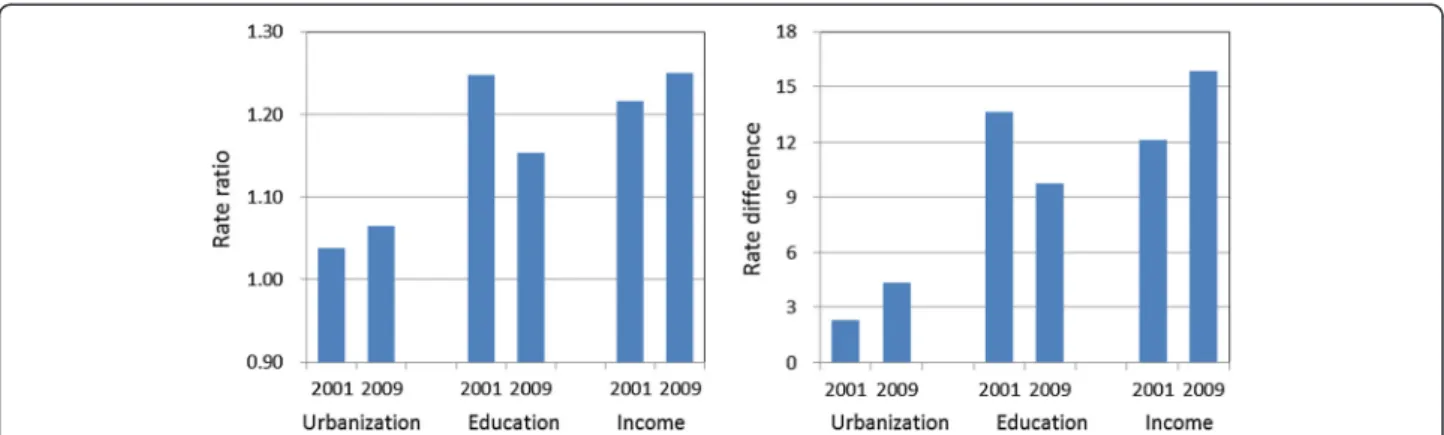
As Martens pointed out, the use of relative rates, rela-tive risks, or odds ratios can actually be detrimental to furthering political actions. In the realm of policy, show-ing the rates by socioeconomic group on absolute differ-ences may be better understood intuitively [21]. Thus, we presented changes in both rate ratio and rate difference between 2001 and 2009 by three indicators socioeconomic position to see if there were different implications for policy decision makers.
Results
Women aged 30–69 years who had not had a hysterec-tomy were included in this study, with a total of 5,704 women for the year 2001 and 6,420 women in 2009. Table 2 presents the demographic and socioeconomic characteris-tics of the respondents. A higher percentage of women aged 50–59 years was noted in 2009 compared with those in 2001 (25% vs. 19%). The distributions of respondents by urbanization level and household income in 2001 were similar to those in 2009. However, fewer respondents re-ported monthly income in 2009. We also found that the 2009 respondents had higher education levels.
The overall prevalence of undertaking a Pap smear was 62% in 2001 and increased to 69% in 2009 (Table 3). The increase in prevalence was different between age group and was more prominent for elder woman; thus in the groups of 50–59 and 60–69 year-olds, the increase between years was by 10%. The increase of prevalence between 2001 and 2009 was less prominent in women living in metropolitan areas (an increase from 63% to 67%), compared with those in suburban areas (an in-crease from 63% to 71%), and rural areas (from 63% to 72%). Similarly, women with highest education level and highest household income group showed lowest magni-tude of increase in prevalence between the two years (from 66% to 69% for the highest education level and from 68% to 75% for the highest income group). Note-worthy women with university or graduate education level had lower prevalence rate (69% in 2009) than those with high school education level (73%).
Table 4 shows correlation matrix among variables in 2001 and 2009. Although the four independent variables were significantly correlated with each other, the VIF for all variables are less than 2, so the threat of colinearity between variables was not so significant (data not shown). We therefore put all variables into the final multivariate logistic regression model. A significant interaction term between urbanization and income were noted, we thus stratified urbanization and income into five categories in the final multivariate regression model.
The results of final multivariate logistic regression model are presented in Table 5. The SII and RII by age moderately increased from 2001 to 2009, and the main increase occurred in women aged 50 years and above. The SII and RII by urbanization level were, respectively, 0.18 (95% CI 0.01-0.27) and 1.20 (95% CI 1.10-1.31) in 2001, and significantly decreased to 0.13 (95% CI 0.04-0.21) and 1.14 (95% CI 1.04-1.24) in 2009 according to the examination of interaction term between urbanization and year. People living in rural areas showed the most promin-ent decrease in magnitude of inequality, as shown by the aOR which was 1.87 (95% CI 1.38-2.54) in 2001 and decreased to 1.33 (95% CI 1.02-1.74).
With regard to education level, SII and RII were, re-spectively, 0.14 (95% CI 0.07-0.21) and 1.15 (95% CI 1.08-1.23) in 2001; and significantly decreased to <0.001
(95% CI −0.07-0.08) and 1.00 (95% CI 0.93-1.08) in
2009. The magnitude of decrease in aOR was most prominent among women with a secondary educational level (from 1.63 to 1.23) and women with a high school education level (from 1.68 to 1.32).
In terms of household monthly income, the SII and RII were, respectively, 0.15 (95% CI 0.09-0.22) and 1.16 (95% CI 1.09-1.24) in 2001. These significantly increased to 0.21 (95% CI−0.14-0.28) and 1.24 (95% CI 1.16-1.32) in 2009. The increase in inequality was mainly confined
to people with monthly income of 70,000-99,999. The aOR of this group was 1.65 in 2001 and increased 2.06 in 2009. Stratified analysis further suggested that the inequality in prevalence between women who live in suburban and rural areas with highest income level com-pared with women live in metropolitan areas with lowest income level showed the most significant increase in inequality between years: the aOR was 0.31 (95% CI 0.20-0.50) in 2001 and increased to 1.03 (95% CI 0.64-1.65) in 2009.
Figure 1 illustrates changes in both rate ratio and rate difference in the uptake of Pap smear tests by the three socioeconomic variables. The pattern of change accord-ing to rate ratio and rate difference was similar.
Discussion
The findings of this study suggest that the overall preva-lence of cervical cancer screening uptake increased from 2001 to 2009. However, we observed mixed results
regarding the changes in relationship between socioeco-nomic position and the uptake of Pap smear tests. While the magnitude of social inequality by urbanization and education level decreased, the magnitude of social inequal-ity by income level increased. Specifically, the greatest increase of inequality between 2001 and 2009 in screening prevalence occurred between women living in suburban and rural areas with highest income level and women living in metropolitan areas with lowest income level.
A review study that examined the impact of interven-tions to improve attendance in female cancer screening among lower socioeconomic groups concluded that while organized population screening programs are suc-cessful in increasing overall participation rates, they may not necessarily be able to substantially reduce social in-equalities [14]. We found the following two studies that specifically examined changes in the magnitude of social inequality in the uptake of cancer screening practices conducted since the publication of that review [22,23]. Table 2 Demographic and socioeconomic characteristics of women respondents, 2001 and 2009 Taiwan National Interview Survey
2001 2009
N % N %
Total 5,704 100.0 6,420 100.0
Age group (years)
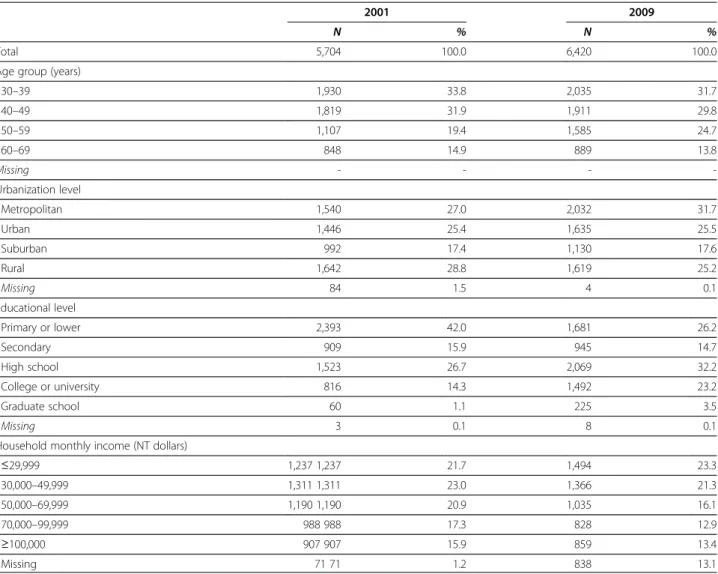
30–39 1,930 33.8 2,035 31.7 40–49 1,819 31.9 1,911 29.8 50–59 1,107 19.4 1,585 24.7 60–69 848 14.9 889 13.8 Missing - - - -Urbanization level Metropolitan 1,540 27.0 2,032 31.7 Urban 1,446 25.4 1,635 25.5 Suburban 992 17.4 1,130 17.6 Rural 1,642 28.8 1,619 25.2 Missing 84 1.5 4 0.1 Educational level Primary or lower 2,393 42.0 1,681 26.2 Secondary 909 15.9 945 14.7 High school 1,523 26.7 2,069 32.2 College or university 816 14.3 1,492 23.2 Graduate school 60 1.1 225 3.5 Missing 3 0.1 8 0.1
Household monthly income (NT dollars)
≤29,999 1,237 1,237 21.7 1,494 23.3 30,000–49,999 1,311 1,311 23.0 1,366 21.3 50,000–69,999 1,190 1,190 20.9 1,035 16.1 70,000–99,999 988 988 17.3 828 12.9 ≥100,000 907 907 15.9 859 13.4 Missing 71 71 1.2 838 13.1
An organized breast cancer screening program was im-plemented in 2001 in Belgium. The prevalence of mam-mography use in women aged 50–69 years increased from 2001 to 2004; however, the RII by education level also increased [22]. In Korea, the magnitude of social in-equality by education level in undertaking gastric cancer
screening decreased from 2005 to 2009, but the magni-tude of social inequality by income increased [23].
Our findings in Taiwan are similar to those in Korea: we found a decrease in magnitude of social inequality by education level and an increase in magnitude of social inequality by income level. The most often cited Table 3 Number and prevalence (%) of women who underwent a Pap smear in the previous 3 years by age and socioeconomic position, 2001 and 2009 Taiwan National Interview Survey
2001 2009 p-value
n % n %
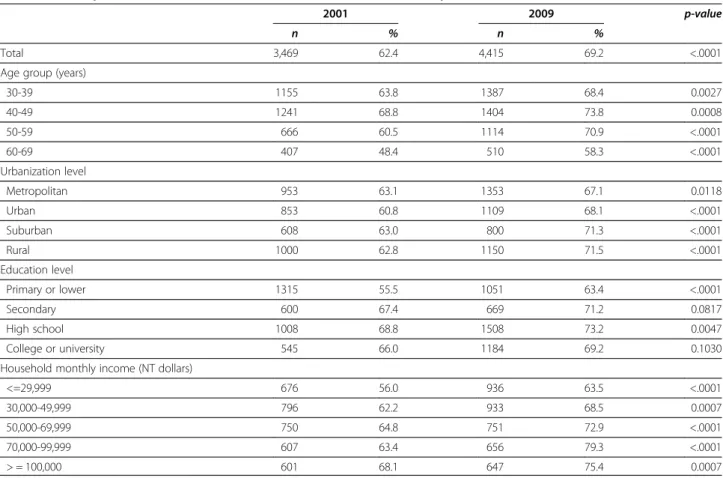
Total 3,469 62.4 4,415 69.2 <.0001 Age group (years)
30-39 1155 63.8 1387 68.4 0.0027 40-49 1241 68.8 1404 73.8 0.0008 50-59 666 60.5 1114 70.9 <.0001 60-69 407 48.4 510 58.3 <.0001 Urbanization level Metropolitan 953 63.1 1353 67.1 0.0118 Urban 853 60.8 1109 68.1 <.0001 Suburban 608 63.0 800 71.3 <.0001 Rural 1000 62.8 1150 71.5 <.0001 Education level Primary or lower 1315 55.5 1051 63.4 <.0001 Secondary 600 67.4 669 71.2 0.0817 High school 1008 68.8 1508 73.2 0.0047 College or university 545 66.0 1184 69.2 0.1030 Household monthly income (NT dollars)
<=29,999 676 56.0 936 63.5 <.0001 30,000-49,999 796 62.2 933 68.5 0.0007 50,000-69,999 750 64.8 751 72.9 <.0001 70,000-99,999 607 63.4 656 79.3 <.0001 > = 100,000 601 68.1 647 75.4 0.0007
Table 4 Correlations (Cramer’s V Coefficient) among variables related to the uptake of Pap smear in Taiwan National Interview Survey
Uptake_2001 Age_2001 Urbanization_2001 Education_2001 Income_2001 Uptake_2001 – 0.1378*** 0.0199 0.1264*** 0.0817*** Age_2001 – 0.0551*** 0.3430*** 0.1146*** Urbanization_2001 – 0.1761*** 0.1270***
Education_2001 – 0.2052***
Income_2001 –
Age_2009 Urbanization_2009 Education_2009 Income_2009 Uptake_2009 – 0.1052*** 0.0420* 0.0821*** 0.1214*** Age_2009 – 0.0391** 0.3841*** 0.1703*** Urbanization_2009 – 0.1203*** 0.1121*** Education_2009 – 0.3061*** Income_2009 – ***p value < .0001. **p value < .001. *p value < .05.
hypothesis is the “inverse equity hypothesis” proposed by Victora, which suggests that effective new interven-tions will initially reach those of a higher socioeconomic position and will only later filter down to those of poorer status [24]. Inequalities in coverage, morbidity, and mor-tality therefore increase first and then reduced later after lower socioeconomic class have goo access to the inter-vention. If this hypothesis applies for cervical cancer
screenings in Taiwan between the years of 2001 and 2009, it implies that the availability of screening is still limited to those with greater incomes. Yet this inequality is not likely due to financial barriers because the Bureau of Health Promotion covers the fee for Pap smear exam-ination in all medical settings under the National Health Insurance scheme (which has been in place since 1995). The findings of this study also suggest that there were Table 5 Adjusted odds ratios (aOR), relative index of inequality (RII) and slope index of inequality (SII) of having had a Pap smear in the previous three years by age and socioeconomic position, 2001 and 2009 Taiwan National Health Interview Survey
2001 2009 p value for interactions with years aOR 95% CI aOR 95% CI
Age group (years)
30-39 1.00 1.00 40-49 1.46 (1.26–1.70) 1.33 (1.14–1.55) <.0001 50–59 1.15 (0.95–1.38) 1.32 (1.10–1.59) 0.1413 60–69 0.79 (0.64–0.97) 0.83 (0.66–1.05) 0.0272 SII −0.08 (−0.14––0.01) 0.01 (−0.07–0.08) 0.0257 RII 0.93 (0.87–0.99) 1.01 (0.94–1.08) 0.0257 Urbanization level Metropolitan 1.00 1.00 Urban 1.23 (0.84–1.79) 0.71 (0.52–0.98) 0.3422 Suburban 1.75 (1.27–2.42) 1.20 (0.91–1.59) 0.0185 Rural 1.87 (1.38–2.54) 1.33 (1.02–1.74) 0.0015 SII 0.18 (0.10–0.27) 0.13 (0.04–0.21) 0.0001 RII 1.20 (1.10–1.31) 1.14 (1.04–1.24) 0.0001 Education level Primary or lower 1.00 1.00 Secondary 1.63 (1.36–1.96) 1.23 (0.99–1.51) <.0001 High school 1.68 (1.41–1.99) 1.32 (1.09–1.61) <.0001 College or university 1.38 (1.12–1.70) 1.00 (0.80–1.25) 0.0012 SII 0.14 (0.07–0.21) 0.00 (−0.07–0.08) <.0001 RII 1.15 (1.08–1.23) 1.00 (0.93–1.08) <.0001 Household monthly income (NT dollars)
<=29,999 1.00 1.00 30,000–49,999 1.57 (1.16–2.13) 1.08 (0.83–1.42) 0.0659 50,000–69,999 1.71 (1.25–2.32) 1.34 (1.01–1.79) 0.0130 70,000–99,999 1.65 (1.21–2.26) 2.06 (1.52–2.79) 0.0333 > = 100,000 3.06 (2.10–4.45) 1.80 (1.29–2.52) <.0001 SII 0.15 (0.09–0.22) 0.21 (0.14–0.28) <.0001 RII 1.16 (1.09–1.24) 1.24 (1.16–1.32) <.0001 Urbanization*Income Metropolitan, <=29,999 1.00 1.00 Urban, 30,000–99,999 0.78 (0.51–1.19) 1.53 (1.05–2.23) 0.3309 Urban, > = 100,000 0.55 (0.32–0.94) 1.32 (0.82–2.14) 0.5982 Suburban & rural, 30,000–99,999 0.68 (0.48–0.96) 1.03 (0.75–1.42) 0.2475 Suburban & rural, > = 100,000 0.31 (0.20–0.50) 1.03 (0.64–1.65) 0.0005
interaction effects between urbanization and income level. Further studies are needed to explore the possible mechanisms resulting in the increase in magnitude of social inequality by income level.
The findings of this study further suggest that different indicators of socioeconomic position show alternate pic-tures of changes in magnitude of social inequality. The magnitude of social inequality as shown by urbanization level in both study years was smaller than those based on education and income level differences. One possible explanation was the launch of outreach community-based multiple disease screening program in many rural areas in some cities/counties, which resulted in the in-crease of prevalence cervical cancer screening [25]. The multiple disease screening program used the Pap smear screening program as a base to integrate other screening regimens encompassing four other neoplastic diseases (liver, breast, colon and oral cancer) and three chronic diseases (hypertension, hyperlipidemia, hyperglycemia). The physicians and public health nurses would outreach to many rural areas in which the screening rates were relatively low.
The decrease in magnitude of social inequality by edu-cation level was mainly due to the prominent increase in prevalence of the uptake of cervical cancer screening among women with primary or lower education level. This, again, may have been due to the launch of community-based, multiple disease screening outreach program in many rural areas. One evaluation study indi-cated that the outreach programs are most beneficial to elderly, widowed and less-educated women in rural areas [26]. This would also help explain why there was such a large increase of prevalence of screening in the older populations between years as well. As the demographic characteristics of respondents in 2009 were older and with higher education level than those in 2001, which would be one possible explanation of decrease in the magnitude of social inequality by educational level, as
women with the highest education level have lower prevalence rate. The multiple disease screening program is a kind of intervention targeting socioeconomic disad-vantages, which could effectively tackle the social in-equality in health [27].
Several limitations are worthy of note. First, similar to other studies using National Health Interview Survey datasets, that there might be some recall bias in the self-reporting of the uptake of Pap smear screening. How-ever, as the main objective of this study was to compare the social inequality in the uptake of Pap smear between 2001 and 2009, it is very unlikely that the recall bias changed markedly between the two study years. Another limitation was we could not obtain three waves of data for comparison (the interim 2005 National Health Inter-view Survey cervical cancer screening questions were not comparable). The third limitation was the higher non-respondent rate and missing rate in providing in-come information in 2009 wave, which would affect the interpretations of the results.
Conclusion
We conclude that despite the increase in the prevalence of the uptake of cervical cancer screening between 2001 and 2009, the changes in magnitude of social inequality in the uptake of cervical cancer screening differed by in-dicators of socioeconomic position. Further studies are needed to explore the different mechanisms resulting in social inequality by different indicator of socioeconomic position.
Competing interests
All authors declared no competing interests.
Authors’ contributions
STC initiated the idea and supervised the process of study. STC and THL participated in the study design and literature review. All authors participated in the interpretation of the results and critically review the manuscript. All authors read and approved the final manuscript. Figure 1 Changes in magnitude of social inequality (rate ratio versus rate difference) in the uptake of Pap smear between 2001 and 2009 according to Taiwan National Health Interview Survey.
Acknowledgements
This study is based on data from the National Health Interview Survey provided by the Bureau of Health Promotion, Department of Health, Executive Yuan. The interpretation and conclusions contained herein do not represent those of Bureau of Health Promotion, Department of Health, Executive Yuan. We thank Shi-Liang Wu, Chi-Shiang Chung and Ye-Hsun Wu for help in data analysis.
Funding
The authors received no financial support for the research, authorship, and/or publication of this article.
Author details
1Health Promotion Administration, Ministry of Health and Welfare, Taipei,
Taiwan.2Institute of Public Health, National Yang-Ming University, Taipei,
Taiwan.3Institute of Public Health, National Cheng Kung University, Tainan,
Taiwan.
Received: 10 June 2013 Accepted: 17 December 2013 Published: 9 January 2014
References
1. Rohlfs I, Borrell C, Pasarín MI, Plaséncia A: The role of sociodemographic factors in preventive practices: the case of cervical and breast cancer. Eur J Public Health 1999, 9:278–284.
2. Sambamoorthi U, McAlpine DD: Racial, ethnic, socioeconomic, and access disparities in the use of preventive services among women. Prev Med 2003, 37:475–484.
3. Adams EK, Florence CS, Thorpe KE, Becker ER, Joski PJ: Preventive care: female cancer screen, 1996–2000. Am J Prev Med 2003, 25:301–307. 4. Baker D, Middleton E: Cervical screening and health inequality in England
in the 1990s. J Epidemiol Community Health 2003, 57:417–423. 5. Hewitt M, Devesa SS, Breen N: Cervical cancer screening among U.S.
Women: analyses of the 2000 National Health Interview Survey. Prev Med 2004, 39:270–278.
6. Sutton S, Rutherford C: Sociodemographic and attitudinal correlates of cervical screening uptake in a national sample of women in Britain. Soc Sci Med 2005, 61:2460–2465.
7. Sabates R, Feinstein L: The role of education in the uptake of preventive health care: the case of cervical screening in Britain. Soc Sci Med 2006, 62:2998–3010.
8. Cabeza E, Esteva M, Pujol A, Thomas V, Sánchez-Contador C: Social disparities in breast and cervical cancer preventive practices. Eur J Cancer Prev 2007, 16:372–379.
9. Moser K, Patnick J, Beral V: Inequalities in reported use of breast and cervical screening in Great Britain: analysis of cross sectional survey data. BMJ 2009, 338:b2025.
10. Garrido-Cumbrera M, Borrell C, Palència L, et al: Social class inequalities in the utilization of health care and preventive services in Spain, a country with a national health system. Int J Health Serv 2010, 40:525–542. 11. Palència L, Espelt A, Rodríguez-Sanz M, et al: Socio-economic inequalities
in breast and cervical cancer screening practices in Europe: influence of the type of screening program. Int J Epidemiol 2010, 39:757–765. 12. Park MJ, Park EC, Choi KS, Jun JK, Lee HY: Sociodemographic gradients in
breast and cervical cancer screening in Korea: the Korean National Cancer Screening Survey (KNCSS), 2005–2009. BMC Cancer 2011, 11:257. 13. Damiani G, Federico B, Basso D, et al: Socioeconomic disparities in the
uptake of breast and cervical cancer screening in Italy: a cross sectional study. BMC Public Health 2012, 12:99.
14. Spadea T, Bellini S, Kunst A, Stirbu I, Costa G: The impact of interventions to improve attendance in female cancer screening among lower socioeconomic groups: a review. Prev Med 2010, 50:159–164. 15. Miles A, Cockburn J, Smith RA, Wardle J: A perspective from countries
using organized screening programs. Cancer 2004, 101:1201–1213. 16. Koong SL, Yen AMF, Chen THH: Efficacy and cost-effectiveness of
nationwide cervical cancer screening in Taiwan. J Med Screen 2006, 13:S44–S47.
17. Chen YY, You SL, Chen CA, et al: Effectiveness of national cervical cancer screening programme in Taiwan: 12-year experiences. Br J Cancer 2009, 101:174–177.
18. Health Promotion Administration, Ministry of Health & Welfare: Taiwan national health interview survey introduction. Accessed Sep 8, 2013 at https://olap.hpa. gov.tw/en_US/Search/02_ListSummary.aspx?menu=100000000008&mode=1. 19. Harper S, Lynch J: Measuring health inequalities. In Methods in Social
Epidemiology. Edited by Oakes JM, Kaufman JS. San Francisco, CA: Jossey-Bass; 2006:134–168.
20. Regidor E: Measures of health inequalities: part 2. J Epidemiol Community Health 2004, 58:900–903.
21. Martens PJ: The right kind of evidence—integrating, measuring, and making it count in health equity research. J Urban Health 2012, 89:925–936. 22. Puddu M, Demarest S, Tafforeau J: Does a national screening programme reduce socioeconomic inequalities in mammography use? Int J Public Health 2009, 54:61–68.
23. Lee HY, Park EC, Jun JK, Hahm MI, Jung KW, Kim YJ, Han MA, Choi KS: Trends in socioeconomic disparities in organized and opportunistic gastric cancer screening in Korea (2005–2009). Cancer Epidemiol Biomarkers Prev 2010, 19:1919–1926.
24. Victora CG, Vaughan JP, Barros FC, Silva AC, Tomasi E: Explaining trends in inequality: evidence from Brazil child health studies. Lancet 2000, 356:1093–1098.
25. Chen THH, Chiu YH, Luh DL, et al: Community-based multiple screening model: design, implementation, and analysis of 42,387 participants. Cancer 2004, 100:1734–1743.
26. Chang HC, Hsiung HY, Chen SI, Yen AMF, Chen THH: Comparison of a community outreach service with opportunity screening for cervical cancer using Pap smears. J Public Health 2007, 29:165–172.
27. Mackenbach JP, Stronks K: The development of a strategy for tackling health inequalities in the Netherlands. Int J Equity Health 2004, 3:11.
doi:10.1186/1475-9276-13-4
Cite this article as: Chiou et al.: Changes in the magnitude of social inequality in the uptake of cervical cancer screening in Taiwan, a country implementing a population-based organized screening program. International Journal for Equity in Health 2014 13:4.
Submit your next manuscript to BioMed Central and take full advantage of:
• Convenient online submission
• Thorough peer review
• No space constraints or color figure charges
• Immediate publication on acceptance
• Inclusion in PubMed, CAS, Scopus and Google Scholar
• Research which is freely available for redistribution
Submit your manuscript at www.biomedcentral.com/submit