國立臺灣大學管理學院資訊管理學系 碩士論文
Department of Information Management College of Management
National Taiwan University Master Thesis
QR Code 風格化之研究 Artistic QR Code Embellishment
林奕杉 Yi-Shan Lin
指導教授:陳炳宇 博士 Advisor: Bing-Yu Chen, Ph.D.
中華民國 102 年 6 月
June, 2013
致 致 致謝 謝 謝
時光飛逝,一下子就走過了碩士班兩年。這兩年過去雖然不覺得自
己有變得多厲害,但是過程中學了很多東西、經歷了三次投稿,覺得
非常充實。而整個碩士論文能從無到有,除了自身能夠獲得成就感之 外,更需要感謝許多人在過程中的幫忙。
首先要感謝的是我的指導教授;陳炳宇老師,沒有老師我就不會進 來這個實驗室,也不會接觸到圖學,更不會在過程中遇到那麼多幫助 我的人們。 接著,要謝謝一起合作過的阿山和心怡。 謝謝心怡在我懵
懵懂懂時帶我進入研究,你總是很有耐心地帶著我一步步學習,同時
也謝謝你每次在我各種芝麻綠豆小事上給我很多意見。 謝謝阿山讓我
更了解什麼是研究,謝謝你帶著我一次次發現新問題、嘗試新方法並
一起度過兩次投稿的時光,要不是有你在,我恐怕沒自信可以堅持到 最後。
謝謝一起為碩論努力的芊雯和筱青、一起打球的大家及實驗室裡的
其他夥伴。一直很慶幸自己能夠認識大家,有人可以和自己一起承擔
碩論的壓力、活動身心及聊天打屁,這兩年才可以這麼順利地走過。
謝謝一路上在我身邊的老朋友,劉大魷、李辰葭、許鴻英、李臉
臉、王懷賢、翁姑娘、麵超。謝謝你們一直以來包容我的任性、在實 驗室沒冷氣時讓我寄居、失落時給我鼓勵。
最後想謝謝cmlab,有了這兩年的訓練,讓我成長許多。
林奕杉 于 通訊與多媒體實驗室 2012/07/11
ii
中 中 中文 文 文摘 摘 摘要 要 要
QR Code 是一種能夠將資訊編碼的二維條碼。一個標準的QR
Code只由黑色和白色的正方形組成,在外觀上並不具有特色。 因此,
在這篇論文提出了一個裝飾 QR Code 的架構,藉由此架構使 QR Code 得以更引人注目的方式呈現、並盡所能保有 QR Code 的可讀性。
此架構主要是由藝術家所設計的 QR Code 得到啟發,根據觀察,
藝術家通常會在 QR Code 中插入圖片以及風格化原本的黑白方形。 風
格化以參照二元化的範例圖形來重新塑型原有的正方形,使得其局部 外觀能與範例圖型相似的方式來達成。 而關於插入圖片的部分,則更 提出對插入的圖片進行編碼感知變形 (code-awawre warping) 的技術來 降低插入圖片所造成的編碼錯誤、增高可讀的機率。 相較於從前的方 法對整張圖做全域性的轉換,此演算法針對圖片做局部變形去逼近周
遭編碼的顏色分布。
最後以一系列市面上可獲得的 QR Code 辨識軟體以及理想上可讀 性的數據來檢驗大量所裝飾的 QR Code 來驗證此篇論文的結果。
關 關
關鍵鍵鍵字字字: QR code 風格化、QR code、編碼感知變形、形狀合成、模組 風格化。
iii
Abstract
QR code is a kind of two dimensional barcode that encodes information.
A standard QR code contains only regular black and white squares, and thus is not so attractive. In this paper, we propose a novel framework for embel- lishing a standard QR code, so that the embellished QR code is attractive and recognizable for human when printed on any broadcasting media while mini- mizing its distance from standard QR code. The proposed method is inspired by artistic works, where a QR code is usually embellished by stylizing the square codes and embedding images. In this framework, the regular square codes are reshaped by referring a binary examplar, so that their local appear- ances resemble the example shape. In addition, we propose an error-aware warping technique for deforming the embedded image, so that the error of the QR code caused by the image embedding is minimized to increase the QR code’s readability. Compared to previous global transformation techniques, the algorithm allows for lower data error because the warping is able to lo- cally deform the embedding image to adapt the squares surrounding it. This framework has been examined by embellishing an extensive set of QR codes and testing the readability with several commercial QR code readers.
Keywords: QR code stylization, QR code, code-aware image warping, shape synthesis, module stylization.
iv
Table of Contents
Abstract iv
List of Figures vi
Chapter 1 Introduction 1
1.1 Introduction of QR Code . . . 1
1.2 Motivation of Decorating QR Code . . . 1
1.3 Challenges of Decorating QR Code . . . 2
1.4 Proposed Method . . . 3
1.5 Contribution and Thesis Organization . . . 3
Chapter 2 QR Code Symbol Configuration 5 2.1 QR Code Version . . . 5
2.2 QR Code Structure . . . 6
2.2.1 Function Pattern . . . 6
2.2.2 Encoding Region . . . 7
2.3 Generation of QR code . . . 8
Chapter 3 Related Work 11 3.1 QR Code Decoration . . . 11
3.2 Warping-based Image Deformation . . . 14
3.3 Patch-based Image Synthesis . . . 15 v
TABLE OF CONTENTS vi
Chapter 4 Framework of Embellishing QR Code 17
Chapter 5 Code-aware Image Warping 20
5.1 QR code error energy . . . 21
5.2 Shape distortion energy . . . 23
5.3 Smoothness energy . . . 24
5.4 Scale energy . . . 24
5.5 Total energy and optimization . . . 24
Chapter 6 Module Stylization 27 6.1 Similarity distance . . . 28
6.2 Boundary construction . . . 29
6.2.1 Boundary patch matching . . . 30
6.2.2 Boundary modification . . . 31
Chapter 7 Results 36 7.1 Comparison with Previous Methods . . . 41
7.2 Performance . . . 42
7.3 Discussion and Limitation . . . 44
Chapter 8 Conclusion 49
Bibliography 51
List of Figures
1.1 Artistic decorated QR codes. (a) Louis Vuitton’s decorated QR code de- signed by Takashi Murakami. (b) The QR code of DiscoverLosAnge-
les.com. . . 4
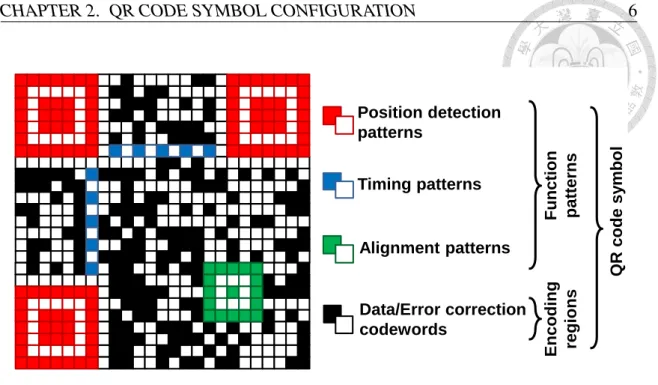
2.1 The QR code configuration. . . 6
2.2 The QR code mask patterns. . . 9
3.1 Exmaples of directly overlaying images on QR code [24]. . . 12
3.2 Exmaples of placing images in padding regions from [5]. . . 12
3.3 Exmaples of RS code modification. (a) A result of [16]. (b) A result of [35] which strongly reduce the noise generated from (a). . . 13
3.4 Applications of content-preserve warping. (a) Resizing using content- preserve warping [32] . (b) Using content-preserve warping to rectify the fish-eye effect [11]. (c) Using content-preserve warping to adjust the perspective effect [10]. . . 14
vii
LIST OF FIGURES viii
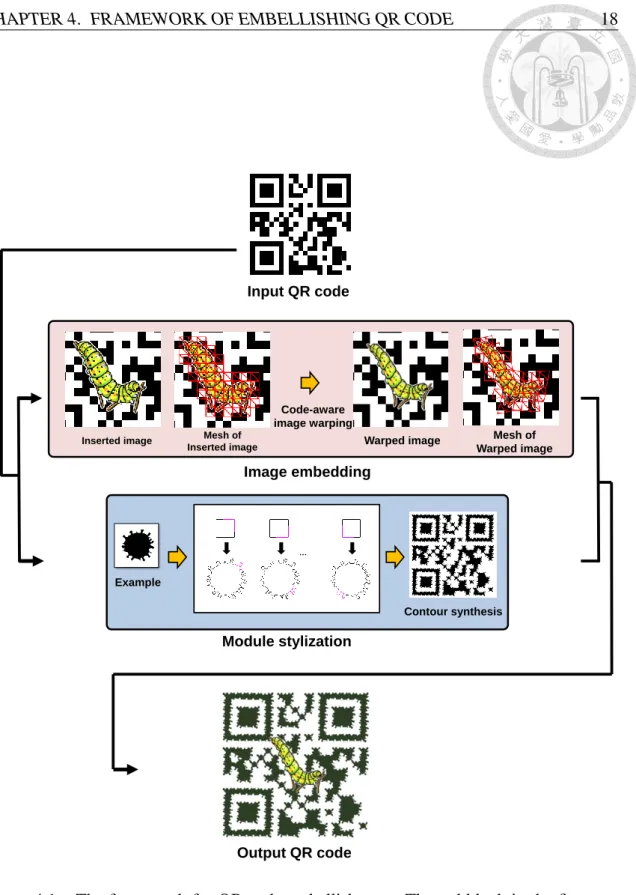
4.1 The framework for QR code embellishment. The red block in the first row shows that we use code-aware image warping to reduce the error caused by inserting a image, and the blue block in the second row denote how module stylization works. . . 18
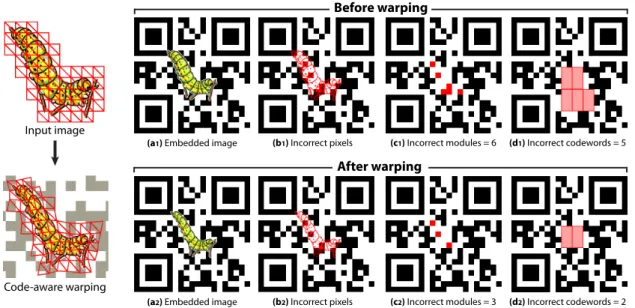
5.1 An example of code-aware warping. After the warping, both the de- stroyed modules and codewords are effectively reduced. The red regions in (b1)(b2),(c1)(c2), and (d1)(d2) indicate the incorrect pixels, modules, and codewords, respectively. . . 20
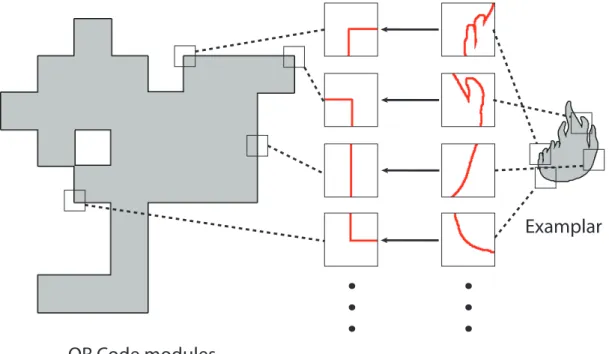
6.1 Assignment of boundary local patches. The examplar boundary patches (right) are assigned to the QR code boundary patches (left). . . 27 6.2 An illustration of boundary patch similarity metric. The computation of
the similarity between two boundary patches N (pm) and N (pe) is the sum of average per-pixel distances from a patch to the other. . . 30
6.3 A comparison of the effect of label using. (a) uses the label control, (b) does not. As a result, the different side of the contour pixels of (a) have the features of the relative part of the examplar, while (b) does not have this effect. . . 31 6.4 An illustration of concatenating matched patches on a horizontal bound-
ary to form the vector representation of the modified boundary. . . 33
LIST OF FIGURES ix
6.5 A comparison of synthesized results using different values of λ . The bigger value of λ cause the contour pixels to be more restricted to the shape of original contour. . . 35
7.1 Demonstration of imposing a huge distortion weight on a special region which should not be deformed too much. The blue meshes in the right figure denote the region with a huge weight of distortion. The image is obtained from [3]. . . 36 7.2 Some results generated with our framework. These two cases are using
examplars that are directional. The upper input image is obtained from [2]. . . 37 7.3 Some results generated with our framework. These two cases show that
scaling may strongly reduce the caused QR code error. The input images are obtained from [6] and [1]. . . 38
7.4 Some results generated with our framework. Upper image deformed glob- ally, and bottom image deformed locally. The input images are obtained from [7] and [3]. . . 39 7.5 Comparison with a previous method [23]. (a) A result of the previous
method which which shifts and rotates the inserted image. (b) A result of our method with no global transformation and slight distortion. . . 41
LIST OF FIGURES x
7.6 Comparison with a previous method [35]. (a) A result of previous method which adopted non-systematic encoding method to form the result QR code. (b) A result of our method which would not reduce the input image resolution but would slightly deform the input image. . . 42 7.7 Comparison of using three different error levels or not on the same input
image [4]. The images on the left column texture show the incorrect pixels, modules, and codewords from top to bottom, respectively. (a) The result of optimizing with all three error levels. (b) The result of optimizing only with the pixel-level error. . . 43 7.8 We randomly tested 30 different weights of combination and plotted the
percentage of incorrect codewords before and after the optimization in the chart. The left and right red bars are the ranges of the percentage of incor- rect codewords before and after the optimization, respectively. The red dotted lines denote the error percentage that each level can tolerate, and the black straight lines that cross the red bars denote the average values. . 46
List of Tables
7.1 The statistics of detection rate from different viewing angle. The first and second rows are the detection rate for embellished and original QR codes, respectively. . . 46 7.2 The statistics of error when embedding an image into the QR code. The
“error correction level” is the error capability the user chose when gen- erating the QR code. The “original error rate” and the “reduced error rate” are the error rates before and after the optimization, respectively. In each cell, the upper, middle, and lower values indicate the percentage of incorrect codewords, modules, and pixels, respectively. The “detection rate” is the success rate of using nine different kinds of QR code readers physically. . . 47
7.3 The statistics of error when styling the QR codes. In each cell, the upper, middle, and lower values indicate the percentage of incorrect codewords, modules, and pixels, respectively. . . 48
xi
Chapter 1 Introduction
1.1 Introduction of QR Code
QR code (abbreviation for Quick Response Code) is a kind of two-dimensional bar- codes that encode information. Originally invented in Japan by the Denso Wave Corpo- ration in 1994 and then internationally standardized [18], QR Code is now popular and widely used due to its low-cost creation, large storage capacity, and instant readability.
Smartphone users can easily obtain the decoded information by using built-in cameras with QR code readers to read the QR codes shown on any broadcasting material like mag- azines or monitors. Because of its quick and effortless access of information, QR code has also become a popular advertising strategy for companies or brands to do marketing;
it enables customers to access their websites more easily.
1.2 Motivation of Decorating QR Code
Although QR codes are proliferating everywhere, they are designed to be recognized by machines only. With only pixelated black and white squares contained in a standard
1
CHAPTER 1. INTRODUCTION 2
QR code, the information encoded in the QR code cannot be understand by people with- out any QR code reader. Moreover, it is not eye-catching and representative while be- ing printed or displayed on advertising media like business cards, posters, or billboards.
Therefore, some designers have decorated QR codes to make them attractive and recog- nizable to people without decreasing their readability. These decorated QR codes come in colors (other than black and white) or shapes (other than squares), and they may have texts or images embedded. For instance, Louis Vuitton’s decorated QR code (Figure 1.1(a)) designed by Takashi Murakami features violet color, round codes, a panda, and its logo;
Figure 1.1(b) shows another decorated QR code of DiscoverLosAngeles.com.
1.3 Challenges of Decorating QR Code
Embellishing a QR code is much more challenging than generating a standard one, be- cause the process may destroy the information encoded in it. Fortunately, a certain level of data loss and error of a QR code is tolerated or even can be corrected, so decorating the QR code usually utilizes the error tolerance and correction property. Therefore, to embel- lish a QR code, professional artists usually undergo an iterative trial-and-error process, in which each time the visual elements of the QR code are modified, its readability should be examined. There are three major ways to make a QR code attractive and recognizable:
1. embedding images into the QR code.
2. stylizing the black and white squares.
3. coloring the code.
CHAPTER 1. INTRODUCTION 3
The goal is to assist these processes so that an QR code can be easily embellished.
1.4 Proposed Method
This paper proposes a novel framework for embellishing a QR code by embedding images and stylizing black and white square codes.
For image embedding, the proposed method adopts an error-aware warping technique to minimize the loss of QR code readability by locally deforming the embedded images.
The proposed locally deformation method is able to reduce more code error than existing global transformation methods. Different images can afford different levels of deforma- tions, for instance, it is better not to deform a company logo, while a cartoon image may be able to be freely deformed. We therefore allow users to adjust a global deformable parameter for the input image. For some images that are only partly deformable, the users can also specify the (un-)deformable regions by painting on the image.
For code stylization, the proposed method exploits an example-based boundary styl- ization technique to reshape the square codes while referring a binary examplar provided by users. It is achieved by a global optimization of the local boundary appearance. In addition, the QR code color can be optionally changed for better presentation.
1.5 Contribution and Thesis Organization
This method provides a semi-automatic solution for embellishing QR codes, and has been successfully applied to decorate a large number of embellished QR codes while encourage them to keep their readability as much as possible.
CHAPTER 1. INTRODUCTION 4
(a) (b)
Figure 1.1: Artistic decorated QR codes. (a) Louis Vuitton’s decorated QR code designed by Takashi Murakami. (b) The QR code of DiscoverLosAngeles.com.
The rest of this paper would be organized as follows. We will first introduce the QR Code configuration in Chapter 2. In this chapter, we will present the structure of QR code and give an overview of QR code generation. Then, reveal some related work in Chapter 3. After that, we will provide the framework of this paper (Chapter 4), and discuss the detail of the algorithm in Chapter 5 and 6. Finally, the results and discussions are shown in Chapter 7.
Chapter 2
QR Code Symbol Configuration
In this section, we discuss the configuration of a standard QR code symbol. For more details, please refer to [18].
2.1 QR Code Version
A QR code consists of a number of black and white squares, formally defined as modules, arranged in a grid pattern. Each module encodes a bit of data. A codeword is formed by combining eight neighboring modules together.
A QR code can be represented in the form: Version V− E, where V is the version number, and E indicates the error correction level. The QR code version can be cate- gorized into 40 versions, and it is usually decided according to the size of the encoded information. A QR code with version V= 1...40 contains (21+4×(V −1))2modules. As a result, the more information the higher version is needed. In addition, the QR code have 4 levels of error correction capabilities: L, M, Q, H, which allow for 7%, 15%, 25%, and 30% of error recoveries, respectively.
5
CHAPTER 2. QR CODE SYMBOL CONFIGURATION 6
Position detection patterns
Timing patterns
Alignment patterns
Data/Error correction codewords
Function patternsEncoding regions QR code symbol
Figure 2.1: The QR code configuration.
2.2 QR Code Structure
Figure 2.1 shows the QR code structure. The modules contained in a QR code can be separated into two categories: function patterns and encoding regions.
2.2.1 Function Pattern
The function patterns provide the functionalities for smartphones or cameras to rec- ognize a QR code, including:
• Position detection patterns
The position detection patterns can be divided into three parts which are located at upper-left, upper-right, and lower-left corners; They define the position of the QR code and enable rapid recognition of a QR code.
• Timing patterns
The timing patterns consist of interleaving black and white modules running be-
CHAPTER 2. QR CODE SYMBOL CONFIGURATION 7
tween any two of the position detection patterns. They allow for determining the version of the QR code and the coordinates of the modules.
• Alignment patterns
The alignment patterns are placed in the QR codes with V ≥ 2, and are used for correcting the QR code distortion. The higher version is used, the more alignment patterns are needed.
2.2.2 Encoding Region
The encoding region contains the modules representing data, error correction code- words, and the version and format information. With the help of self-error-correction ability, QR code is allowed to be damaged without loss of data, so it is possible to replace some data codewords with the decorating materials while maintaining the readability.
Note that QR code uses RS code for error correction, and the number of error correction codewords is determined by the version of the QR code and the error correction level of the QR code.
The version information encodes the version number into 18 bits, with 6 bits of data and 12 error correction bits, and only appears when V≥ 7. The format information con- tains the information of error correction level and the mask pattern used in the QR code with 5 bits of data and 10 error correction bits. The error correction bits of version in- formation and format information are both encoded by BCH code. In order to correctly decode the complete information of QR code, it is essential to have the right version and format information in advance. Due to this matter, version and format information are
CHAPTER 2. QR CODE SYMBOL CONFIGURATION 8
both placed twice in the QR code.
2.3 Generation of QR code
This section provides an overview of how to generate a QR code from input data.
There are 5 stages included: data analysis, data encodation, error correction encodation, codeword placement, and masking.
Step 1: Data Analysis
Analyze the input data and determine which encoding mode (e.g.numeric, alphanu- meric, 8-bit byte) to be used.
If the version of the QR code has not been specified, it would be determined with the information of data quantity and error correction level in this stage as well.
Typically, the smallest version that will accommodate the data would be chosen.
Step 2: Data Encodation
Transform the data into bit stream according to the encoding mode, and split the bit stream into codewords. If the number of encoding data codewords has not reached the required number of data codewords of the version, append padding codewords to the end of data codewords to form the complete data codeword sequence.
Step 3: Error Correction Encodation
First, separate the data codeword sequence into number of blocks that specified in [18]. Use error correction algorithm to generate error correction code for each block, and attach them at the end of data codeword sequence.
CHAPTER 2. QR CODE SYMBOL CONFIGURATION 9
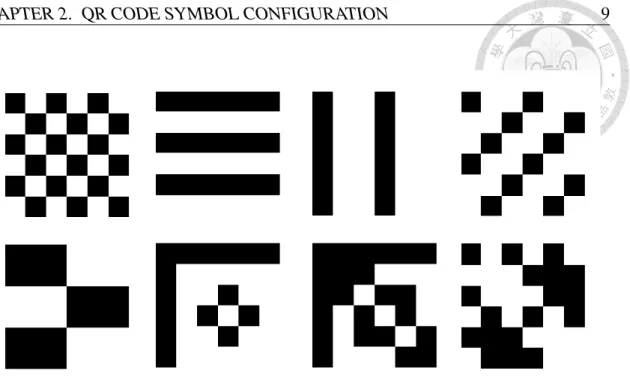
Figure 2.2: The QR code mask patterns.
As mentioned before, QR code uses RS code to detect and correct errors, and RS code is well known for its capability for correcting burst noises. With n codewords of total, k codewords of data, and n-k error correction codewords, RS code can correct up to t errors, where
t= ⌊n−k
2 ⌋. (2.1)
Step 4: Codeword Placement
Reassemble the data codewords and error correction codewords by take one code- word from each block in turn to form the final codeword sequence. Place the code- word sequence with other function patterns.
Step 5: Masking
In order to have accurate QR code information, having black and white modules in- terleaved with each other is preferable. And the function patterns should be avoided in encoding region as well. In this stage, for conditions above, apply a best mask
CHAPTER 2. QR CODE SYMBOL CONFIGURATION 10
pattern in encoding region (except the format and version information.) that would introduced the least undesired features with XOR operations. Figure 2.2 shows the 8 mask patterns.
Chapter 3
Related Work
3.1 QR Code Decoration
QR code decoration has attracted immense commercial attention for many years.
Some companies and websites even provide QR code customization services. Recently, many QR code decoration techniques were proposed [23, 24, 31, 30, 26, 16], which fo- cused on seeking the best position for embedded images to minimize the QR code error.
The methods of decorating QR codes can be classified into three categories: direct over- laying, padding region utilization, RS code modification.
• Direct Overlaying
This approach is to enhance the readability of directly overlaying an image on spec- ified position of the QR code. Ono et al. [23, 24] introduced techniques for finding a better position for images and facial photos on QR codes, as show in Figure 3.1.
Samretwit and Wakahara [26] studied the best position for placing images with dif- ferent scales. This approach regards the input images as error and highly depends on the error correction capability to correct the information. Therefore, it is sensi-
11
CHAPTER 3. RELATED WORK 12
tive to error correction level, and higher level would be used.
(a) (b)
Figure 3.1: Exmaples of directly overlaying images on QR code [24].
(a) (b)
Figure 3.2: Exmaples of placing images in padding regions from [5].
• Padding Region Utilization
This approach is to encode the images into padding bits between the data and ECC (error checking and correcting) sections which do not contain the encoded message and thus can be modified freely [31, 30, 5] as Figure 3.2. Note that Wakahara and Yamamoto [31, 30] also studies that the space size of the padding region is determined by the quantity of encoded information, the version of the QR code,
CHAPTER 3. RELATED WORK 13
and the error correction level of the QR code. As a result, the selection of version of and the error correction level of QR code will affect the result as well.
• RS Code Modification
This approach [16] is to incorporate the non-systematic encoding of Reed-Solomon (RS) codewords. Given k codewords of data out of n total codewords. It randomly search k words to assign specific value with it, and solve the linear system to de- termine the values of the rest of n-k codewords. This approach allows for freely embedding an image into the QR code without sacrificing the error correction ca- pability. In order to overcome the noise that [16] would generate, [35] took image saliency into consideration to provide a more noise-avoid result. However, these methods would reduce the resolution of the embedded image. The results of the two methods are shown in Figure 3.3.
Figure 3.3: Exmaples of RS code modification. (a) A result of [16]. (b) A result of [35]
which strongly reduce the noise generated from (a).
CHAPTER 3. RELATED WORK 14
3.2 Warping-based Image Deformation
To have high-quality deformations, warping-based manipulation techniques has been extensively studied. Igarashi et al. [17] introduced as-rigid-as-possible approach to achieve shape deformation while minimizing the distortion of the shape. In order to accelerate the optimization, Schaefer et al. [27] further proposed moving least square techniques to compute the deformed result. Weber and Gotsman [33] proposed controllable con- formal maps to avoid ”foldovers” of the image. Jacobson [19] introduced new types of control handles to improve the controllability of image deformation. Content-preserve warping has been used in different image editing applications as shown in Figure 3.4.
Wang et al. [32] utilize significance map to guide the content-aware resizing process, where the significance map combines the gradient and saliency information. The more significant the quad is the less distortion applies. Liu and Jin [22] use camera motion and static scene points to guide spatially-varying warp to achieve video stabilization. Carrol et al.[11] utilize content-preserving warping to rectify distortion of wide-angle images.
Carrol et al. [10] further proposed methods to control perspective by optimizing the warp so that straight line can remain straight after adjustment.
(a) (b) (c)
Figure 3.4: Applications of content-preserve warping. (a) Resizing using content- preserve warping [32] . (b) Using content-preserve warping to rectify the fish-eye effect [11]. (c) Using content-preserve warping to adjust the perspective effect [10].
CHAPTER 3. RELATED WORK 15
For our application, code-aware warping is used to reduce errors caused by embedded images. In order to have better control of the distortion error caused by code-aware warp- ing, user can adjust the distortion weight to manage the extent of the distortion for each inserted image.
3.3 Patch-based Image Synthesis
Patch-based synthesis [14, 34, 8, 21, 15] generate result in units of patches. To be more specifically, the input texture example image is divided into patches, and the patches are copied into the output image. In order to maintain the coherence of neighboring pix- els in the result image, these methods first randomly chose the left-top patch in the output image, and synthesize the result image in a raster scan order. The synthesis detail is de- scribed as follows: For each location in the output image, they search for the most similar patch in the input image, and patches must meet the overlap constraint. And in every overlap region, they need to find a minimum cut to define the boundary of each patch, and the newly searched patch is pasted according to the minimum cut. The result image is generated by repeating the steps above until the result image is fully filled. Kwatra et al.[20] later combined pixel-based and patch-based methods and proposed a EM-like algorithm to optimize the result image.
Many different image editing applications [29, 13, 12, 9, 28, 25] have used the patch- based techniques. Image inpainting and completion used the patch-based approaches frequently, the unwanted regions would be filled by the patches in the remaining region of the image. Simakov et al. [28] introduce the concept of coherence and completeness to
CHAPTER 3. RELATED WORK 16
summarize visual data. Completeness indicates that the target visual data should represent all the visual data in source, and coherence inversely indicates that the source visual data contained all patches of target visual data. Rosenberger et al. citeRosenberger:2009:LSS also used the patch-based approach and the concept of coherence and completeness to synthesize the shape of binary image.
Our module stylization was inspired by patch-based synthesis approaches. In addition, in order to maintain the readability of stylized module, we develop a new approach to control the difference between the stylized result and the input QR code module.
Chapter 4
Framework of Embellishing QR Code
This section describes the technical details of QR code embellishment framework that enables us for semi-automatically embellishing a standard QR code. The main goals of the proposed framework are twofold:
1. It deforms the embedded images so that the caused QR code error can be reduced.
According to the color distribution of embbedd images.
2. The modules is stylized according to a given example image while maintaining the readability of the QR code.
To achieve the above goals, we design a framework which has two main components:
image embeddingand QR code stylization as illustrated in Figure 4.1.
The image embedding component (Chapter 5) deforms the input image to reduce the caused QR code error. Based upon the observation that many of the input images can be slightly deformed, we develop a code-aware image warping method to locally deform the input image so that the QR code error can be minimized. To achieve this, we divide the input image into a triangular mesh, and compute the optimal deformed mesh on the
17
CHAPTER 4. FRAMEWORK OF EMBELLISHING QR CODE 18
Output QR code
Example
Contour synthesis
Module stylization
‧‧‧
Image embedding
Code-aware image warping
Inserted image Mesh of
Inserted image Warped image Mesh of
Warped image
Input QR code
Figure 4.1: The framework for QR code embellishment. The red block in the first row shows that we use code-aware image warping to reduce the error caused by inserting a image, and the blue block in the second row denote how module stylization works.
CHAPTER 4. FRAMEWORK OF EMBELLISHING QR CODE 19
QR code symbol. Compared to the global transformation (i.e., translation, scaling, and rotation), the proposed local deformation method can reduce more QR code error.
The module stylization component (Chapter 6) reshapes the modules according to an input shape example. Specifically, our goal of this component is to synthesize new shapes for the modules so that they can resemble with the style example, and we achieve this by developing a 1D-window synthesis approach.
Finally, we let users to determine the color of the modules, and the chosen color could apply individually or globally according to user preferences.
Chapter 5
Code-aware Image Warping
Our code-aware image warping method locally deforms the input image so that the QR code error can be effectively reduced and the local structure of the image can be maintained.
Figure 5.1 demonstrates an example of the code-aware warping. We first divide the
Code-aware warping Input image
Before warping
After warping
(a1) Embedded image
(a2) Embedded image
(b1) Incorrect pixels
(b2) Incorrect pixels
(c1) Incorrect modules = 6
(c2) Incorrect modules = 3
(d1) Incorrect codewords = 5
(d2) Incorrect codewords = 2
Figure 5.1: An example of code-aware warping. After the warping, both the destroyed modules and codewords are effectively reduced. The red regions in (b1)(b2),(c1)(c2), and (d1)(d2) indicate the incorrect pixels, modules, and codewords, respectively.
20
CHAPTER 5. CODE-AWARE IMAGE WARPING 21
input image I into an uniform triangular mesh G= (V,E,T), where V, E, and T denote the sets of vertices, edges, and triangular faces, respectively. We further discard the triangles which do not cover the image content for reducing the problem dimension.
Let vi= (xi, yi) ∈ V denote the initial position of a vertex, the image warping moves the vertex to v′i= (x′i, y′i) ∈ V′ to form a deformed mesh. To achieve this, a set of energy terms is defined for encouraging an ideal warp, including QR code error energy, shape distortion energy, smoothness energy, and scale energy. These energy terms are then combined and solved as a nonlinear least-squares energy minimization problem.
5.1 QR code error energy
Embedding images into a QR code causes the reduction of the QR code readability because parts of the modules (or even the codewords) are altered. Therefore, we devise the QR code error energy to measure the error caused by the embedded image, which consists of three levels of measurements, including pixel-level error, module-level error, and codeword-level error.
• Pixel-level error
The pixel-level error measures the number of pixels whose colors after monochrom- atization are different from the corresponding pixels on the QR code. Let the color of each pixel p′ in the warped image I′ after monochromatization be denoted by T(p′) = {black,white}, and that of the corresponding pixel in the QR code is given
CHAPTER 5. CODE-AWARE IMAGE WARPING 22
by IQ(p′), the pixel-level error energy is then defined as:
Eep= ∑
p′
w(p′)φp(T(p′),IQ(p′)), (5.1)
where w(p′) indicates whether the pixel p′contains image content(=1) or not(=0), and φp(T′(p′),IQ(p′)) is a pixel color indicator function for indicating if the two colors T(p′) and IQ(p′) are the same, where
φp(T′(p′),IQ(p′)) =⎧⎪⎪
⎨⎪⎪⎩
1 if T′(p′) ≠ IQ(p′)
0 otherwise , (5.2)
• Module-level error
The module-level error measures the number of modules whose colors are changed due to the embedded image. We present a QR code as Q= {C,M} with a set of codewords C and modules M. Assuming that the color of a module is changed if more than 50% of its pixels are altered after embedding the image and monochrom- atization, the module-level error energy is then defined over all modules mk∈ M as:
Eem= ∑
mk∈M
φm(mk), (5.3)
where
φm(mk) =⎧⎪⎪
⎨⎪⎪⎩
1 if ∑pi∈mkφp(T′(pi),IQ(pi))/n(mk) ≥ 0.5
0 otherwise (5.4)
• Codeword-level error
The codeword-level error measures the number of destroyed codewords due to the embedded image. A codeword is destroyed if the colors of at least one of its eight
CHAPTER 5. CODE-AWARE IMAGE WARPING 23
modules are not correct. Therefore, we define the codeword-level error energy as:
Eec= ∑
cj∈C
φc(cj), (5.5)
where
φc(cj) =⎧⎪⎪
⎨⎪⎪⎩
1 if ∑mk∈cjφm(mk) ≥ 1
0 otherwise (5.6)
5.2 Shape distortion energy
For some important regions on the embedded image, we prefer that the warps are locally conformal to preserve the image’s shape. Therefore, the warping should satisfy the Cauchy-Riemann equations for all triangles as1:
∂ x′
∂ x =∂ y′
∂ y,∂ x′
∂ y = −∂ y′
∂ x. (5.7)
Denote by Tpqr∈ T a triangle formed by three vertices vp, vq, vr ∈ V, where vp is the vertex at the right angle, and vq and vr are the vertices on the horizontal and vertical directions of vp, respectively, we then discretize Eq. (5.7) to form the distortion energy for each triangle in the least square sense as:
Ed= ∑Tpqr∈Twpqr((y′r−y′p)+(x′q−x′p))2 +∑Tpqr∈Twpqr((x′q−x′p)−(y′r−y′p))2,
(5.8)
where wpqr stands for the importance of the triangle, and by default we set wpqr= 1 for all triangles. We further allow users to specify some important regions with a large number by painting on the triangles, and the importance is set to a large number: wpqr= 15.
1The subscript i is omitted.
CHAPTER 5. CODE-AWARE IMAGE WARPING 24
5.3 Smoothness energy
Since an object often occupies multiple neighboring triangles, to prevent the object distortion, the warping function should be as smooth as possible. Specifically, the neigh- boring edges after warping should have similar lengths and orientations. Based on the criterion, we define the smoothness energy as:
Es= ∑
v′i, j∈V′∣∣(v′i, j−v′i−1, j)−(v′i+1, j−v′i, j)∣∣2 + ∑
v′i, j∈V′∣∣(v′i, j−v′i, j−1)−(v′i, j+1−v′i, j)∣∣2.
(5.9)
Note that the orientations of the edges do not need to resemble their original orienta- tions because the image is allowed to undergo a rotation if needed.
5.4 Scale energy
Ideally, the size of the input image should be maintained by the optimization system.
Otherwise, we can find solutions that prevent the QR code error by deforming the image to a very small size. Thus, we define the following scale energy as:
Esc= ∑
(vp,vq)∈E∣∣(v′p−v′q)2−(vp−vq)2∣∣2. (5.10)
5.5 Total energy and optimization
Before doing the optimization, we would locally translate the input image to find a position with lower QR code error energy. Since the rotate angle and the size of the input image are specified according to the user preference, we thus have no intend to do these transformations beforehand.
CHAPTER 5. CODE-AWARE IMAGE WARPING 25
The total energy for the code-aware warping is a weighted sum of the above energy terms:
E= wepEep+wemEem+wecEec+wdEd+wsEs+wscEsc. (5.11)
It is impossible to satisfy all constraints because they conflict with each other. Our method smoothly spreads the conflicts according to these weights and obtains the com- promised solution by a global optimization. Different relative weights result in different levels of distortion, and are determined by visual observation. For the shape distortion weight wd, different types of images can afford different levels of distortions. For exam- ple, embedding an arbitrary deformable image allows the image to be naturally deformed for reducing the code error, while embedding a company logo requires the shape of the logo to be preserved. Therefore, we make the users to be able to adjust the shape dis- tortion weight wd for different images. Empirically, we use the following set of weights:
wep= 0.1, wem= 1, wec= 10, wd= [1,10], ws= 0.01, wsc= 0.000001, where wd= [1,10]
means the users are allowed to control in this range.
The total energy function is nonlinear, and does not have the analytical solution be- cause the QR code error energy term requires taking the image texture into account.
Therefore, we optimize the warping using an iterative steepest descent algorithm with a coarse-to-fine strategy by downsampling the input image and the QR code for a certain levels (3 levels in our implementation). The optimization process begins by solving the lowest resolution version of the warping problem. To achieve this, a coarser resolution mesh is constructed (due to the smaller image resolution) to optimize the total energy.
After the warping, we render the deformed image based on barycentric coordination, and
CHAPTER 5. CODE-AWARE IMAGE WARPING 26
the image is then upsampled to the next level. In the finer resolution level, a finer mesh is constructed, and the warping optimization problem is solved again. In our implementa- tion, the size of each grid is around 35×35 pixels, and further divided into two triangles.
The process iterates until the original resolution is reached. Because to evaluate the QR code error energy needs to perform the texture mapping at each iteration, the optimization process is not so efficient though can be improved by GPU. Usually it takes 5 to 8 minutes to get an optimized warping result with the current implementation.
Chapter 6
Module Stylization
The goal of the module stylization is to reshape the modules according to an input ex- ample shape, so that the modules will have similar appearance with the shape. In addition, the stylized modules should resemble the original square shapes in order to reduce the QR
QR Code modules
Examplar
. . . . . .
Figure 6.1: Assignment of boundary local patches. The examplar boundary patches (right) are assigned to the QR code boundary patches (left).
27
CHAPTER 6. MODULE STYLIZATION 28
code error. Since a shape can be represented as a binary image, we assume that the input is a binary (examplar) image. Our method synthesizes stylized QR code modules which resemble the examplar.
To synthesize the stylized modules, one possible way is to adopt the texture synthesis method on the binary images [9, 25]. However, these methods could unavoidably cause the QR code error because they do not have control on the shape boundaries. Instead, we develop a boundary synthesis method which synthesizes stylized boundaries of the modules. Our method is efficient because the search space is limited to boundary pixels, and the similarity metric only counts for contributions of boundary pixels rather than all pixels in a local window. Moreover, we balance the resemblance of the boundaries between the original regular shape and the stylized result, and therefore can reduce the QR code error in the synthesis process.
6.1 Similarity distance
The boundary synthesis method begins by representing the input examplar and the QR code modules using their boundary pixels as illustrated as the black outlines in Figure 6.1.
Let Bm and Be denote the sets of boundary pixels of the original QR code modules and input examplar, respectively, our goal is to generate a set of boundary pixels B′m for the QR code modules, so that the new boundaries capture the local shape properties of the examplar boundary Be. Inspired by texture optimization [20], our method iteratively min- imizes the local appearance differences between the QR code module boundaries and the examplar boundaries.
CHAPTER 6. MODULE STYLIZATION 29
Let pm∈ Bmand pe∈ Bebe two boundary pixels of the original QR code modules and input examplar, respectively. We first trace the boundaries from the two pixels within a local window (with the size of 41× 41 in our implementation) to form two neighboring patchesN (pm) and N (pe) as illustrated as the red lines in Figure 6.1. Then, the similarity D(N (pm),N (pe)) between the two boundary patches N (pm) and N (pe) is defined as:
D(N (pm),N (pe)) =∑p∈N (pm)d(p,p′)
∣N (pm)∣
+∑q∈N (pe)d(q,q′)
∣N (pe)∣ ,
(6.1)
where p′∈ N (pe) and q′∈ N (pm) denote the corresponding pixels of p ∈ N (pm) and q∈ N (pe), respectively, and d(p,p′) denotes the geodesic distance between the two pix- els when aligning the two patchesN (pm) and N (pe) together. Figure 6.2 illustrates an example of the similarity metric computation, where we sum up the average distances from a pixel of N (pe) to its corresponding pixel in N (pm) and vise versa. The cor- respondence of the pixels in N (pm) and N (pe) is decided by first parameterizing the boundaries while aligning their central pixels pmand pe and then matching the boundary pixels proportionally.
6.2 Boundary construction
We adopt an optimization method which iteratively modify the boundaries of the QR code modules, so that its local appearance is similar to that of the input examplar, and its global shape is similar to that of the original QR code module. In each iteration, we alternate between two steps:
1. matching each boundary patch of the QR code modules to a boundary patch of the
CHAPTER 6. MODULE STYLIZATION 30
p
e1
p
m1
N (p
m)
1
N (p
e)
1
d1
d2
d6
D( N (p
m), N (p
e)) =
16 6i=1d
i+
15 5i=1d
i1
d1
d4 d4
d5 d3
d2
d5 d3
Per-pixel distance from toN (pm)
1
N (pe)
1
Per-pixel distance from toN (pm)
1
N (pe)
1
’
’
’
’
’
Figure 6.2: An illustration of boundary patch similarity metric. The computation of the similarity between two boundary patches N (pm) and N (pe) is the sum of average per-pixel distances from a patch to the other.
input examplar.
2. modifying the boundaries of the QR code modules based on the matching results.
6.2.1 Boundary patch matching
As mentioned before, we want each boundary patch of the QR code modules to be similar to one of the input examplar. Therefore, for each boundary patch of the QR code modules, we search for the most similar boundary patch from the input examplar according to Eq. (6.1). For our purpose, solving the problem is not expensive because we only need to search along the boundary, and thus a brute force approach can be used to search over all boundary pixels. Note that if the input examplar is semantically directional (e.g., the fire examplar in Figure 6.3 (a)), the search space can be further limited so that the upper side of the QR code module should find the most similar boundary patch from
CHAPTER 6. MODULE STYLIZATION 31
Examplar (a) (b)
Figure 6.3: A comparison of the effect of label using. (a) uses the label control, (b) does not. As a result, the different side of the contour pixels of (a) have the features of the relative part of the examplar, while (b) does not have this effect.
the upper side of the fire examplar. Figure 6.3 shows a comparison of label using.
6.2.2 Boundary modification
After finding the most similar boundary patches, our goal is to modify the QR code module boundaries for increasing the boundary similarity between the QR code modules and the input examplar while maintaining the global features of the module boundaries.
To achieve this, we concatenate the boundary pixels in each matched boundary patch to construct the first-order representation of the modified boundaries. Figure 6.4 illustrates the process. Specifically, the boundaries on the QR code modules are first separated into horizontal and vertical directions. For a horizontal boundary, we align the x-coordinates of the matched boundary patches, and record the vector ∆p= [∆xp, ∆yp]T to the next boundary pixel for all pixels. At the regions where the x-coordinates of two boundary patches overlap, we find a cut point where their point vectors across the cut are the most
CHAPTER 6. MODULE STYLIZATION 32
similar. Similarly, the vertical boundaries can be handled similarly by aligning the y- coordinates matched boundary patches. This gives us the vector representation of the modified boundary in the form of an array of 2-dimensional vectors.
With the vector representation of the boundary in hand, we want to reconstruct an ideal boundary, so that it satisfies the previously stated goals. This is achieved by solving the following energy function which combines a local feature energy term (El) and a global shapeenergy term (Eg) as:
E= El+λEg. (6.2)
Ideally, the vector representation of the reconstructed boundary B′ should resemble one obtained by concatenating matched boundary patches. Therefore, the local feature energy term (El) is defined as:
El= ∑
pi ∣∣∆p′i−∆pi∣∣2, (6.3) where pidenotes the set of boundary pixels.
The goal of the global shape energy term (Eg) is to prevent the modified boundary from changing too much, so we uniformly sample a set of points (usually with the module size1) along the contours and fix their positions:
Eg= ∑
cj ∣∣c′j−cj∣∣2, (6.4)
where cj and c′j denote the positions of a sample pixel and in the modified boundary, respectively.
1We set 32 pixels as the width of a module and set the window size to be 41 pixels in our implementation.
CHAPTER 6. MODULE STYLIZATION 33
Original horizontal boundary pixels
Matched boundary patches
∆p
1
:
y x
1 0 1 1 0
2 1 1 1
1 1 0 1
1 ... Constructed
vector representation of the boundary Cut point
...
Figure 6.4: An illustration of concatenating matched patches on a horizontal boundary to form the vector representation of the modified boundary.
CHAPTER 6. MODULE STYLIZATION 34
The energy function is quadratic, and thus can be optimized by solving a linear sys- tem. In Eq. (6.2), the λ controls the contribution of the global shape energy term Eg to the energy function. Larger λ can better preserve the global shape of the QR code mod- ules as shown in Figure 6.5. Overall, we use λ= 1 to generate all results. The boundary patch matching and boundary modification steps are performed iteratively until conver- gence. After optimizing the location of each pixel, the neighboring pixels may not be connected to each other. Hence, we then enclose the boundary and fill the color inside the optimized contours. In addition, we perform an anti-aliasing technique to smooth the rendered stylized modules.
CHAPTER 6. MODULE STYLIZATION 35
λ = 0.001 λ = 0.01
λ = 0.1 λ = 1
Figure 6.5: A comparison of synthesized results using different values of λ . The bigger value of λ cause the contour pixels to be more restricted to the shape of original contour.
Chapter 7 Results
We applied our framework to embellish a wide variety of QR codes as shown in Fig- ure 7.2, Figure 7.3, and Figure 7.4. With the input images and examplars on the left, we can effectively decorate the QR codes while minimizing the error as much as possible.
In order to reduce the QR code error caused by the embedded images, darker objects should fit in black modules, and vice versa. As a result, the head and body of the Mer-
Figure 7.1: Demonstration of imposing a huge distortion weight on a special region which should not be deformed too much. The blue meshes in the right figure denote the region with a huge weight of distortion. The image is obtained from [3].
36
CHAPTER 7. RESULTS 37
Examplar
Input image Result
(a)
Examplar
Input image Result
(b)
Figure 7.2: Some results generated with our framework. These two cases are using examplars that are directional. The upper input image is obtained from [2].
CHAPTER 7. RESULTS 38
Examplar
Input image Result
(a)
Examplar
Input image Result
(b)
Figure 7.3: Some results generated with our framework. These two cases show that scaling may strongly reduce the caused QR code error. The input images are obtained from [6] and [1].
CHAPTER 7. RESULTS 39
Examplar
Input image Result
(a)
Examplar
Input image Result
(b)
Figure 7.4: Some results generated with our framework. Upper image deformed globally, and bottom image deformed locally. The input images are obtained from [7] and [3].
CHAPTER 7. RESULTS 40
lion in Figure 7.4 (b) and the body of the running people in Figure 7.2 (a) are slightly squashed to fit the shape of the black modules, and the body of the snake in Figure 7.4 (a) is stretched to fit in the black modules. On the other hand, the glass in Figure 7.3 (a) is compressed into the white modules. Sometimes, we may find out that uniform scaling may also reduce the error strongly, Figure 7.3 (b) is an example of this case. However, the slight distortion is not easy to be recognized, but can effectively increase the readability while keeping the artistic. Figure 7.2 (a) and (b) also show that our algorithm well per- forms the cases that the input examplars are directional. That means different sides of the modules should have different features.
Figure 7.1 demonstrates that for some regions which should not be distorted, users are allowed to impose a huge weight of distortion error on the corresponding meshes. Then, our optimization would preserve the shape of the specified regions as much as possible while minimizing the error caused by other regions.
In order to validate the effectiveness of the codeword-level and module-level errors, we made a comparison shown in Figure 7.7. The embedded panda is warped with respect to all three error levels (Figure 7.7 (a)) and only with respect to pixel-level error (Fig- ure 7.7 (b)), respectively. It turns out that although Figure 7.7 (b) has lower pixel-level error (2.6% for (a) and 2.3% for (b)), Figure 7.7 (a) has fewer incorrect codewords and modules (2 incorrect codewords and 7 incorrect modules for (a) and 3 incorrect codewords and 8 incorrect modules for (b)).
CHAPTER 7. RESULTS 41
(a) (b)
Figure 7.5: Comparison with a previous method [23]. (a) A result of the previous method which which shifts and rotates the inserted image. (b) A result of our method with no global transformation and slight distortion.
7.1 Comparison with Previous Methods
We compare our result with previous method proposed by Ono et al. [23]. With global transformations, the embedded image could undergo a large translation or rotation that the user does not intend to do (Figure 7.5 (a)). Our method allows the input image to undergo a slight deformation instead (Figure 7.5 (b)). And compared with [16] and [35], since their method force one module to have only one color, in order to approximate the original resolution of inserted image, their method should adopt higher value of version.
Our method would not have the problem of resolution reduction or having noises on inserted images, but may not have as much as region for editing as their methods. To see the comparison, please refer to Figure 7.6.
CHAPTER 7. RESULTS 42
(a) (b)
Figure 7.6: Comparison with a previous method [35]. (a) A result of previous method which adopted non-systematic encoding method to form the result QR code. (b) A result of our method which would not reduce the input image resolution but would slightly deform the input image.
7.2 Performance
We implemented our method with a desktop PC equipped with an Intel i7 3.5GHz CPU, 16GB RAM. The performance of the QR code module stylization is efficient. The average execution time needs only 24 ms. The computational complexity of the code- aware non-uniform warping depends on the number of vertices and sizes of input image and QR code image. Our input images are usually with size of 2.5 megapixels, and QR code images are usually around with size of 6.4 megapixels. Overall, it takes about 5- 8 minutes to converge because the optimization requires iteratively perform the texture mapping.
CHAPTER 7. RESULTS 43
(a)
(b)
Figure 7.7: Comparison of using three different error levels or not on the same input image [4]. The images on the left column texture show the incorrect pixels, modules, and codewords from top to bottom, respectively. (a) The result of optimizing with all three error levels. (b) The result of optimizing only with the pixel-level error.
CHAPTER 7. RESULTS 44
7.3 Discussion and Limitation
To evaluate the readability of the embellished QR codes, we revealed the ideal num- ber of incorrect codewords, modules, and pixels in our system. Additionally, we also tested the readability with nine different kinds of QR code readers (e.g., i-nigma, Scan, ScanMyDoc, etc.) as shown in Table 7.2. The readability is calculated as the number of successfully-recognizing readers over the total number of readers used (12 in our experi- ment). According to Table 7.2, using our optimization could reduce 10% codeword error on average. Different QR code readers may adopt different methods to analyze QR codes and rectify the perspective effect, thus some readers have lower successful detection rate.
Due to the above reasons we cannot ensure the embellished QR codes are definitely read- able. For example, in the third row of Table 7.2, although the QR code error is under the theoretical value that M level can tolerate, there is still a few QR code readers cannot decode the embellished results. We further examine the incorrect codeword percentage by randomly choosing weights in the range that proposed in Section 5 for thirty times of ten different images. The statistics are plotted in Figure 7.8, and the average percentage of the incorrect codewords before the optimization is 19%, and could be reduced to 9%
after the optimization. Since the fact that the incorrect codeword rate is over 7%, and the maximum incorrect codeword rate is under 16%, it may also indicate that using the M level for error correction is well enough to recover the error after our optimization, and we may have to admit that it is possible to generate unrecognized QR code results if users choose to use theL level for error correction. Moreover, if users impose a huge weight
CHAPTER 7. RESULTS 45
of distortion error globally, or embed an image that is too large for covering almost the entire QR code symbol, there may be no good way for us to diminish the error.
To further verify the robustness of the embellished QR codes, we tested the readability from different viewing directions.Table 7.1 shows the statistics generated by testing 6 em- bellished QR codes with 100% detection rate and their original counterparts. According to Table 7.1, if we scan the embellished QR codes image from the viewing angles which are more deviated from the center, the QR codes may have higher possibility to be unrec- ognizable. Regular QR codes also suffer from the deviating viewing angles. Fortunately, users usually scan a QR code with small viewing angles for guaranteeing the accuracy of the recognized result. Our embellished QR codes can also achieve similar readabilities to the regular QR codes when the viewing angles are small.
Our QR code stylizing method can effectively preserve the QR code correctness. Ta- ble 7.3 shows the statistics of errors when stylizing the modules with different examplars and λ (described in Eq. (6.2)). The percentage of the incorrect codewords is almost less than the error correction capability of the lowest error correction level (7%).
Although our framework can semi-automatically assist embedding an image into a QR code, the input image should not cover finder patterns and alignment patterns in the initial placement stage, since these patterns are crucial to decoding process and should always be revealed. In addition, our method finds a small region of the code where an image can be embedded without introducing too much error. Thus our method shares similar limitation that the larger the embedded image, the higher possibility that the embellished QR code cannot be recognizable.
CHAPTER 7. RESULTS 46
Error Codeword Rate
Original Reduced
40 % 35%
30%
25%
20%
15%
10%
5%
0%
L M Q H
Figure 7.8: We randomly tested 30 different weights of combination and plotted the percentage of incorrect codewords before and after the optimization in the chart. The left and right red bars are the ranges of the percentage of incorrect codewords before and after the optimization, respectively. The red dotted lines denote the error percentage that each level can tolerate, and the black straight lines that cross the red bars denote the average values.
-45°
Viewing angle Embellished Original
83%
90%
-30°
97%
100%
0°
100%
100%
30°
97%
100%
45°
83%
90%
-45˚ 0˚ 30˚ 45˚-30˚
QR Code
Table 7.1: The statistics of detection rate from different viewing angle. The first and second rows are the detection rate for embellished and original QR codes, respectively.
CHAPTER 7. RESULTS 47
Image Error Original Reduced Detection
correction level error rate error rate rate
Figure 7.2(a) M
22.7%
3.0%
3.8%
11.3%
1.3%
2.3%
100%
Figure 7.2(b) M
20.5%
2.2%
3.7%
11.4%
1.3%
3.4%
100%
Figure 7.3(a) L
15.4%
3.2%
3.9%
11.5%
2.0%
2.9%
66.7%
Figure 7.3(b) L
13.6%
1.0%
2.5%
2.2%
0.1%
1.8%
100%
Figure 7.4(a) L
9.1%
0.8%
2.1%
0%
0%
1.2%
100%
Figure 7.4(b) M
20.4%
3.8%
5.6%
13.6%
0.1%
4.0%
100%
Table 7.2: The statistics of error when embedding an image into the QR code. The “error correction level” is the error capability the user chose when generating the QR code. The
“original error rate” and the “reduced error rate” are the error rates before and after the optimization, respectively. In each cell, the upper, middle, and lower values indicate the percentage of incorrect codewords, modules, and pixels, respectively. The “detection rate” is the success rate of using nine different kinds of QR code readers physically.

![Figure 3.2: Exmaples of placing images in padding regions from [5].](https://thumb-ap.123doks.com/thumbv2/9libinfo/9602712.629222/24.892.222.674.543.799/figure-exmaples-placing-images-padding-regions.webp)
![Figure 3.3: Exmaples of RS code modification. (a) A result of [16]. (b) A result of [35]](https://thumb-ap.123doks.com/thumbv2/9libinfo/9602712.629222/25.892.223.671.731.953/figure-exmaples-rs-code-modification-result-b-result.webp)
![Figure 3.4: Applications of content-preserve warping. (a) Resizing using content- content-preserve warping [32]](https://thumb-ap.123doks.com/thumbv2/9libinfo/9602712.629222/26.892.140.784.916.1056/figure-applications-content-preserve-warping-resizing-content-preserve.webp)