Seasonal variation of chickenpox in Taiwan estimated by NHIR database
Po-yuan Wu a , Yu-Chuan Li a
a graduate institute of medical informatics, Taipei medial university
E-mail Address:skin@url.com.tw Abstract
In order to determine the seasonal variation of chickenpox in Taiwan, we analyzing data from NHIR database in year 2000. The entire patient suffered from chickenpox in NHI date base are included (N=165719) and divided to northern, center, southern and eastern part of Taiwan by geographic locations. In all geographic locations except off-shore Island, the peak is in January and lowest incidence rate peak in September and July. Chi-Square Test for Equal Proportions show seasonal variation of chickenpox in Taiwan (P <.0001).
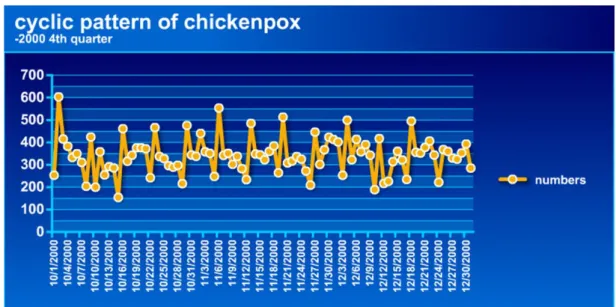
We also found there are cyclic pattern between total patient numbers and days in all the year 2000, about 7 days a cycle
Keywords: chickenpox, seasonal variation, incidence rate, temperature
Many infection disease especially virus related such as influenza, respiratory syncytial virus2 behave as cyclical and seasonal pattern. How to identify the seasonal pattern and predictable of virus infection is very important in prevention outbreaks and disease control.
Chickenpox is a highly contagious disease with average 2 weeks incubation periods. The complication of chickenpox is scar in skin, pneumonia, encephalitis. The mortality rate for children with leukemia or immunosuppressed children is 7% to 14%.3 Infections during pregnancy may cause congenital abnormality4 and even life threatening to fetus and mother.5
The National Health Insurance Plan has accumulated 12 million administrative and claims data, the largest in the
world.(http://www.nhri.org.tw/nhird/brief_01.htm).
However, it is difficult to study due to there are some traps and often lead to incorrect interpretation in database. First, due to the request of national health insurance, the drugs prescribed by doctor must correlate to ICD numbers. As the result, in some circumstance, incorrect ICD numbers are put into database due to the need of prescription off-label use drugs. Secondary, some diseases are difficult to diagnose without/ either examinations. Temporary ICD numbers are put in this situation. Third, some ICD numbers are the group of the diseases, not specific to the real only one disease. In our study, the disease is easy to diagnose by physicians and no complicated drugs need to prescribe. Further more, chickenpox is needed to report to government, so no intension to put chickenpox ICD number for the sake of other reasons. We also use the daily weather data and demographic data provided by government. The whole data we analysis are very reliable.
Materials and methods
Chickenpox is clinically defined as acute onset of multiple typical skin lesions in the same time (i.e.
erythema, papules, vesicles, crusts) and the ICD number of chickenpox are 052.0, 052.1, 052.7, 052.9 respectively. We collect data from Jan 2000 to Dec 2000 in all clinics and hospital in Taiwan which ICD number are described as above by national health insurance research database. By using SQL instructor, we got the data including visiting day, sex, birthday, hospital ID and count once if multiple visits are found . Then we use another hospital basic data in NHI data base to translate hospital ID to real location in Taiwan. Then we divide to
Northern, central, southern ,eastern and off-shore Island of Taiwan by hospital locations. The weather data in Taiwan were collect from Central Weather Bureau (http://www.cwb.gov.tw/index-f.htm.). The demographic data is in our government database (http://www.ris.gov.tw/)
Estimation of incidence rate
Incidence rate is defined by number of new cases divided by total number of person at risk
Evaluation of seasonal variation
We use Lorenz curve6 and Chi-Square Test for Equal Proportions to evaluation of seasonal variation .First we calculate the incidence rate in every month and rank the incidence rate from lowest to highest cumulative percentage of days in X-axis and cumulative percentage of cases in Y-axis. The more bowed Lorenz curve means more concentrated in particular months.
Evaluation the relationship between climate and incidence of chickenpox
We use daily temperature, daily temperature difference in Taipei as independent variable, number of patients 14 days latter in northern part of Taiwan (due to mean incubation period are 14 days) as dependent variable.
Regression analysis are performed
Result
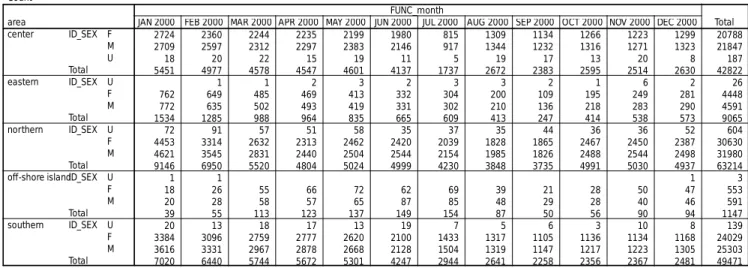
Total number of patients in our study is 165719, female is 80448 and male is 84312, 959 are unknown. Average annular incidence of Taiwan is 0.007439. The highest incidence rates in four areas are January and lowest rate is September in three areas, July in center area of Taiwan. (Fig1)However, in off-shore islands there are different pattern from Taiwan Island. (Fig2)Detail distribution in four part of Taiwan in Table1 .Lorenz curve shown in Fig3. Chi-Square Test for Equal Proportions shows Chi-Square is 16957.377 (Pr
<.0001) . The Estimation of highest Incidence rate in
Taipei city , Taichung city, Kaohsiung city are:
0.000543, 0.000737,0.000999 respectively.(Fig4)
We also found there are cyclic pattern between total patient numbers and days in all the year 2000(Fig.5) as example). If we closely observe in one month (Fig.6), we can find about 7 days a cycle (peak in 10/2, 10/9, 10/16, 10/23, 10/30 respectively.
The equations for transforming from temperature to number of patients as follows:
patient numbers= -3.189X TEMP +254.222 (P< 0.001, r=0.237).
There is no statistical significance about regression equations for daily temperature differences and patient numbers. (P=0.718)
Discussion
The major determinants of the incidence of disease include the age of people, the season of the years, climate geographic locations and the degrees of contact with individuals. 7As the result, we can fully explain the lowest incidence rate in July, September due to summer vacation which loss closely contact among child. The highest incidence rate in July in Kingmen showed local endemic with poorly disease control. In addition to above, more elevation in temperature may be decrease viral activity.
The compositions of climate include temperature, moisture, pressure, rainy days, sunny hours8 and the amount of rain. In our study, we try to use daily temperature and temperature differences to find out the relationship between climate and incidence of chickenpox. Although the r value (0.237) is not so high to explain strong relationship between temperature and incidence of chickenpox, but we can predict the number of victim 14 days later by statistical significance regression formula. It may be due to complicated viral transmission pattern that climate influence only one of the decision factors. On the other hand, there are no
statistical significance regression formula between temperature differences and incidence of chickenpox.
We use two methods to determine the season variation of chickenpox or not. First, we use the Lorenz curve and second we use statistic methods --Chi-Square Test for Equal Proportions. If the monthly incidence are equal the curve may follow the diagonal line throughout (0,0) to (1,1). No area between the Lorenz curve and diagonal lines due to they are the same lines. When the variation increase, the Lorenz curve are more bowed, the area between curve and diagonal lines indicate the variations.
The Chi-Square Test for Equal Proportions show significance variation (P<0.0001)
In three main city of Taiwan, the incidence rate increase from north to south. However, they are lower than rural area in Taiwan, although more hospital and clinics in city area. The factors that influence the difference incidence rate between city and rural area may be due to fewer siblings in city family.
We also found the cyclic pattern in daily patient numbers in Taiwan. The truly medical meaning still unknown. It need further evaluations and explanations.
Control disease center develop report system by sentinel general practitioner for infection disease surveillance 1 . Compare with data from CDC, we can find the trend is similar between sentinel general practitioner and NHI data. However only from NHI data, the true incidence rate and cyclic pattern are found ..
It is difficult to compare data in other country due to little papers published in journal9,10. The epidemiologic data may be very difficult to get and incorrect in other country due to poorly report system and no electronic data base. (only 5861 cases report in Taiwan, report rate=3.53%). However due to the era of SARS, study the relationship between virus and its cyclic pattern11,12, the climate factor that influence the virulence of virus will be important for us to understand them , control them
and eradication them. We hope more further investigation and analysis to determine the actual significance of each of the individual risk factor13
References
1. 行政院衛生署疾病管制局.(2002.3).臺灣地區傳染
病統計暨監視年報(中華民國八十九年).
2. van der Sande MA, Goetghebuer T, Sanneh M, Whittle HC, Weber MW(2004), "Seasonal variation in respiratory syncytial virus epidemics in the Gambia, West Africa" , Pediatr Infect Dis J.
Jan;23(1):73-4.
3. Feldman S, Hughes WT , Daniel CB(1975),
"Varicella in children with cancer . seventy-seven cases, "Pediatrics 56:388-397
4. Wheller TH(1983), "Varicella and herpes zoster:
changing concepts of the natural history , control and importance of a not-so-benign virus, " N Engl J Med 309:1434
5. Pastuszak Al, Levy M(1994), "Outcome after maternal varicella infection in the first 20 weeks of pregnancy" N Engl J Med 330:901-905
6. Lee WC(1996), "Analysis of seasonal data using the Lorenz curve and the associated Gini index. " Int J Epidemiol 25:426-34
7. Nelson WE, Behrman RE, Kliegman RM, Arvin AM (1996)Textbook of Pediatrics,15th ed , Philadelphia: WB saunders: 750-751
8. Zak-Prelich M, Borkowski JL, Alexander F, Norval M.(2002), "The role of solar ultraviolet irradiation in zoster , " Epidemiol Infect. Dec;129(3):593-7.
9. Liu SC, Wang JD, Lee CY, Chou MC(1998),
"Seasonal variation of chickenpox, mumps and rubella in Taiwanese children estimated by pediatric clinics,"J Microbiol Immunol Infect. Dec;31(4):217- 24 .
10.Kokaze A, Yoshida M, Sekine Y, Ishikawa M, Kurokochi T, Uchida Y, Matsunaga N, Takashima Y.(2001),"The magnitude of variation in
temperature within a year has an effect on the seasonal variations of chickenpox incidence in Japan.Epidemiol Infect,” Apr;126(2):269-77.
11.Noah ND(1989),"Cyclical patterns and predictability in infection,” Epidemiol Infect.102:175-90
12.Wagner S, Jung H, Nau F, Schmitt HJ(1993),
"Relevance of infectious diseases in a pediatric practice,” Clin Padiatr.205:14-7
13.Sumi A (1998), "Time series analysis of surveillance data of infectious diseases in Japan,”Hokkaido Igaku Zasshi. Jul;73(4):343-63.
Count
2724 2360 2244 2235 2199 1980 815 1309 1134 1266 1223 1299 20788
2709 2597 2312 2297 2383 2146 917 1344 1232 1316 1271 1323 21847
18 20 22 15 19 11 5 19 17 13 20 8 187
5451 4977 4578 4547 4601 4137 1737 2672 2383 2595 2514 2630 42822
1 1 2 3 2 3 3 2 1 6 2 26
762 649 485 469 413 332 304 200 109 195 249 281 4448
772 635 502 493 419 331 302 210 136 218 283 290 4591
1534 1285 988 964 835 665 609 413 247 414 538 573 9065
72 91 57 51 58 35 37 35 44 36 36 52 604
4453 3314 2632 2313 2462 2420 2039 1828 1865 2467 2450 2387 30630
4621 3545 2831 2440 2504 2544 2154 1985 1826 2488 2544 2498 31980
9146 6950 5520 4804 5024 4999 4230 3848 3735 4991 5030 4937 63214
1 1 1 3
18 26 55 66 72 62 69 39 21 28 50 47 553
20 28 58 57 65 87 85 48 29 28 40 46 591
39 55 113 123 137 149 154 87 50 56 90 94 1147
20 13 18 17 13 19 7 5 6 3 10 8 139
3384 3096 2759 2777 2620 2100 1433 1317 1105 1136 1134 1168 24029
3616 3331 2967 2878 2668 2128 1504 1319 1147 1217 1223 1305 25303
7020 6440 5744 5672 5301 4247 2944 2641 2258 2356 2367 2481 49471
F M U ID_SEX
Total U F M ID_SEX
Total U F M ID_SEX
Total U F M ID_SEX
Total U F M ID_SEX Total area
center
eastern
northern
off-shore island
southern
JAN 2000 FEB 2000 MAR 2000 APR 2000 MAY 2000 JUN 2000 JUL 2000 AUG 2000 SEP 2000 OCT 2000 NOV 2000 DEC 2000 FUNC_month
Total
Table 1. Detail patient numbers distribution in five part of Taiwan.
Fig.1 Incidence in four part of Taiwan
Fig2. Incidence of off-shore island and main Taiwan island
Fig3. Lorenz cure of chickenpox in Taiwan, where x-axis shows cumulative percentage of days and y-axis shows cumulative percentage of incidences
Fig 4.comparisome of incidences in three main Taiwan cities
Fig 5.cyclic pattern of chickenpox in 2000/10-2000/12
14.
Fig 6.cyclic pattern of chickenpox in 2000/10