THE GAMBIA
572
0
0
全文
(2)
(3) COPYRIGHT RESERVED Extracts may be published if source is duly acknowledged.. Additional information on the IHS 2015/16 survey can be obtained from the Statistician General, Gambia Bureau of Statistics, P. O. Box 3504, Serekunda, The Gambia. Tel. +220 4377847:. Fax: +220 4377848.
(4)
(5)
(6) Table of Contents Page Preface. 12. Acknowledgments. 13. Definition of Concepts. 14. Special Notes Concerning Survey. 16. INTRODUCTION. 17. SAMPLE SIZE Table 1.1. Effective Sample Size by District. 21. Table 1.2. Sample Size for the Gambia Integrated Household Survey (IHS). 22. DEMOGRAPHIC CHARACTERISTICS Table 2.1. Distribution of Population by Gender and District. 24. Table 2.2. Distribution of Households by Household Composition (size) and District. 26. Table 2.3. Distribution of Population by Gender, Broad Age-groups and Area of Residence. 28. Table 2.4 Table 2.5. Distribution of Population (population pyramid) by Gender, Broad Age-groups and Area of Residence Distribution of Population Structure and Age Dependency Ratio by District. Table 2.6. Distribuition of Household Members Relationship to Head and District. 32. Table 2.7. Distribution of Population (12 years and above) by Marital Status and District. 34. Table 2.8 Table 2.9. Distribution of Population (12 years and above) by Marital Status, Gender and Broad Agegroups Distribution of Children (0-17 years) Orphaned and Father Living at Home. Table 2.10. Distribution of Children (0-17 years) Orphanedhood by District. 39. Table 2.11. Distribution of Children (0-17 years) Orphanedhood by District. 41. 29 30. 36 37. LITERACY AND EDUCATION Table 3.1. Distribution of Adult (15 years and above) Literacy Levels by Gender and District. Table 3.2. Distribution of Adult (15 years and above) Literacy Levels by Area of Residence, Gender and Broad Age-groups Distribution of Youth (15-24 years) Literacy Levels by Gender and District (international definition) Distribution of Youth (15-24 years) Literacy Levels by Area of Residence, Gender and Single Ages (international definition) Distribution of Youth (15-35 years) Literacy Levels by Gender and District (country definition). Table 3.3 Table 3.4 Table 3.5 Table 3.6 Table 3.7 Table 3.8 Table 3.9. Distribution of Youth (15-35 years) Literacy Levels by Area of Residence, Gender and Single Ages (country definition) Distribution Population (15 years and above) who Can do Simple Math Calculations by Gender and District Distribution Population (15 years and above) who Can do Simple Math Calculations by Area of Residence, Gender and Broad Age-groups Distribution Population (15 years and above) who Have Ever Attended Adult Literacy Course by Gender and District. 1. 42 44 45 47 48 50 51 53 54.
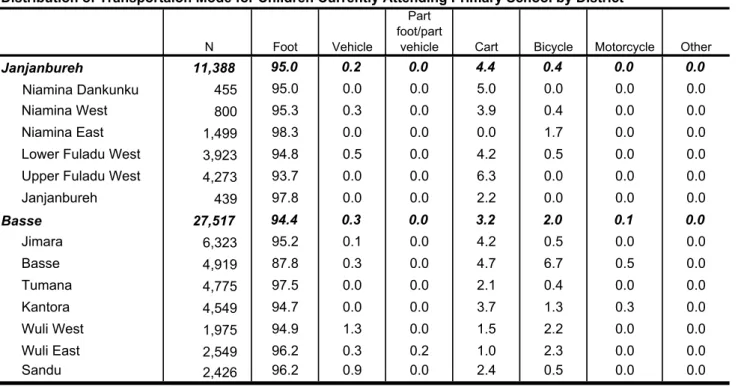
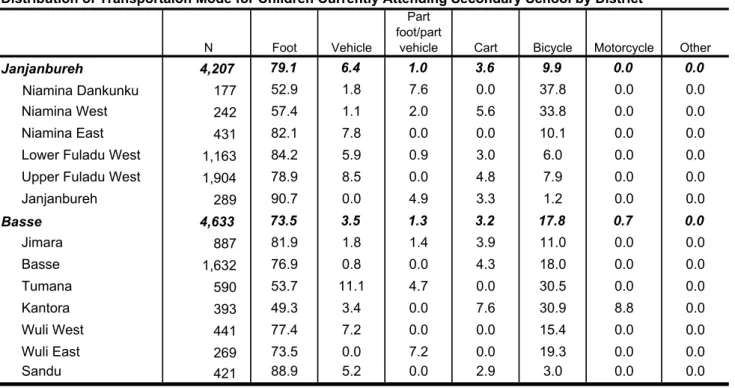
(7) Table 3.10 Table 3.11 Table 3.12 Table 3.13 Table 3.14 Table 3.15 Table 3.16 Table 3.17. Distribution of Population (3 years and above) Who Have Ever Attended School by Gender and District Distribution of Population (3 years and above) who Ever Attended School by Gender, Area of Residence and Broad Age-group Distribution Population (3 years and above) who Have Ever Attended School by Gender, Type of School and District Distribution Population (3 years and above) who Have Ever Attended School by Reason for Attending Madrassah instead of Formal School and District Distribution of Children (3-18 years) by School Attendance, Gender and District Distribution of Children (3-18 years) Who Have Ever Attended School by Reason Not Currently Attending School and District Distribution Population (3 years and above) by Highest Level of Education Attained and District. Table 3.20. Distribution of Male Population (3 years and above) by Highest Level of Education Attained and District Distribution of Female Population (3 years and above) by Highest Level of Education Attained and District Distribution of Population (3 years and above) by Highest Level of Education Attained, Gender and Broad Age-group Gross Enrolment Rates (GER) by Level of Education, Gender and District. Table 3.21. Net Enrolment Rates (NER) by Level of Education, Gender and District. Table 3.22. Gross Enrolment Rates (GER) and Net Enrolment Rates (NER) for Lower Secondary School (LSS) and Upper Secondary School (USS) by Gender and District Gross and Net Enrolment Rates for Early Childhood (3-6 years) Education, Gender and District. Table 3.18 Table 3.19. Table 3.23 Table 3.24. Table 3.26 Table 3.27. Distribution of Children (3 years and above) Currently Attending School by Who Runs and Manages the School and District Distribution of Children (3 years and above) in Currently Attending School by Level of Education, Who Manages the School and District Distribution of Access to School for Children Currently Attending Primary School by District Distribution of Transportaion Mode for Children Currently Attending Primary School by District. Table 3.28. Distribution of Access to School for Children Currently Attending Secondary School by District. Table 3.29. Distribution of Transportaion Mode for Children Currently Attending Secondary School by District Distribution of Children Attending Currently in School if Had an Interruption for a Month or more in the last 12 months by District Distribution of Households by the Frequency of Listening to Radio and District. Table 3.25. Table 3.30 Table 3.31 Table 3.32 Table 3.33 Table 3.34 Table 3.35 Table 3.36 Table 3.37 Table 3.38. Distribution of Population (15 years and above) by the Frequency of Listening to Radio and District Distribution of Population (15 years and above) by Gender, Frequency of Listening to Radio and District Distribution of Population (15 years and above) by the Frequency of Listening to Radio, Gender and Broad Age-groups Distribution of Households by the Frequency of Reading a Daily Newspaper and District Distribution of Population (15 years and above) by the Frequency of Reading a Daily Newspaper and District Distribution of Population (15 years and above) by Gender, Frequency of Reading a Daily Newspaper and District Distribution of Population (15 years and above) by the Frequency of Reading a Daily Newspaper, Gender and Broad Age-groups. 2. 56 58 60 62 64 67 71 73 75 77 79 81 83 85 87 89 92 94 96 98 100 103 105 107 109 110 112 114 116.
(8) HEALTH Table 4.1 Table 4.2. Distribution of Population and Gender by Incidence of Sickness in the last Four Weeks and District Distribution of Population Sick/Injured by Main Type of Illness and District. Table 4.3. Distribution of Population and Gender Sick/Injured by Type of Illness and Broad Age-groups. Table 4.4. Distribution of Population Sick/Injured by Type of Illness, Area of Residence and Broad Agegroups Distribution of Population and Gender Who Consulted a Health Practitioner (Use) by Gender and District Distribution of Population Who Were Sick by Type of Health Practitioner Consulted (Use) and District Distribution of Satisfaction Levels for Individuals who Consulted a Health Practioner and District Distribution of Population by Access to a Health Facility Used when Sick/Injured Within 30 minutes of Residence and District Distribution of Women (15-49 years) Ever Pregnant and Ever Given Birth by District. Table 4.5 Table 4.6 Table 4.7 Table 4.8 Table 4.9 Table 4.10. 117 119 121 123 125 127 129 131 133. Table 4.11. Distribution of Women (15-49 year) Ever Pregnant and Ever Given Birth by Age-group and Area of Residence Distribution of Women (15-49 years) by Children Ever Born and Living by District. 136. Table 4.12. Distribution of Women (15-49 years) by Children Ever Born and Living by Age-groups. 138. Table 4.13 Table 4.14. Distribution of Population (2 years and above) by Disability Status and Type of Disability by District Distribution of Population (15 years and above) by Ebola awareness and District. 141. Table 4.15. Distribution of Male Population (15 years and above) by Ebola awareness and District. 143. Table 4.16. Distribution of Female Population (15 years and above) by Ebola awareness and District. 145. Table 4.17. Distribution of Population (15 years and above) by Knowledge How to Prevent Ebola Transmisison and District Distribution of Male Population (15 years and above) by Knowledge How to Prevent Ebola Transmisison and District Distribution of Female Population (15 years and above) by Knowledge How to Prevent Ebola Transmisison and District Distribution of Population (15 years and above) and Gender by Knowledge How to Prevent Ebola Transmisison and Broad Age-groups Distribution of Population (15 years and above) by Knowledge How to Prevent Ebola Transmisison and Area of Residence Distribution of Population (10 years and above) and Gender by Smoking Characteristics and District Distribution of Population (10 years and above) and Gender by Smoking Characteristics, Area of Residence and Broad Age-groups Distribution of Population (10 years and above) and Gender by Current Smoking Habits and District Distribution of Population (10 years and above) and Gender by Current Smoking Habits and Broad Age-groups. Table 4.18 Table 4.19 Table 4.20 Table 4.21 Table 4.22 Table 4.23 Table 4.24 Table 4.25. 135. 139. 147 149 151 153 155 157 159 161 163. EMPLOYMENT Population 7 years and above Table 5.1. Distribution of Working Age Population (7 years and above) by District. 164. Table 5.2. Percentage Distribution of Population (7 years and above) by Work Status and District. 166. 3.
(9) Table 5.3. Distribution of Population (7 years and above) by Economic Activity Status, Gender and District. Table 5.4. Distribution of Population (7 years and above) by Activity Status, Gender and District. Table 5.5. Table 5.7. Distribution of Population (7 years and above) of Economically Active by Employmen Status, Gender and District Percentage Distribution of Population (7 years and above) by Work Status and Broad Agegroups Distribution of Population (7 years and above) by Activity Status, Gender and District. 176. Table 5.8. Distribution of Population (7 years and above) by Activity Status, Gender and District. 177. Table 5.9. Distribution of Population (7 years and above) of Economically Active by Employmen Status, Gender and District Distribution of Working Population (7 years and above) by Employment Sector and District. Table 5.6. Table 5.10 Table 5.11 Table 5.12 Table 5.13 Table 5.14. Percentage Distribution of Working Population (7 years and above) by Employment Status and District Distribution of Working Population (7 years and above) by Industry of Activity and District Distribution of Working Population (7 years and above) by Industry of Activity and Broad Agegroups Distribution of Economically Inactive Population (7 years and above) by Reason and District. 168 170 172 174. 178 179 181 182 184 186. Population 15-64 years Table 5.16. Distribution of Working Age Population (15-64 years) by District. 188. Table 5.17. Percentage Distribution of Population (15-64 years) by Employment Status and District. 190. Table 5.18. Distribution of Population (15-64 years) by Activity Status, Gender and District. 192. Table 5.19. Distribution of Population (15-64 years) by Activity Status, Gender and District. 194. Table 5.20 Table 5.21. Distribution of Population (15-64 years) of Economically Active by Employmen Status, Gender and District Percentage Distribution of Population (15-64 years) by Work Status and Broad Age-groups. 198. Table 5.22. Distribution of Population (15-64 years) by Activity Status, Gender and District. 200. Table 5.23. Distribution of Population (15-64 years) by Activity Status, Gender and District. 201. Table 5.24 Table 5.25. Distribution of Population (15-64 years) of Economically Active by Employmen Status, Gender and District Distribution of Working Population (15-64 years) by Employment Sector and District. Table 5.26. Distribution of Working Population (15-64 years) by Employment Sector and Broad Age-groups. Table 5.27. Distribution of Working Population (15-64 years) by Industry of Activity and District. Table 5.28. Distribution of Working Population (15-64 years) by Industry of Activity and Broad Age-groups. Table 5.29. Distribution of Economically Inactive Population (15-64 years) by Reason and District. 196. 202 203 205 206 208 210. Youth Population 15-35 years Table 5.31. Percentage Distribution of Population (15-64 years) by Work Status and Broad Age-groups. 212. Table 5.32. Percentage Distribution of Youth (15-35 years) by Work Status and District. 214. Table 5.33. Distribution of Youth (15-35 years) by Economic Activity Status, Gender and District. 216. Table 5.34. Distribution of Youth (15-35 years) by Activity Status, Gender and District. 218. 4.
(10) Table 5.35 Table 5.36. Distribution of Youth (15-35 years) of Economically Active by Employmen Status, Gender and District Percentage Distribution of Youth (15-35 years) by Work Status and Broad Age-groups. 222. Table 5.37. Distribution of Youth (15-35 years) by Activity Status, Gender and District. 223. Table 5.38 Table 5.39. Distribution of Youth (15-35 years) of Economically Active by Employmen Status, Gender and District Distribution of Working Youth (15-35 years) by Employment Sector and District. Table 5.40. Distribution of Working Population (15-35 years) by Employment Sector and Broad Age-groups. Table 5.41. Distribution of Working Youth (15-35 years) by Industry of Activity and District. Table 5.42. Distribution of Working Population (15-64 years) by Industry of Activity and Broad Age-groups. Table 5.43. Distribution of Economically Inactive Youth (15-35 years) by Reason and District. 220. 224 225 227 228 230 231. CHILD NUTRITION AND SURVIVAL Table 6.1. Distribution of Children (0-59 months) by Gender. 233. Table 6.2. Distribution of Births for Children (0-59 months) by Place of Delivery and District. 234. Table 6.3. Distribution of Births for Children (0-59 months) by Type of Assistance during Delivery and District Distribution of Children (0-59 months) by Type of Immmunization Vacinne and District. Table 6.4 Table 6.5. 236 238. Table 6.6. Distribution of Children (0-59 months) by Type of Immmunization Vacinne, Age in Months and Gender Distribution of Children (0-59 months) by Ever and Still Breastfeeding and District. 241. Table 6.7. Distribution of Children (0-59 months) by Length of Breastfeeding Practices and District. 243. Table 6.8. Distribution of Children (0-59 months) by Breastfeeding Practices by Age in months and Gender Distribution of Children (0-59 months) by Type of Programme and District. Table 6.9. 240. 245 246. HOUSEHOLD HEAD CHARACTERISTICS Table 7.1. Distribution of Household Heads by Gender and District. 248. Table 7.2. Distribution of Household Heads by Gender by Area of Residence and Broad Age-Groups. 249. Table 7.3. Distribution of Household Heads by Marital Status and District. 250. Table 7.4. Distribution of Male Household Heads by Marital Status and District. 252. Table 7.5. Distribution of Female Household Heads by Marital Status and District. 254. Table 7.6. Distribution of Literacy Levels of Household Heads by Gender and District. 256. Table 7.7 Table 7.8. Distribution of Literacy Levels of Household Heads by Gender, Area of Residence and Broad Age-groups Distribution of Household Heads who have Ever Attended School by Gender and District. 260. Table 7.9. Distribution of Highest Education Level Completed of Household Heads by District. 262. Table 7.10. Distribution of Highest Education Level Completetd by Male Household Heads and District. 264. Table 7.11. Distribution of Highest Education Level Completetd by Female Household Heads and District. Table 7.12. Distribution of Highest Education Level Completed of Household Heads by Age-group and Gender Distribution of Highest Education Level Completed of Household Heads for Urban Area by Gender and Age-group. Table 7.13. 5. 258. 266 268 270.
(11) Table 7.14 Table 7.15 Table 7.16. Distribution of Highest Education Level Completed of Household Heads for Rural Area by Gender and Age-group Distribution of Household Heads by Ebola awareness and District. 271 273. Table 7.17 Table 7.18. Percentage Distribution of Household Heads by Ebola awareness and Broad Age-groups and Gender Percentage Distribution of Household Heads by Ebola awareness and Area of Residence Percentage Distribution of Household Heads by Work Status and District. 279. Table 7.19. Distribution of Household Heads by Economic Activity Status, Gender and District. 281. Table 7.20. Distribution of Household Heads by Activity Status, Gender and District. 283. Table 7.21 Table 7.22. Distribution of Household Heads of Economically Active by Employmen Status, Gender and District Percentage Distribution of Household Heads by Work Status and Broad Age-groups. 287. Table 7.23. Distribution of Household Heads by Activity Status, Gender and District. 289. Table 7.24. Distribution of Working Household Heads by Employment Sector and District. 290. Table 7.25. Distribution of Working Household Heads by Employment Sector and Broad Age-groups. 292. Table 7.26. Distribution of Working Household Heads by Industry of Activity and District. 293. Table 7.27. Distribution of Working Population Household Heads by Industry of Activity and Broad Agegroups Distribution of Economically Inactive Household Heads by Reason and District. Table 7.28. 275 277. 285. 295 297. HOUSEHOLD AMENITIES AND ASSETS Table 8.1. Distribution of Households by Ownership and District. 299. Table 8.2. Distribution of Owner-Occupied Households by Tenure and District. 301. Table 8.3. Distribution of Households by Number of Rooms and District. 303. Table 8.4. Table 8.10. Distribution of Households by Main Material Used for Wall Construction of the House and District Distribution of Households by Main Material Used for Roof Construction of the House and District Distribution of Households by Main Material Used for Floor Construction of the House and District Distribution of Households by Improved Water Source, Main Source of Drinking Water and District Distribution of Households By Access to Water, Time Taken to Water Supply (One way) and District Distribution of Households by Non-wood Fuel Use, Main Source of Fuel for Cooking and District Distribution of Households by Main Type of Toilet and Sharing Arrangements and District. 319. Table 8.11. Distribution of Households by Main Source of Fuel for Lighting and District. 320. Table 8.12. Distribution of Households by Source Place of Main Cooking Fuel and District. 323. Table 8.13. Distribution of Households by Location of Cooking Place in Household and District. 325. Table 8.14. Table 8.16. Distribution of Households by Improved Garbage Disposal, Type of Main Waste Disposal and District Distribution of Households by Improved Garbage Disposal, Type of Main Waste Disposal and District Distribution of Households by Type of Main Liquid Disposal and District. Table 8.17. Distribution of Households Owning Assets by District. Table 8.5 Table 8.6 Table 8.7 Table 8.8 Table 8.9. Table 8.15. 6. 305 307 309 311 314 316. 327 329 332 334.
(12) ACCESS TO SOCIAL AMENITIES Table 9.1. Distribution of Households By Access and Time Taken to Nearest Primary School and District. Table 9.2. Distribution of Households By Access and Time Taken to Nearest Secondary School and District Distribution of Households By Access and Time Taken to Nearest Health Clinic and District. Table 9.3 Table 9.4 Table 9.5 Table 9.6. Distribution of Households By Access and Time Taken to Nearest Hospital and District Distribution of Households By Access to Water, Time Taken to Nearest Supply of Drinking Water and District Distribution Households By Access and Time Taken to Nearest Post Office and District. Table 9.7. Distribution of Households By Access and Time Taken to Nearest Public Transport and District. Table 9.8. Distribution of Households By Access and Time Taken to Nearest Food Market and District. Table 9.9. Distribution of Households By Access and Time Taken to Nearest All Seasons Road and District Distribution of Households By Access and Time Taken to Nearest Police Station and District. Table 9.10. 340 342 344 346 348 350 352 354 356 358. HOUSEHOLD PERCEPTIONS OF WELL-BEING Table 10.1. Distribution of Households by Perceived Poverty Status and District. 360. Table 10.2. Distribution of Households by Income Situation and District. 362. Table 10.3. Distribution of Satisfaction with Household's Financial Situation and District. 364. Table 10.4. Distribution of Households by Difficulty in Satisfying the Food Needs Compared to One Year Ago and District Distribution of Households by Difficulty in Satisfying the School fees Compared to One Year Ago and District Distribution of Households by Difficulty in Satisfying the Health care Compared to One Year Ago and District Distribution of Households of Community Living Standards Over the Last 12 months by District. Table 10.5 Table 10.6 Table 10.8 Table 10.7 Table 10.9 Table 10.10 Table 10.11 Table 10.12 Table 10.13. Distribution of Households of Perceived Poverty in relation to other households in Community by District Distribution of Households by Who Household Can Depend to Provide Assistance in Times of Need and District Distribution of Households who Stated that Poverty Reduction is a Government Priority by District Distribution of Households by Most Important measures that the Government should Take to Improve Households Living Standards and District Distribution of Households by Second Important measures that the Government should Take to Improve Households Living Standards and District Distribution of Households by Membership of Various Associations and District. 366 368 370 372 374 376 378 380 383 386. VIOLENCE, CRIME AND SAFETY Table 11.1 Table 11.2. Distribution of Households that Experienced any Crime in the Last 5 years by Type of Crime and District Distribution of Households by Level of Violence in Community and District. 390. Table 11.3. Distribution of Households by Perceptions of Safety Walking in the Street at Night by District. 392. Table 11.4 Table 11.5. Distribution of Households Confidence in State Authorities to Protect them from Crime and Violence and District Distribution of Households with Neighbourhood Watch Systems and District. 396. Table 11.6. Distribution of Households by Major Cause of Conflict in Community and District. 398. 7. 388. 394.
(13) Table 11.7 Table 11.8. Distribution of Households by Perceptions of How Easy/Difficult to obtain Assistance from Police and District Distribution of Households by Access to Contact of Courts and District. 402. Table 11.9. Distribution of Households by Trust in Police and District. 404. Table 11.10. Distribution of Households by Trust in The Court of Law and District. 406. 400. MIGRATION Population 5 years and above Table 12.1. Distribution of Population (5 years and above) by Migration Status and District. 408. Table 12.2. Distribution of Population (5 years and above) by Internal, External Migration and District. 411. Table 12.3. Distribution of Population (5 years and above) by Primary Reason for Departure from Previous Location and District. 413. Population 15 years and above Table 12.4. Distribution of Population (15 years and above) by Migration Status and District. 419. Table 12.5. Distribution of Population (15 years and above) by Internal, External Migration and District. 422. Table 12.6. Distribution of Population (15 years and above) by Primary Reason for Departure from Previous Location and District Youth 15-35 years (country definition). 424. Table 12.7. Distribution of Youth (15-35 years) by Migration Status and District. 430. Table 12.8. Distribution of Youth (15-35 years) by Internal, External Migration and District. 433. Table 12.9. Distribution of Youth (15-35 years) by Primary Reason for Departure from Previous Location and District. 435. TRANSFERS Table 13.1 Table 13.2. Distribution of Households that Received Transfers From HH Member/Non-HH Member by District Distribution of Population that Received Transfers by Sender's Residence and District. 443. Table 13.3. Distribution of Population that Received Transfers by Regularity of Transfers and District. 445. Table 13.4. Distribution of Households that Made Out Transfers by District. 447. Table 13.5. Distribution of Population that Made Out Transfers by Receiver's Residence and District. 449. Table 13.6. Distribution of Population that Made Out by Regularity of Transfers and District. 451. Table 14.1. Distribution of Households by Access to Credit, Reason for not Borrowing and District. 453. Table 14.2. Distribution of Population Who had Access to Credit by Source of Credit and District. 455. Table 14.3. Distribution of Loans Received by Main Purpose and District. 457. Table 14.4. Distribution of Loans Received by Type of Collateral (Guarantee) and District. 459. Table 14.5. Distribution of Households for which a Loan was Denied and District. 463. Table 14.6. Distribution of Population Who were Denied Credit by Main Reason Denied and District. 465. Table 14.7. Distribution of Households by Savings and/or Osusu Account and District. 467. Table 14.8. Distribution of Population With a Savings or Osusu Account by District. 469. Distribution of Households by Type of Envrionmental Messages Received Last 12 Months and District. 470. 441. CREDIT. ENVIRONMENT Table 15.1. 8.
(14) Table 15.2 Table 15.3. Distribution of Households by Belief that the Authorities are Doing Enough to Arrest Environmrntal Concerns and District Distribution of Households by How to Stop Destruction of Forests and District. 475. Table 15.4. Distribution of Households by Quality of Air, Source of pollution and District. 478. Table 15.5 Table 15.6. Distribution of Households by Quality of Household Drinking Water and District Distribution of Households by Cause of Disaster Last 12 months and District. 481 484. Table 15.7. Distribution of Households by Severity of Disaster Last 12 months and District. 487. Table 15.8. Distribution of Households by Coping Mechanism in Time of Need and District. 489. 473. GOVERNANCE Table 16.1 Table 16.2. Distribution of Households by Awareness of the National Council for Civic Education (NCCE) and District Distribution of Households by Source of Informtion of NCCE Messages and District. 494. Table 16.3. Distribution of Households by Awareness of the Office of the Ombudsman and District. 496. Table 16.4. Table 16.6. Distribution of Households by Main Reason for Lack of Independence of the Office of the Ombudsman and District Distribution of Households by Awareness of the Alternative Dispute Resolution Secretariat (ADRS) and District Distribution of Households by Most Important Ward Need and District. 502. Table 16.7. Distribution of Households by Perception of the Election Processes and District. 505. Table 16.8. Distribution of Households by Awareness of Government Poliy documents and District. 507. Table 16.5. 491. 498 500. AGRICULTURE Table 17.1 Table 17.2. Distribution of Households Engaged in Crop Farming, Production, Processing and Use of Inputs for Crops Last 12 Months by District Distribution of Farmed Land Parcels by Tenure System and District. 512. Table 17.3. Distribution of Land Parcel by Current Primary Use of Parcel and District. 514. Table 17.4. Distribution of Households That Engaged in irrigation, Source of Water for Irrigation and Method of Water Abstarction for Irrigation by District Distribution of Households That Used Fertilizer, Type of Fertilizer and Source of Fertilizer by District Distribution of Households That Engaged in Livestock Farming, and Use of Inputs for Livestock Last 12 Months by District Distribution of Households That Engaged in Livestock Farming Last 12 Months and Type of Livestock by District. Table 17.5 Table 17.6 Table 17.7. 509. 516 519 522 524. KEY BASIC CHARACTERISTICS OF TABLES COMPARING 2010 and 2015 Table 18.1. Distribution of Population by Gender and Region, 2010 and 2015. 526. Table 18.2. Distribution of Households by Household Composition (size), 2010 and 2015. 527. Table 18.3. Distribution of Population Structure by Broad Age-groups and Region, 2010 and 2015. 528. Table 18.4. Distribution of Population (12 years and above) by Marital Status and District. 529. Table 18.5. Distribution of Adult (15 years and above) Literacy Levels by Gender and Region, 2010 and 2015 Distribution of Adult (15 years and above) Literacy Levels by Area of Residence and Broad Age-groups Distribution of Male Adult (15 years and above) Literacy Levels by Area of Residence and Broad Age-groups. Table 18.6 Table 18.7. 9. 530 531 532.
(15) Table 18.8 Table 18.9 Table 18.10 Table 18.11 Table 18.12 Table 18.13 Table 18.14 Table 18.15 Table 18.16 Table 18.17 Table 18.18 Table 18.19 #REF! Table 18.22. Distribution of Female Adult (15 years and above) Literacy Levels by Area of Residence and Broad Age-groups Distribution of Youth (15-24 years) Literacy Levels by Gender and Region (international definition), 2010 and 2015 Distribution of Youth (15-24 years) Literacy Levels by Area of Residence, Gender and Single Ages (international definition) Distribution of Youth (15-35 years) Literacy Levels by Gender and Region (country-definition), 2010 and 2015 Distribution Population (15 years and above) who Can do Simple Calculations by Gender and Region, 2010 and 2015 Distribution Population (3 years and above) Who Have Ever Attended School by Gender and Region, 2010 and 2015 Distribution of Children (3-18 years) by School Attendance, Gender and Region, 2010 and 2015 Distribution of Children (3-18 years) by School Attendance, Gender, Age-groups and Region, 2010 and 2015 Distribution Population (3 years and above) by Highest Level of Education Completed and Region, 2010 and 2015 Distribution Male Population (3 years and above) by Highest Level of Education Completed and Region, 2010 and 2015 Distribution Female Population (3 years and above) by Highest Level of Education Completed and Region, 2010 and 2015 Distribution of Children (3 years and above) Currently Attending School by Who Runs and Manages the School and Region, 2010 and 2015 #REF!. 533 534 535 537 538 539 540 541 542 543 544 545 547 548. Table 18.24. Distribution of Population Who Were Sick by Type of Health Practitioner Consulted (Use) and Region, 2010 and 2015 Distribution of Population by Access to a Health Facility Within 30 minutes of Residence and Region, 2010 and 2015 Distribution of Women (15-49 years) by Children Ever Born and Living by District. 551. Table 18.25. Distribution of Women (15-49 years) by Children Ever Born and Living by Age-groups. 552. Table 18.26. Distribution of Population (7 years and above) by Economic Activity Status, Gender and District. 553. Table 18.27. Distribution of Population (15-64 years) by Economic Activity Status, Gender and District. 554. Table 18.28. Distribution of Youth Population (15-35 years) by Economic Activity Status, Gender and District. 555. Table 18.29. Distribution of Working Population (7 years and above) by Industry of Activity and Region, 2010 and 2015 Distribution of Working Population (15-64 years) by Industry of Activity and Region, 2010 and 2015 Distribution of Working Population (15-35 years) by Industry of Activity and Region, 2010 and 2015 Distribution of Household Heads by Gender and Region, 2010 and 2015. Table 18.21. Table 18.30 Table 18.31 Table 18.32 Table 18.33. 549 550. 556 557 558 559. Table 18.34. Distribution of Household Heads by Gender by Area of Residence and Broad Age-Groups, 2010 and 2015 Distribution of Household Heads by Marital Status and Region, 2010 and 2015. 561. Table 18.35. Distribution of Literacy Levels of Household Heads by Gender and Region, 2010 and 2015. 562. Table 18.36. Distribution of Literacy Levels of Household Heads by Gender, Area of Residence and Broad Age-groups Distribution of Highest Education Level Completed of Household Heads by Region, 2010 and 2015. Table 18.37. 10. 560. 563 564.
(16) Table 18.38 Table 18.39 Table 18.40 Table 18.41 Table 18.42. Distribution of Highest Education Level Completed of Household Heads by Gender and Region, 2010 and 2015 Distribution of Households by Housing Occupany Status and Region, 2010 and 2015 Distribution of Households by Improved Water Source, Main Source of Drinking Water and Region, 2010 and 2015 Distribution of Households by Main Type of Toilet and Region, 2010 and 2015. 565 566 567 568. Table 18.43. Distribution of Households by Non-wood Fuel Use, Main Source of Fuel for Cooking and Region, 2010 and 2015 Distribution of Households by Source Place of Main Cooking Fuel and District, 2010 and 2015. 570. Table 18.44. Distribution of Households by Main Source of Fuel for Lighting and Region, 2010 and 2015. 571. 11. 569.
(17) Preface The Integrated Household Survey (IHS) is one of the two major household surveys alongside Multiple Indicator Cluster Survey (MICS) that are regularly conducted by the Gambia Bureau of Statistics (GBoS). Several surveys have been undertaken on household income and expenditure but the first and second IHSs were conducted in 2003/04 and 2010/11 respectively while the third round was conducted in (2015/16). The results of the survey has been the key input in the measurement of poverty at the national level as well as providing valuable information in the evaluation of changing conditions in households. These surveys have provided government and all stakeholders with indicators (mostly on poverty and vulnerability) to enable evidence-based policy formulation and monitor the progress towards national and international development frameworks. The First Integrated Household Survey was designed and conducted by the National Statistics Office (then Central Statistics Department) with technical and financial assistance from World Bank (WB) under the Capacity Building and Economic Management Project (CBEMP). The second IHS which was designed and conducted by GBoS with technical and financial support from the United Nations Development Programme (UNDP) made provision for important data on household income, consumption expenditure and pattern at national and urban/rural levels. It is important, however, to note that both the earlier IHSs were representative at the Local Government Area (LGA). The primary objective of the IHS2015/16 was to monitor the determinants of poverty and its dynamics, assist the Gambia Government and stakeholders with the necessary socio-economic data for poverty monitoring and policy formulation. The survey also provides weights to rebase the Consumer Price Index (CPI) and the much needed household data to update the System of National Accounts (SNA) from SNA1993 to SNA2008. The IHS205/16 cannot come at a better time as the country is on the verge of completing the mid-term national development blueprint that will guide the government and its development partners. It is also the first major household survey that is finalized after the approval of the SDG indicators as well as Agenda 2063. These are both international frameworks to which Gambia has subscribed. Therefore, the IHS2015/16 will supply valuable information on the status, and dynamics of poverty of household and individuals. It will also offer further information on other socio-economic variables. The added advantage of this survey is the availability of estimates for indicators at a micro level than the previous IHSs as the sampling was done at a lower level (district level sampling). This provides government and stakeholders with better understanding of the social variables at district level compared to other previous household survey. The IHS 2005/2016 also provides a basis for the conduct of future surveys in terms of content and coverage. While the questionnaire is open to updates and adjustments, it was design in a very comprehensive manner so that other similar surveys could be built from it, as it deals with a wide range of topics covering many sectors and arising issues. Notwithstanding, specific issues on Women and Children as well as mortality and irregular migration was not discussed. GBoS has had constant technical support from World Bank throughout the design and implementation of the survey as part of the pledges made by them. This is part of World Bank’s objective to support sub-Sahara African countries in providing technical and financial support in implementing national representative surveys covering valuable topics, monitor poverty and other social indicators. The financial support for this round of IHS mainly came from The Government of The Gambia, World Bank, UNDP, UNICEF, FAO, WFP and WHO. Nyakassi M. B. Sanyang Statistician General Gambia Bureau of Statistics, Gambia 12.
(18) Acknowledgments The Gambia Bureau of Statistics presents the results of the third Integrated Household Survey (IHS2015/16) that will facilitate monitoring and evaluation of different policies and programs at both district and national levels. This is the first survey that provides poverty profile at the district level in The Gambia and will better inform the finalization of the national development plan. It is also the first detailed household survey completed after the approval of the SDG indicators as well as the African Agenda 2063. In order to support evidence-based decision and planning processes with more frequent and reliable statistics, the frequency of IHS is now going to be three years instead of five. This is an ambitious target that we are committed to achieve in collaboration with our stakeholders. this regard, we present our sincere appreciation to the Government of The Gambia for its support for statistics development in the country, the Ministry of Finance and Economic affairs, and other Government Ministries, Departments and Agencies for the facilitation that we received in this endeavor and in other similar efforts. We express our sincere appreciation to World Bank that has provided constant technical and financial support throughout the design, implementation and analysis of the IHS2015/16. We equally wish to thank the United Nations Development Programme (UNDP) for its continued support. Special gratitude also goes to other UN agencies such as United Children’s Fund (UNICEF), World Food Programme (WFP), World Health Organisation (WHO) and Food and Agriculture Organisation (FAO). Their contribution was of immense importance to the effective accomplishment of the survey. We would also like to thank the IHS2015/16 management team and the entire staff of GBoS for their effort throughout the planning and implementation stages. We also appreciate the valuable collaboration from all survey respondents.. 13.
(19) Definition of Concepts · Region: There are eight Local Government Areas (LGA) in Gambia. District: The country is demarcated into 42 districts. The boundaries of the districts do not necessarily conform to · the boundaries of the local authorities but conform with regional boundaries. Districts are the lower-level divisions from regions. Urban: According to the 2013 Population and Housing Census, a settlement is considered to be urban if it satisfies · most of the following: Has commercial importance Has institutional importance Majority of the population’s occupation is non-agricultural Total population is at least 5,000 Population density is high Some degree of infrastructure is available DEMOGRAPHIC CHARACTERISTICS · Population defined here is not the CENSUS definition (de facto count). Population referred here are only persons living in households and excludes persons in Institutions, streets, etc. · Dependency ratio: population age 0-14 and population age >= 65 / population age 15-64 · Child: The UN Convention on the Rights of the Child (CRC) defines a child as a boy or girl under the age of 18 and considers a child as both an individual as well as a member of a family and a community. This definition is adopted in this report. EDUCATION · Official school enrolment age ranges from 3 to 6 years in Early Childhood Education, 7 to 12 years in Lower Basic education; 13 to 15 years in Upper Secondary education and 16 to 18 years in Senior Secondary education establishments. · Adult Literacy is defined for persons age 15+ years who can both read and write in any language. · Youth Literacy (international)is defined for persons age 15-24 years who can both read and write in any language. · Youth Literacy (country) is defined for persons age 15-35 years who can both read and write in any language. The National Youth Policy (2009-2018) defines a youth as someone whose age is between 13 and 30 years. This was revised to 15-35 years in 2016. · Access to school is defined as children currently in school with less than 30 minutes to school. · Primary school estimates are defined for children aged 7 to 12 years. · Primary Gross Enrollment Ratio (GER) is defined for children currently in primary school (P1 to P6) irrespective of age. · Primary Net Enrolment Ratio is defined for children currently in primary school (P1 to P6) of primary school age (712 years). · Secondary school estimates are defined for children aged 13 to 18 years. · Secondary Gross Enrollment Ratio (GER) is defined for children currently in secondary school (JSS1 to JSS3 and SSS1 to SSS4) irrespective of age. · Secondary Net Enrollment Ratio (NER) is defined for children currently in secondary school (JSS1 to JSS3 and SSS1 to SSS4) of secondary school age (13-18 years). · Satisfaction is defined for children of all ages currently in primary or secodnary school who cited no problems with school. · Tertiary school estimates are defined for children aged 19 to 22 years.. 14.
(20) · Tertiary Gross Enrollment Ratio (TER) is defined for children currently in Teacher Training, Nursing and Tertiary of all ages. · Tertiary Net Enrollment Ratio (TER) is defined for children currently in Teacher Training, Nursing and Tertiary of school age (19-22 years). · Overall Enrollment (net) is defined for children currently in school of school age (7-22 years). · Overall Enrollment (gross) is defined for children currently in school of all ages. · Gender Parity Index (GPI): A value of 1 in the GPI indicates that there are no disparities between males and females. Values below 1 indicate disparities favouring males, and above 1, disparities favouring females. HEALTH · · · ·. Access is defined for persons less than 30 minutes from a health facility. Need is defined for persons sick or injured in the four-week period preceding the survey. Use is defined for persons who consulted a health practitioner in the four-week period preceding the survey. Satisfaction is defined for persons who consulted a health practitioner in the four week period preceding the survey who cited no problems.. EMPLOYMENT · Unemployment is defined as persons who were unemployed and unable to find work in the seven days preceding the survey. · CHILD NUTRITION · Delivery by health professionals is defined for children aged 5 years and under whose births were assisted by a doctor, nurse or midwife. HOUSEHOLD HEAD CHARACTERISTICS · Household Head: Is defined as the person in the household recognized as the head by other household members. This is generally the person responsible for the upkeep and maintenance of the household. In his/her absence, the person who takes charge of the household is considered a "temporary head". All household relationships are defined with reference to the head or temporary head. HOUSEHOLD AMENITIES AND ASSETS · Access to improved water sources is defined as having piped water in the dwelling, public outdoor tap, borehole and protected well. · Access to improved sanitation is defined for households using a flush toilet, covered pit latrine, VIP. · Access to improved waste disposal is defined for households that have their refuse collected or use a public dump. · Non-wood fuel for cooking is the use of any fuel other than firewood and charcoal for cooking. ACCESS TO AMENITIES · Access is having the nearest specified facility, i.e. primary school, secondary school, health facility, water source, telecommunication facility, public transport and food market, within 30 minutes from the household. HOUSEHOLD PERCEPTIONS OF WELL-BEING · Difficulty meeting food needs is defined for households that reported difficulty meeting food needs often or always. · Household economic situation compared to one year ago: Worse is defined for households that replied much worse now or a little worse now; better is defined for households that replied a little better now or much better now.. 15.
(21) Special Notes Concerning Survey All percentages are weighted (grossed up) unless otherwise stated. To obtain national estimates, the sample figures had to be grossed up by the appropriate factor (weighting coefficient). Because of the effects of rounding, percentages may not always add exactly to 100. For the some reasons estimated numbers may not add exactly to the estimated totals shown in the table. "N" implies the weighted sample size (number of observations) by the various dimensions such as population, gender, ruralurban, etc of the analyses. 0.0 means .. or negligible Percentages add up to 100 unless otherwise stated. Missing information is not imputed.. The tables refer to IHS 2015/16 unless specified.. 16.
(22) Introduction The international discussion on the need for more and better data for policymaking has reached an almost unprecedented level. International agreements on the Millennium Development Goals (MDGs) and country-level Poverty Reduction Strategies such as the current Programme for Accelerated Growth and Employment (PAGE) have focused attention on the statistical systems that must produce the data to measure progress on the MDGs and National Development Plans. To this end, the role and importance of household surveys in the Statistical System cannot be overemphasized. Household surveys are not only the source of specific types of data required for effective policy making but also they offer the most reliable information for targeted interventions. The proposed project encompasses, among other features: the design and implementation of a household survey focusing on household income and expenditure which feeds into poverty analysis, CPI construction, and update of household expenditures section within National Accounts. The project is also expected to provide a detailed agricultural productivity analysis and serve as baseline data for the successor of “PAGE” and data to assess the progress thus far. Other components of this project include capacity building and cross-country knowledge sharing, alongside efforts to improve survey methodologies in The Gambia. Objective of the Survey A socioeconomic survey is one of the most important sources of statistical data on household expenditure and income as well as for other data on housing status, individual and household characteristics, and living conditions. Not only do they provide indicators to measure specific economic and social issues, but they also provide information that makes it possible to know and explain the determinant or causal factors behind the behaviour of such issues. Several income and expenditure survey have been conducted snce 1989. The 2015/16 Integrated Household Survey (IHS) will be the third conducted in The Gambia. The first IHS was conducted in 2003 and the second was in 2010. In the 2003 IHS the daily diary, which was intended to record current expenditure for one full month was actually administered to half of the sample of the 4,800 households and for more than half of this sub-sample the diaries were administered during a shorter period. This was due to many problems met in the collection such as the low literacy levels in the households and weaknesses during the data collection. This was the reason why the 2010 IHS used recall where the enumerator recorded purchases during the interview. The 2015/16 IHS will use a similar approach as in 2010. This survey is important because it will provide The Gambia Government with comprehensive information on the socio-economic status of the population and to enable government to monitor the determinants of poverty and its dynamics. Thus, information from the IHS can be used to assess the current levels of differentials among population and to evaluate basic household needs in key sectors such as drinking water, energy, schooling, health facilities, sanitation, employment and other sectors. The specific objectives of the 2015/16 IHS includes: · To provide a database that allows for end time analysis of national level government policies embedded within the PAGE. · To understand the poverty dynamics across the country and factors influencing them. · To obtain in depth understanding on the living standards of households to livelihood strategies and measures of income diversification. · To get information on household expenditure patterns in order to update the National Accounts. · To obtain a new set of weights for the basket of goods and services that allow for upgrading the Consumer Price Index (CPI). · To build capacity and development of sustainable systems for the production of accurate and timely information on households in The Gambia. A number of training activities are envisaged under this project such as a STATA workshop, household survey design and management, and study tours for poverty analysis. 17.
(23) Sample Design Coverage. The whole country was covered concurrently during the entire survey period, spreading over twelve months and divided into four sub-samples representing seasonal/ quarterly variation. Sampling plan. A two-stage probability proportional to size (PPS) stratified random sampling (size being number of households per EA) without replacement was adopted. At each stage, sub-samples of equal size were independently drawn without replacement. Sampling units were selected for each sub-sample with simple random sampling without replacement. Each survey period (a quarter – 3 months) was allocated one sub-sample. Local Government Area and District corresponds to the survey Stratum. Enumeration Areas (EAs) were taken as the first stage units whilst 20 households within EAs were selected as the second stage units. Sampling Frame. For the first stage selection, the 2013 Census EA list was used as the frame. The available information about the EAs are the EA boundaries with the number of household size. In the second stage, all the EAs selected were combed by a listing of households exercise by an individual enumerator for subsequent household selection.. First Stage Stratification Except for Kanifing LGA which does not have district connotation per se, EAs were stratified according to districts for the other seven LGAs. The actual sample size was 600 EAs (13,000 households) but due to rounding up the sample increase to 605 EAs. 10 districts have less than 4 EAs and to be able to capture the sessional variation in them they are adjusted to 4 EAs. A total of 22 EAs were added to the sample. The final sample is about 622 EAS (12,440 households). A total of 44 (district) first stage strata including Kanifing were determined. Taking into consideration the available resources and manpower, 622 EAs consisting of four sub-samples of 155.5 EAs each was covered during the entire survey period of twelve months. Thus, each phase (a quarter – 3 months) of the survey was allocated 155.5 EAs. Second Stage Sample Again, the available resources dictated a sample size of 12,440 households. It required twelve teams constituting twelve (12) supervisors and seventy (70) enumerators each were assigned to different geographical locations, taking into account social and cultural considerations amongst others. Each enumerator covered a total of 259. Seventeen (17) households in each phase of a three-month period corresponding to 12.96 EAs. Each team will be allocated about 4.32 EAs or 86.38 households per month. Twenty (20) households per EA were selected with simple random sampling without replacement - all of which part one and part two questionnaires were administered. Survey Instruments The Gambia Integrated Household Survey (IHS) 2015/16 adopted a house-based questionnaire. To ensure concise responses for the interviews, pre-coded multiple-choice response questions were used. These include:Part 1: Household Questionnaire SECTION 0: HOUSEHOLD PARTICULARS SECTION 1: HOUSEHOLD ROSTER SECTION 2A: HEALTH GENERAL SECITON 2B: EBOLA AWARENESS 18.
(24) SECTION 2C: HEALTH DISABILITY SECTION 2D: HEALTH SMOKING SECTION 2E: HEALTH CHILD HEALTH SECTION 2F: HEALTH FERTILITY SECTION 3A: EDUCATION GENERAL SECTION 3B: EDUCATION EXPENDITURE SECTION 3C: EDUCATION LITERACY SECTION 3D: EDUCATION TRAINING SECTION 4A: LABOUR FORCE PARTICIPATION SECTION 4B: UNEMPLOYMENT SCREENING SECTION 4C: LABOUR OVERVIEW LAST 7 DAYS SECTION 4D: MAIN JOB SECTION 4E: SECONDARY JOB SECTION 4F: JOB LAST 12 MONTHS IF DIFFERENT FROM EITHER PRIMARY OR SECONDARY JOB SECTION 5: MIGRATION SECTION 6: DECISION MAKING SECTION 7A: CREDIT RECEIVED SECTION 7B: CREDIT DENIED SECTION 7C: SAVINGS SECTION 8A: HOUSING SECTION 8B: HOUSING EXPENSES SECTION 9: OWNERSHIP OF DURABLE ASSETS SECTION 10: ENVIRONMENT SECTION 11: GOVERNANCE SECTION 12A: TRANSFERS RECEIVED SECTION 12B: TRANSFERS GIVEN OUT SECTION 13: SUBJECTIVE POVERTY SECTION 14: ACCESS TO THE NEAREST SOCIAL AMENITY SECTION 15A: CRIME AND SECURITY HOUSEHOLD MEMBERS SECTION 15B: CRIME AND SECURITY COMMUNITY SECTION 16: IDENTIFICATION OF RESPONDENTS FOR PART 2 Part 2: Household Consumption and Expenditure SECTION 1A: FOOD CONSUMPTION EXPENDITURE SECTION 1B: FOOD CONSUMPTION EXPENDITURE SECTION 2A: NON FOOD LAST SEVEN DAYS SECTION 2B: NON FOOD LAST 1 MONTH SECTION 2C: NON FOOD LAST 3 MONTHS SECTION 2D: NON FOOD LAST 12 MONTHS SECTION 3A: AGRICULTURE HOLDING SECTION 3B: CROP PRODUCTION SECTION 3C: TRANSFORMATION (PROCESSING) OF AGRICULTURAL PRODUCTS SECTION 3D: CROP COSTS AND EXPENSES SECTION 3E: LIVESTOCK SECTION 3F: LIVESTOCK AND FISHING COSTS AND EXPENSES SECTION 4A: HOUSEHOLD INCOME SECTION 4B: MISCELLANEOUS INCOME SECTION 4C: MISCELLANEOUS EXPENDITURES SECTION 5: NON AGRICULTURAL HOUSEHOLD ENTERPRISES 19.
(25) Part 3: Community Questionnaire Part 4: Price questionnaire Field Organization Training Field staff The training of interviewers was guided by an interviewer’s manual. This involved comprehensive and systematic explanations on: the structure and content of the survey questionnaire; basic concepts and definitions to be applied in the execution of the survey data collection exercise; interactive discussions; simulated field trials; mock interviews. Fieldwork The data collection exercise for the main survey commenced on end April 2015 and ended on May 2016. Sixtyone teams were involved in the fieldwork which comprised a team of one supervisor, three interviewers and one driver. In addition, there were two standby supervisors and six interviewers. As a quality control measure and also boost the morale of the field staff, both scheduled and unannounced extended/extensive field trips were made by the senior project management personnel to check on the logistics, quality and progress of work. Data Capture and Processing The questionnaires were processed in batches with questionnaires from each Enumeration Area (EA) being considered as a single batch. This made it easier to manage the image and also allow the operator to capture all the necessary information about an EA. Editing took three different forms:Manual editing was carried out to ensure that the reference number which was composed of the EA number, Household number and Questionnaire number, was correct and that it was printed out on all pages on the set of questionnaire.. 20.
(26) Table 1.1 Effective Sample Size by District. THE GAMBIA. Census number of households. Effective sample size. 217,610. 13,281. Urban. 3,335. Rural. 9,946. Banjul City Urban. Census number of households. 6,643. 357. 6,643. 357. Kanifing Municipal Urban. 60,103. 420. 60,103. 420. Brikama Kombo North. 82,006. 2,939. 43,661. 400. Kombo South. 11,833. 380. Kombo Central. 15,876. 380. 4,366. 360. Basse Jimara. Kombo East. Janjanbureh Niamina Dankunku. Effective sample size. 11,849. 1,673. 648. 240. Niamina West. 752. 260. Niamina East. 2,439. 340. Lower Fuladu West. 3,262. 333. Upper Fuladu West. 4,318. 360. Janjanbureh. 430. 140. 15,819. 2,201. 2,591. 340. Foni Brefet. 1,509. 300. Basse. 5,215. 360. Foni Bintang. 1,788. 320. Tumana. 2,105. 320. Foni Kansalla. 1,562. 300. Kantora. 1,846. 320. 721. 259. Wuli West. 1,364. 298. 690 9,668. 240 1,798. Wuli East Sandu. 1,300 1,398. 296 267. Kiang West. 1,784. 319. Kiang Cental. 1,056. 280. Kiang East. 750. 259. Jarra West. 3,527. 340. 919. 280. Foni Bundali Foni Jarrol Mansakonko. Jarra Central Jarra East. 1,632. 320. Kerewan Lower Niumi. 22,609. 2,317. 6,386. 360. Upper Niumi. 2,763. 320. Jokadu. 2,011. 319. Lower Badibu. 1,893. 320. Central Badibu. 2,019. 320. Illiasa Sabach Sanjal. 5,514. 359. 2,023. 319. Kuntaur Lower Saloum. 8,913. 1,576. 1,614. 320. Upper Saloum. 1,731. 319. 949. 280. 2,613 2,006. 337 320. Nianija Niani Sami. Yellow parts needs to be fixed by Mohammed. 21.
(27) Table 1.2 Sample Size for the Gambia Integrated Household Survey (IHS) No. of Clusters. THE GAMBIA. No. of Households. Urban. Rural. Total. Total Number of Respondents. Urban. Rural. Total. Urban. Rural. Total. 9,946. 13,281. 20,703. 85,094. 105,797. 3,335. 20,703. 167. 500. 667. 3,335. Urban. 167. ... ... 3,335. Rural. ... 500. 667. Banjul City. 18. -. 18. 357. -. 357. 1,469. -. 1,469. Urban. 18. -. 18. 357. -. 357. 1,469. -. 1,469. 21. -. 21. 420. -. 420. 2,306. -. 2,306. Urban. 21. -. 21. 420. -. 420. 2,306. -. 2,306. Brikama. 49. 99. 148. 979. 1,960. 2,939. 6,901. 16,823. 23,724. Kombo North. 18. 2. 20. 360. 40. 400. 2,196. 333. 2,529. Kombo South. 9. 10. 19. 180. 200. 380. 1,267. 1,680. 2,947. 15. 4. 19. 300. 80. 380. 2,225. 744. 2,969. 2. 16. 18. 40. 320. 360. 361. 2,519. 2,880. 15. 15. -. 300. 300. -. 2,534. 2,534. Kanifing Municipal. Kombo Central Kombo East Foni Brefet. -. 9,946. 9,946. 20,703 85,094. 85,094. Foni Bintang. 3. 14. 17. 59. 261. 320. 536. 2,480. 3,016. Foni Kansalla. 2. 13. 15. 40. 260. 300. 316. 2,066. 2,382. Foni Bundali. -. 13. 13. -. 259. 259. -. 2,604. 2,604. Foni Jarrol. -. 12. 12. -. 240. 240. -. 1,863. 1,863. 9. 81. 90. 180. 1,618. 1,798. 1,068. 11,497. 12,565. Kiang West. -. 16. 16. -. 319. 319. -. 2,153. 2,153. Kiang Cental. -. 14. 14. -. 280. 280. -. 2,077. 2,077. Kiang East. -. 13. 13. -. 259. 259. -. 1,959. 1,959. 8. 17. 180. 160. 340. 1,068. 1,096. 2,164. 14. 14. -. 280. 280. -. 1,841. 1,841. Mansakonko. Jarra West Jarra Central Jarra East Kerewan Lower Niumi. 9 -. 16. 16. 320. 320. -. 2,371. 2,371. 26. 90. 116. 519. -. 1,798. 2,317. 3,671. 15,983. 19,654. 9. 9. 18. 180. 180. 360. 1,079. 1,437. 2,516. Upper Niumi. -. 16. 16. -. 320. 320. -. 2,746. 2,746. Jokadu. -. 16. 16. -. 319. 319. -. 2,786. 2,786. 11. 16. 100. 220. 320. 569. 2,076. 2,645. Lower Badibu. 5. Central Badibu. -. 16. 16. -. 320. 320. -. 2,744. 2,744. Illiasa. 12. 6. 18. 239. 120. 359. 2,023. 1,198. 3,221. Sabach Sanjal. -. 16. 16. -. 319. 319. -. 2,996. 2,996. 6. 73. 79. 120. 1,456. 1,576. 728. 13,416. 14,144. 5. 11. 16. 100. 220. 320. 623. 1,971. 2,594. Kuntaur Lower Saloum Upper Saloum. -. 16. 16. -. 319. 319. -. 3,052. 3,052. Nianija. -. 14. 14. -. 280. 280. -. 2,499. 2,499. 16. 17. 20. 317. 337. 105. 2,742. 2,847. 16. 16. -. 320. 320. -. 3,152. 3,152. Niani Sami. 1 -. 22. cont'd.
(28) Table 1.2 Sample Size for the Gambia Integrated Household Survey (IHS) No. of Clusters. Janjanbureh. No. of Households. Urban. Rural. Total. Urban. Total Number of Respondents. Rural. Total. Urban. Rural. Total. 19. 65. 84. 380. 1,293. 1,673. 2,444. 12,148. 14,592. Niamina Dankunku. -. 12. 12. -. 240. 240. -. 1,700. 1,700. Niamina West. -. 13. 13. -. 260. 260. -. 2,407. 2,407. Niamina East. -. 17. 17. -. 340. 340. -. 3,286. 3,286. Lower Fuladu West. 6. 11. 17. 120. 213. 333. 949. 2,662. 3,611. Upper Fuladu West. 6. 12. 18. 120. 240. 360. 648. 2,093. 2,741. Janjanbureh. 7. -. 7. 140. -. 140. 847. -. Basse. 847. 19. 92. 111. 357. -. 357. 2,116. 15,227. 17,343. Jimara. 1. 16. 17. 20. 320. 340. 143. 2,310. 2,453. 259. 1,795. Basse. 16. 2. 18. 320. 40. 360. 1,536. Tumana. -. 16. 16. -. 320. 320. -. 2,379. 2,379. Kantora. -. 16. 16. -. 320. 320. -. 2,883. 2,883. Wuli West. -. 15. 15. -. 298. 298. -. 2,797. 2,797. Wuli East. -. 15. 15. -. 296. 296. -. 2,677. 2,677. 12. 14. 40. 227. 267. 437. 1,922. 2,359. Sandu. 2. Note: Includes all persons listed in survey (both regular and non-regular household members). The analysis from Table 2.1 is based on regular household members.. 23.
(29) Table 2.1 Distribution of Population by Gender and District Male N. THE GAMBIA Urban. N. Female Percent. N. Percent. Gender ratio. Mean household size. 1,922,950. 915,357. 47.6. 1,007,593. 52.4. 91. 6.9. 1,057,467. 503,304. 47.6. 554,163. 52.4. 91. 6.0. Rural. 865,483. 412,053. 47.6. 453,430. 52.4. 91. 8.4. Banjul City. 30,703. 15,704. 51.1. 14,999. 48.9. 105. 4.1. Urban Kanifing Municipal. 30,703 383,545. 15,704 179,016. 51.1 46.7. 14,999 204,529. 48.9 53.3. 105 88. 4.1 5.5. Urban Brikama. 383,545 730,895. 179,016 354,559. 46.7 48.5. 204,529 376,336. 53.3 51.5. 88 94. 5.5 7.0. Kombo North. 360,147. 172,963. 48.0. 187,184. 52.0. 92. 6.3. Kombo South. 113,315. 55,717. 49.2. 57,598. 50.8. 97. 7.7. Kombo Central. 148,599. 73,329. 49.3. 75,270. 50.7. 97. 7.8. Kombo East. 44,874. 21,802. 48.6. 23,072. 51.4. 94. 8.0. Foni Brefet. 15,412. 7,412. 48.1. 8,000. 51.9. 93. 8.5. Foni Bintang. 18,167. 8,855. 48.7. 9,312. 51.3. 95. 9.3. Foni Kansalla. 14,990. 6,947. 46.3. 8,042. 53.7. 86. 7.9. Foni Bundali. 8,089. 4,207. 52.0. 3,881. 48.0. 108. 9.9. 7,304 82,201. 3,327 38,437. 45.6 46.8. 3,977 43,764. 54.4 53.2. 84 88. 7.7 6.9. Foni Jarrol Mansakonko Kiang West. 15,204. 7,068. 46.5. 8,137. 53.5. 87. 6.8. Kiang Cental. 8,785. 4,139. 47.1. 4,646. 52.9. 89. 7.7. Kiang East. 6,898. 3,061. 44.4. 3,837. 55.6. 80. 7.3. Jarra West. 26,589. 12,312. 46.3. 14,277. 53.7. 86. 6.4. 8,461. 4,154. 49.1. 4,307. 50.9. 96. 6.6. Jarra Central Jarra East. 16,263. 7,703. 47.4. 8,560. 52.6. 90. 7.3. Kerewan Lower Niumi. 225,516. 105,832. 46.9. 119,684. 53.1. 88. 8.2. 58,498. 27,666. 47.3. 30,832. 52.7. 90. 7.1. Upper Niumi. 31,643. 14,923. 47.2. 16,720. 52.8. 89. 8.1. Jokadu. 22,863. 10,908. 47.7. 11,955. 52.3. 91. 8.8. Lower Badibu. 18,405. 8,318. 45.2. 10,086. 54.8. 82. 8.2. Central Badibu. 19,972. 9,289. 46.5. 10,683. 53.5. 87. 8.8. Illiasa Sabach Sanjal. 49,821. 23,322. 46.8. 26,499. 53.2. 88. 9.0. 24,314. 11,405. 46.9. 12,909. 53.1. 88. 9.4. Kuntaur Lower Saloum. 98,966. 45,959. 46.4. 53,007. 53.6. 87. 9.0. 15,807. 6,898. 43.6. 8,909. 56.4. 77. 8.2. Upper Saloum. 19,110. 8,732. 45.7. 10,378. 54.3. 84. 9.5. Nianija. 10,107. 5,107. 50.5. 5,000. 49.5. 102. 9.0. Niani Sami. 29,006 24,935. 13,526 11,696. 46.6 46.9. 15,480 13,239. 53.4 53.1. 87 88. 8.7 9.7. 24. cont'd.
(30) Table 2.1 Distribution of Population by Gender and District Male N. Janjanbureh Niamina Dankunku Niamina West. N. Female Percent. N. Percent. Gender ratio. Mean household size. 127,333. 59,684. 46.9. 67,649. 53.1. 88. 8.8. 6,186. 2,938. 47.5. 3,248. 52.5. 90. 6.9. 7,262. 3,343. 46.0. 3,920. 54.0. 85. 9.6. Niamina East. 24,754. 11,142. 45.0. 13,612. 55.0. 82. 9.8. Lower Fuladu West. 40,481. 19,306. 47.7. 21,175. 52.3. 91. 10.9. Upper Fuladu West. 44,796. 21,125. 47.2. 23,671. 52.8. 89. 7.6. Janjanbureh. 3,853. 1,831. 47.5. 2,023. 52.5. 90. 5.9. Basse Jimara. 243,791. 116,166. 47.6. 127,626. 52.4. 91. 7.0. 44,665. 21,322. 47.7. 23,343. 52.3. 91. 7.1. Basse. 50,462. 25,440. 50.4. 25,022. 49.6. 102. 5.1. Tumana. 38,237. 17,730. 46.4. 20,506. 53.6. 86. 7.3. Kantora. 39,416. 17,729. 45.0. 21,687. 55.0. 82. 8.2. Wuli West. 22,431. 10,829. 48.3. 11,602. 51.7. 93. 8.6. Wuli East Sandu. 24,266 24,314. 11,322 11,793. 46.7 48.5. 12,944 12,522. 53.3 51.5. 87 94. 8.1 8.5. Children 0-35 years. 1,529,083. 718,994. 47.0. 810,089. 53.0. 89. ... 0-14 years. 838,234. 421,038. 50.2. 838,234. 49.8. 50. ... 15-17 years 18-35 years. 126,022 564,827. 56,630 241,326. 44.9 42.7. 126,022 564,827. 55.1 57.3. 45 43. .. ... 25.
(31) Table 2.2 Distribution of Households by Household Composition (size) and District Mean Household Size. 1. 2-4. 5-6. 7-10. 11+. person. persons. persons. persons. persons. 280,659. 8.0. 24.1. 23.2. 31.8. 12.8. 6.9. Urban. 177,686. 10.8. 28.4. 25.0. 27.7. 8.1. 6.0. Rural. 102,973. 3.2. 16.7. 20.3. 38.9. 21.0. 8.4. Banjul City. 7,403. 26.2. 31.4. 24.1. 15.7. 2.7. 4.1. Urban. 7,403. 26.2. 31.4. 24.1. 15.7. 2.7. 4.1. 70,018. 11.7. 31.7. 27.1. 23.6. 5.9. 5.5. Urban. 70,018. 11.7. 31.7. 27.1. 23.6. 5.9. 5.5. Brikama. 103,690. 6.4. 23.4. 23.1. 34.0. 13.1. 7.0. Kombo North. 56,983. 7.7. 26.8. 24.2. 31.8. 9.5. 6.3. Kombo South. 14,684. 6.5. 21.5. 23.0. 34.5. 14.5. 7.7. Kombo Central. 18,975. 4.6. 20.6. 20.8. 37.1. 16.9. 7.8. Kombo East. 5,631. 4.5. 16.0. 25.9. 36.5. 17.1. 8.0. Foni Brefet. 1,818. 1.0. 15.0. 21.5. 41.4. 21.1. 8.5. Foni Bintang. 1,948. 0.8. 13.8. 16.5. 34.9. 33.9. 9.3. Foni Kansalla. 1,889. 2.6. 15.9. 20.7. 40.9. 20.0. 7.9. 816. 0.6. 8.5. 17.2. 42.6. 31.0. 9.9. N. THE GAMBIA. Kanifing Municipal. Foni Bundali Foni Jarrol. 947. 5.7. 16.4. 17.3. 43.0. 17.6. 7.7. Mansakonko. 11,984. 3.2. 22.1. 25.1. 42.0. 7.7. 6.9. Kiang West. 2,230. 4.5. 17.7. 26.1. 41.6. 10.1. 6.8. Kiang Cental. 1,148. 3.2. 14.4. 27.0. 41.2. 14.3. 7.7. Kiang East. 939. 2.1. 22.6. 23.4. 38.8. 13.1. 7.3. Jarra West. 4,162. 4.3. 24.4. 24.8. 42.8. 3.7. 6.4. Jarra Central. 1,290. 0.8. 22.5. 30.6. 43.3. 2.7. 6.6. Jarra East. 2,216. 1.6. 25.6. 21.1. 42.0. 9.8. 7.3. 27,478. 4.9. 14.3. 20.0. 40.5. 20.3. 8.2. Lower Niumi. 8,295. 6.6. 17.4. 25.9. 39.7. 10.5. 7.1. Upper Niumi. 3,929. 5.6. 14.2. 18.7. 44.1. 17.4. 8.1. Jokadu. 2,594. 2.2. 9.8. 15.5. 51.5. 20.9. 8.8. Lower Badibu. 2,236. 8.3. 16.0. 17.4. 34.2. 24.1. 8.2. Kerewan. Central Badibu. 2,280. 1.1. 13.6. 18.2. 40.6. 26.4. 8.8. Illiasa. 5,556. 4.3. 12.6. 17.9. 37.6. 27.7. 9.0. Sabach Sanjal. 2,589. 2.3. 12.1. 16.5. 38.4. 30.6. 9.4. 10,963. 2.9. 13.0. 17.8. 40.9. 25.4. 9.0. Lower Saloum. 1,935. 4.3. 14.7. 23.2. 36.2. 21.7. 8.2. Upper Saloum. 2,006. 2.6. 10.0. 14.9. 44.8. 27.7. 9.5. Nianija. 1,121. 1.6. 16.9. 16.7. 40.4. 24.5. 9.0. Niani Sami. 3,337. 3.1. 13.8. 21.0. 41.0. 21.0. 8.7. 2,564. 2.3. 11.4. 12.3. 41.6. 32.4. 9.7. Kuntaur. 26. cont'd.
(32) Table 2.2 Distribution of Households by Household Composition (size) and District. N. Janjanbureh. 1. 2-4. 5-6. 7-10. 11+. person. persons. persons. persons. persons. Mean Household Size. 14,465. 7.2. 14.8. 17.2. 35.9. 25.0. 8.8. Niamina Dankunku. 894. 2.4. 21.7. 27.3. 41.9. 6.6. 6.9. Niamina West. 758. 1.4. 9.1. 20.1. 39.1. 30.3. 9.6. Niamina East. 2,521. 4.7. 10.5. 14.4. 39.9. 30.5. 9.8. Lower Fuladu West. 3,714. 4.9. 13.4. 13.0. 32.4. 36.2. 10.9. Upper Fuladu West. 5,925. 9.8. 15.8. 19.5. 35.6. 19.3. 7.6. Janjanbureh. 653. 19.7. 26.4. 13.8. 30.5. 9.6. 5.9. 34,659. 7.7. 25.1. 21.8. 30.1. 15.2. 7.0. Jimara. 6,267. 3.9. 26.0. 19.9. 33.2. 17.1. 7.1. Basse. 9,867. 21.2. 27.3. 19.5. 26.3. 5.8. 5.1. Tumana. 5,213. 2.1. 21.0. 25.9. 31.7. 19.3. 7.3. Kantora. 4,830. 2.4. 24.8. 22.3. 30.8. 19.8. 8.2. Wuli West. 2,611. 0.6. 24.2. 25.1. 28.8. 21.4. 8.6. Wuli East. 3,011. 0.3. 25.0. 22.3. 34.7. 17.7. 8.1. Sandu. 2,860. 3.0. 24.6. 22.9. 29.3. 20.3. 8.5. 228,644 52,015. 8.4 6.2. 21.9 33.8. 22.1 28.3. 33.3 25.1. 14.3 6.5. 7.1 5.7. Basse. HOUSEHOLD HEAD Male Female. 27.
(33) Table 2.3 Distribution of Population by Gender, Broad Age-groups and Area of Residence Total N. THE GAMBIA. Male N. Female Percent. N. Percent. 1,922,950. 915,357. 47.6. 1,007,593. 52.4. 0 - 4 years. 311,156. 155,654. 50.0. 155,503. 50.0. 5 - 9 years. 298,089. 150,122. 50.4. 147,966. 49.6. 10 - 14 years. 228,989. 115,261. 50.3. 113,727. 49.7. 15 - 19 years. 198,367. 87,274. 44.0. 111,093. 56.0. 20 - 24 years. 180,479. 76,050. 42.1. 104,429. 57.9. 25 - 29 years. 151,669. 62,431. 41.2. 89,237. 58.8. 30 - 34 years. 127,754. 57,532. 45.0. 70,222. 55.0. 35 - 39 years. 109,161. 49,913. 45.7. 59,248. 54.3. 40 - 44 years. 81,698. 39,032. 47.8. 42,666. 52.2. 45 - 49 years. 61,757. 32,235. 52.2. 29,522. 47.8. 50 - 54 years. 52,727. 27,286. 51.7. 25,441. 48.3. 55 - 59 years. 35,759. 18,075. 50.5. 17,685. 49.5. 60 - 64 years. 30,155. 16,034. 53.2. 14,121. 46.8. 55,191 1,057,467. 28,457 503,304. 51.6 47.6. 26,734 554,163. 48.4 52.4. Less than 4 years. 156,283. 76,198. 48.8. 80,085. 51.2. 5 - 9 years. 145,387. 71,306. 49.0. 74,081. 51.0. 10 - 14 years. 114,825. 58,394. 50.9. 56,431. 49.1. 15 - 19 years. 114,446. 47,786. 41.8. 66,660. 58.2. 20 - 24 years. 115,445. 47,655. 41.3. 67,790. 58.7. 25 - 29 years. 96,080. 40,579. 42.2. 55,501. 57.8. 30 - 34 years. 78,402. 38,439. 49.0. 39,963. 51.0. 35 - 39 years. 66,199. 32,130. 48.5. 34,069. 51.5. 40 - 44 years. 47,312. 23,918. 50.6. 23,394. 49.4. 45 - 49 years. 34,650. 19,389. 56.0. 15,260. 44.0. 50 - 54 years. 28,742. 16,285. 56.7. 12,457. 43.3. 55 - 59 years. 20,122. 9,561. 47.5. 10,562. 52.5. 60 - 64 years. 14,511. 8,600. 59.3. 5,911. 40.7. 25,063 865,483. 13,064 412,053. 52.1 47.6. 12,000 453,430. 47.9 52.4. Less than 4 years. 154,874. 79,456. 51.3. 75,418. 48.7. 5 - 9 years. 152,702. 78,816. 51.6. 73,886. 48.4. 10 - 14 years. 114,164. 56,868. 49.8. 57,296. 50.2. 15 - 19 years. 83,922. 39,489. 47.1. 44,433. 52.9. 20 - 24 years. 65,034. 28,395. 43.7. 36,639. 56.3. 25 - 29 years. 55,589. 21,852. 39.3. 33,737. 60.7. 30 - 34 years. 49,352. 19,093. 38.7. 30,259. 61.3. 35 - 39 years. 42,961. 17,783. 41.4. 25,178. 58.6. 40 - 44 years. 34,386. 15,114. 44.0. 19,272. 56.0. 45 - 49 years. 27,107. 12,846. 47.4. 14,262. 52.6. 50 - 54 years. 23,985. 11,001. 45.9. 12,984. 54.1. 55 - 59 years. 15,637. 8,514. 54.4. 7,123. 45.6. 60 - 64 years 65+ years. 15,644 30,128. 7,434 15,393. 47.5 51.1. 8,210 14,734. 52.5 48.9. 65+ years URBAN. 65+ years RURAL. 28.
(34) Table 2.4 Distribution of Population (population pyramid) by Gender, Broad Age-groups and Area of Residence Total. Male. N. Percent. THE GAMBIA. 1,922,950. 100.0. 0 - 4 years 5 - 9 years 10 - 14 years 15 - 19 years 20 - 24 years 25 - 29 years 30 - 34 years 35 - 39 years 40 - 44 years 45 - 49 years 50 - 54 years 55 - 59 years 60 - 64 years 65+ years URBAN. 311,156 298,089 228,989 198,367 180,479 151,669 127,754 109,161 81,698 61,757 52,727 35,759 30,155 55,191 1,057,467. 0 - 4 years 5 - 9 years 10 - 14 years 15 - 19 years 20 - 24 years 25 - 29 years 30 - 34 years 35 - 39 years 40 - 44 years 45 - 49 years 50 - 54 years 55 - 59 years 60 - 64 years 65+ years RURAL 0 - 4 years 5 - 9 years 10 - 14 years 15 - 19 years 20 - 24 years 25 - 29 years 30 - 34 years 35 - 39 years 40 - 44 years 45 - 49 years 50 - 54 years 55 - 59 years 60 - 64 years 65+ years. N. Female Per cent. N. Per cent. 915,357. 100.0. 1,007,593. 100.0. 16.2 15.5 11.9 10.3 9.4 7.9 6.6 5.7 4.2 3.2 2.7 1.9 1.6 2.9 100.0. 155,654 150,122 115,261 87,274 76,050 62,431 57,532 49,913 39,032 32,235 27,286 18,075 16,034 28,457 503,304. 17.0 16.4 12.6 9.5 8.3 6.8 6.3 5.5 4.3 3.5 3.0 2.0 1.8 3.1 100.0. 155,503 147,966 113,727 111,093 104,429 89,237 70,222 59,248 42,666 29,522 25,441 17,685 14,121 26,734 554,163. 15.4 14.7 11.3 11.0 10.4 8.9 7.0 5.9 4.2 2.9 2.5 1.8 1.4 2.7 100.0. 156,283 145,387 114,825 114,446 115,445 96,080 78,402 66,199 47,312 34,650 28,742 20,122 14,511 25,063 865,483. 14.8 13.7 10.9 10.8 10.9 9.1 7.4 6.3 4.5 3.3 2.7 1.9 1.4 2.4 100.0. 76,198 71,306 58,394 47,786 47,655 40,579 38,439 32,130 23,918 19,389 16,285 9,561 8,600 13,064 412,053. 15.1 14.2 11.6 9.5 9.5 8.1 7.6 6.4 4.8 3.9 3.2 1.9 1.7 2.6 100.0. 80,085 74,081 56,431 66,660 67,790 55,501 39,963 34,069 23,394 15,260 12,457 10,562 5,911 12,000 453,430. 14.5 13.4 10.2 12.0 12.2 10.0 7.2 6.1 4.2 2.8 2.2 1.9 1.1 2.2 100.0. 154,874 152,702 114,164 83,922 65,034 55,589 49,352 42,961 34,386 27,107 23,985 15,637 15,644 30,128. 17.9 17.6 13.2 9.7 7.5 6.4 5.7 5.0 4.0 3.1 2.8 1.8 1.8 3.5. 79,456 78,816 56,868 39,489 28,395 21,852 19,093 17,783 15,114 12,846 11,001 8,514 7,434 15,393. 19.3 19.1 13.8 9.6 6.9 5.3 4.6 4.3 3.7 3.1 2.7 2.1 1.8 3.7. 75,418 73,886 57,296 44,433 36,639 33,737 30,259 25,178 19,272 14,262 12,984 7,123 8,210 14,734. 16.6 16.3 12.6 9.8 8.1 7.4 6.7 5.6 4.3 3.1 2.9 1.6 1.8 3.2. 29.
(35) Table 2.5 Distribution of Population Structure and Age Dependency Ratio by District. N. THE GAMBIA. 0-14 years. 15-64 years. N. Percent. N. Percent. N. Percent. Age dependency ratio. 65+ years. 1,922,950. 838,234. 43.6. 1,029,525. 53.5. 55,191. 2.9. 87. 1,057,467. 416,494. 39.4. 615,909. 58.2. 25,063. 2.4. 72. Rural. 865,483. 421,739. 48.7. 413,616. 47.8. 30,128. 3.5. 109. Banjul City. 30,703. 9,726. 31.7. 19,810. 64.5. 1,167. 3.8. 55. Urban. 30,703. 9,726. 31.7. 19,810. 64.5. 1,167. 3.8. 55. 383,545. 142,165. 37.1. 232,155. 60.5. 9,225. 2.4. 65. Urban. Kanifing Municipal Urban. 383,545. 142,165. 37.1. 232,155. 60.5. 9,225. 2.4. 65. Brikama. 730,895. 310,348. 42.5. 402,943. 55.1. 17,605. 2.4. 81. Kombo North. 360,147. 145,923. 40.5. 206,823. 57.4. 7,401. 2.1. 74. Kombo South. 113,315. 51,446. 45.4. 58,798. 51.9. 3,071. 2.7. 93. Kombo Central. 148,599. 62,636. 42.2. 82,899. 55.8. 3,064. 2.1. 79. Kombo East. 44,874. 20,409. 45.5. 23,251. 51.8. 1,213. 2.7. 93. Foni Brefet. 15,412. 7,351. 47.7. 7,400. 48.0. 660. 4.3. 108. Foni Bintang. 18,167. 8,442. 46.5. 8,885. 48.9. 840. 4.6. 104. Foni Kansalla. 14,990. 6,854. 45.7. 7,387. 49.3. 749. 5.0. 103. Foni Bundali. 8,089. 3,985. 49.3. 3,856. 47.7. 248. 3.1. 110. Foni Jarrol. 7,304. 3,302. 45.2. 3,644. 49.9. 359. 4.9. 100. Mansakonko. 82,201. 38,345. 46.6. 40,508. 49.3. 3,348. 4.1. 103. 15,204. 7,154. 47.1. 7,287. 47.9. 763. 5.0. 109. 8,785. 4,205. 47.9. 4,142. 47.2. 437. 5.0. 112. Kiang West Kiang Cental Kiang East. 6,898. 3,098. 44.9. 3,434. 49.8. 367. 5.3. 101. Jarra West. 26,589. 12,391. 46.6. 13,408. 50.4. 790. 3.0. 98. 8,461. 4,032. 47.7. 4,158. 49.1. 271. 3.2. 103. Jarra Central Jarra East. 16,263. 7,464. 45.9. 8,079. 49.7. 721. 4.4. 101. 225,516. 105,968. 47.0. 111,320. 49.4. 8,228. 3.6. 103. Lower Niumi. 58,498. 25,913. 44.3. 30,840. 52.7. 1,745. 3.0. 90. Upper Niumi. 31,643. 15,035. 47.5. 15,095. 47.7. 1,513. 4.8. 110. Jokadu. 22,863. 11,173. 48.9. 10,692. 46.8. 998. 4.4. 114. Lower Badibu. 18,405. 8,896. 48.3. 8,826. 48.0. 683. 3.7. 109. Kerewan. Central Badibu. 19,972. 9,829. 49.2. 9,177. 45.9. 967. 4.8. 118. Illiasa. 49,821. 22,985. 46.1. 25,260. 50.7. 1,576. 3.2. 97. Sabach Sanjal. 24,314. 12,137. 49.9. 11,431. 47.0. 746. 3.1. 113. 98,966. 49,682. 50.2. 45,914. 46.4. 3,370. 3.4. 116. Lower Saloum. 15,807. 7,208. 45.6. 8,101. 51.2. 499. 3.2. 95. Upper Saloum. 19,110. 10,119. 53.0. 8,454. 44.2. 537. 2.8. 126. Nianija. 10,107. 5,088. 50.3. 4,660. 46.1. 359. 3.6. 117. Niani Sami. 29,006 24,935. 14,822 12,445. 51.1 49.9. 13,295 11,404. 45.8 45.7. 889 1,086. 3.1 4.4. 118 119. Kuntaur. 30. cont'd.
(36) Table 2.5 Distribution of Population Structure and Age Dependency Ratio by District. N. Janjanbureh. 0-14 years. 15-64 years. N. N. Percent. 65+ years. Percent. N. Percent. Age dependency ratio. 127,333. 61,456. 48.3. 61,403. 48.2. 4,474. 3.5. 107. Niamina Dankunku. 6,186. 2,866. 46.3. 3,071. 49.6. 249. 4.0. 101. Niamina West. 7,262. 3,557. 49.0. 3,439. 47.4. 267. 3.7. 111. Niamina East. 24,754. 12,270. 49.6. 11,727. 47.4. 757. 3.1. 111. Lower Fuladu West. 40,481. 19,742. 48.8. 19,279. 47.6. 1,460. 3.6. 110. Upper Fuladu West. 44,796. 21,452. 47.9. 21,770. 48.6. 1,575. 3.5. 106. Janjanbureh. 3,853. 1,569. 40.7. 2,118. 55.0. 167. 4.3. 82. 243,791. 120,544. 49.4. 115,472. 47.4. 7,775. 3.2. 111. Jimara. 44,665. 22,064. 49.4. 21,002. 47.0. 1,599. 3.6. 113. Basse. 50,462. 22,653. 44.9. 26,572. 52.7. 1,237. 2.5. 90. Tumana. 38,237. 19,848. 51.9. 17,019. 44.5. 1,370. 3.6. 125. Kantora. 39,416. 19,703. 50.0. 18,076. 45.9. 1,637. 4.2. 118. Wuli West. 22,431. 11,229. 50.1. 10,629. 47.4. 572. 2.6. 111. Wuli East Sandu. 24,266 24,314. 12,495 12,554. 51.5 51.6. 11,107 11,065. 45.8 45.5. 664 696. 2.7 2.9. 118 120. Basse. 31.
數據
相關文件
For pedagogical purposes, let us start consideration from a simple one-dimensional (1D) system, where electrons are confined to a chain parallel to the x axis. As it is well known
The observed small neutrino masses strongly suggest the presence of super heavy Majorana neutrinos N. Out-of-thermal equilibrium processes may be easily realized around the
incapable to extract any quantities from QCD, nor to tackle the most interesting physics, namely, the spontaneously chiral symmetry breaking and the color confinement..
(1) Determine a hypersurface on which matching condition is given.. (2) Determine a
• Formation of massive primordial stars as origin of objects in the early universe. • Supernova explosions might be visible to the most
The difference resulted from the co- existence of two kinds of words in Buddhist scriptures a foreign words in which di- syllabic words are dominant, and most of them are the
(Another example of close harmony is the four-bar unaccompanied vocal introduction to “Paperback Writer”, a somewhat later Beatles song.) Overall, Lennon’s and McCartney’s
專案執 行團隊
