國立台灣大學社會科學院經濟學系在職專班 碩士論文
Mid-Career Master Program Department of Economics College of Social Sciences National Taiwan University
Master Thesis
公部門調薪對民間薪資的帶動效果
The Impacts of Raising Public Sector Wage on the Private Wage in Taiwan
黃國治
Kuo-Chih Huang
指導教授﹕吳中書 博士 Advisor: Chung-Shu Wu, Ph.D.
中華民國 101 年 7 月
July, 2012
i
國立臺灣大學碩士學位論文 口試委員會審定書
公部門調薪對民間薪資的帶動效果
The Impacts of Raising Sector Wage on the Private Wage in Taiwan
本論文係 黃國治 君(學號 P98323027)在國立臺灣大 學經濟學系在職專班完成之碩士學位論文,於民國一○一年 七月二十六日星期四承下列考試委員審查通過及口試及 格,特此證明
口試委員:
ii
誌謝
本論文能夠完成,首先要感謝吳中書老師的細心指導,以及對我學業規劃的 諸多關懷,同時也要感謝兩位口試委員林建甫老師與陳建福老師的寶貴意見,讓 我獲益良多。其次,選題與撰寫論文過程中承蒙林惠玲老師、張清溪老師、辛炳 隆老師、黃台心老師提供許多協助,在此一併致謝。
感謝茹茵、其宏、殷如的大力協助,解決諸多疑難雜症;感謝亭亭、心弘、
志明的持續關懷與支持,讓我這幾年的生活充滿溫暖;感謝彩蓉的包容與陪伴;
感謝台經院長官與同事的多方提攜與協助。
最後,念研究所這段時間裡經歷不少事情,總算有驚無險,真是謝天謝地!
iii
Abstract
Using time series data in Taiwan over the period 1960-2010, this paper examines the existence and extent of pulling effect of raising public sector wage on the private sector wage. Our empirical results show that the pulling effect does exist, and 1% of increasing public sector wage rise will lead to an increase of private sector wage growth about 0.1%. Besides, due to the time lag between policy decision and implementation, the pulling effect performs as a preannouncement effect. The empirical results also support that the effect is smaller before early 1980s, and becomes bigger thereafter, then tends to decrease in 2000s.
中文摘要
本文使用台灣 1960 至 2010 年間之時間序列資料,考察公部門調薪是否對民間薪 資有帶動效果,以及此帶動效果的大小。實證結果顯示,公部門調薪對民間薪資 確實有帶動效果,公部門調薪 1%將帶動民間薪資成長約 0.1%。此外,由於公部 門調薪的決策與實際實施之間有時間差,帶動效果是在政策宣布時即發生,為宣 布效果。實證結果亦顯示,帶動效果的強弱有時間變化;在 1980 年代以前較弱,
在 1980 與 1990 年代最強,進入 2000 年又趨於減弱。
iv
Contents
口試委員會審定書 ... i
誌謝 ... ii
Abstract /中文摘要 ... iii
Tables ... vi
Charts ... vii
Chapter One Introduction ... 1
1.1 Research Object ... 1
1.2 Research Framework ... 2
1.3 Main Findings ... 2
Chapter Two Literature Review ... 4
2.1 Theoretical Background ... 4
2.2 Empirical Studies ... 7
2.3 Summary ... 12
Chapter Three The Historical Evolution and Empirical Observations ... 14
3.1 The Historical Evolution of Debate around Pulling Effect ... 14
3.2 Empirical Observations of Survey Data ... 22
3.3 Summary ... 28
Chapter Four Empirical Model and Data ... 30
4.1 Model Specification ... 30
4.2 Data Source ... 32
Chapter Five Empirical Findings ... 34
5.1 The Existence and Extent of Pulling Effect: Several Tests, Full Sample Regression and Variables Selection ... 34
5.1.1 Unit-root test ... 35
5.1.2 Full sample regression ... 38
5.1.3 Detecting Muliticollinearity ... 41
v
5.1.4 Detecting autocorrelation of residual ... 43
5.1.5 Granger Causality test ... 45
5.2 Pulling Effect in Different Periods: Rolling and Forward / Backward Regressions ... 47
5.3 Summary ... 52
Appendix ... 53
References ... 54
vi
Tables
Table 2.1: Summary of econometric studies ... 10
Table 3.1: The main findings of discourse review ... 17
Table 3.2: the percentage of firms with wage rise ... 23
Table 3.3: The references used by employers in wage rise decisions (by Labor Council) ... 24
Table 3.4: The percentage of factors influencing wage rise decisions, manufacture and service sectors (%) (DGBAS) ... 35
Table 3.5: By Scale, the percentage of firms with general wage rise (%) ... 27
Table 3.6: By scale, the percentage of firms taking public sector wage rise into considerations of their wage rise (%) ... 27
Table 5.1: Unit root tests ... 37
Table 5.2: Full sample regression ... 39
Table 5.3: Covariance coefficients among explanatory variable ... 42
Table 5.4: VIF of Model 4 ... 42
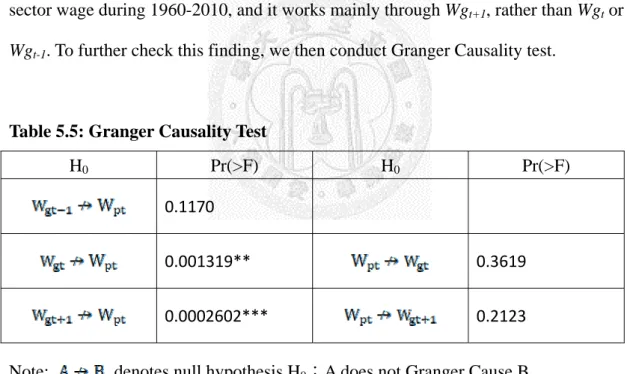
Table 5.5: Granger Causality Test ... 45
vii
Charts
Chart 3.1: By sector, the percentage of employers taking public sector wage rise into
considerations of their wage rise (%) ... 26
Chart 5.1: Time series plotting ... 36
Chart 5.2: Check autocorrelation of Wpt ... 41
Chart 5.3: ACF / PACF of the residual of Model 0~5 ... 43
Chart 5.4: Parameter of Wgt+1, 21 years rolling regression ... 49
Chart 5.5: Parameter of Wgt+1, 21 years forward recursive regression ... 49
Chart 5.6: Parameter of Wgt+1, 21 years backward recursive regression ... 49
Chart 5.7: Parameter of Wgt+1, 13 years rolling regression ... 51
Chart 5.8: Parameter of Wgt+1, 13 years forward recursive regression ... 51
Chart 5.9: Parameter of Wgt+1, 13 years backward recursive regression ... 51
1
Chapter One Introduction
1.1 Research Purpose
This paper analyzes empirically whether raising public sector wage can pull up the private sector wage in Taiwan, and if it does, what is the magnitude? The wage of public sector referred in this paper contains the wage of public employees in the administrations, public schools (included teachers), military, congress and public hospitals. Workers in the state owned enterprises are not included.
This issue is relevant from analytical and also policy perspectives, and not confined in Taiwan. In many countries, the government is the single biggest employer in the labor market. Such status seems to suggest that the government, as a big
employer, may have great influences on the private sector labor market when public sector wage rises. Partly basing on this assumption, in 2011, the Taiwanese
government even tries to utilize this “pulling effect” actively to pull private sector wages upward through raising public sector wages by 3%. This decision stimulates a new round of debate about the existence and extent of pulling effect of raising public sector wage.
In fact, from 1960 to 2010, the Taiwanese government had raised the public sector wages by different magnitudes for 28 times. Although this pulling effect of public sector wages on private wages is frequently mentioned on the public media whenever public sector wage rises, the existence of pulling effect has been hotly debated among scholars, entrepreneurs, employees and government officials.
The aim of this paper is to answer the key empirical question: Does public sector
2
wage rise pull up private wage? And if the answer is yes, how much the extent of this pulling effect? Does it change over different periods?
1.2 Research Framework
This paper investigates toward the pulling effect issue by qualitative and also quantitative ways. After a brief literature review, in chapter 3 it analyzes the public discourse on this issue during 1953-2011, to understand the historical background and evolution of the debate around pulling effect. It also reviews several descriptive statistics to gain more ideas about various dimensions of this issue. Basing on the review and analysis in chapter 2 and 3, the basic econometric model is specified in chapter 4. Chapter 5 is to estimate econometrically the existence and extent, also with its changes over time, by full sample regression, rolling regression, forward /
backward regression and categorical variables setting.
1.3 Main Findings and Contributions
This paper finds that the raising public sector wages does pull up the private sector wages. The empirical results show that the private wage will increase by about 0.1% if there is a 1% growth in the public sector wage. The second finding of this paper is that this pulling effect performs as a preannouncement effect, which means it will happen before the final implementation of public sector wage rise. The third finding is that the extent of pulling effect changes over time; lower in the period
3
before the early 1980s, and higher thereafter, then tends to decrease in 2000s.
Comparing with the literature, the novelty of this paper lies in analyzing the preannouncement effect and the dynamics of the extent of pulling effect. While the first finding of this paper is similar to some previous studies, such as Hsin (1988) and Huang (1990), the second and the third findings are neglected by previous studies and form the novel contributions of this paper.
4
Chapter Two Literature Review
2.1 Theoretical Background
While being fiercely debated, the issue in question is suffered from the lack of a generally convincing economic explanation of the occurring reason and mechanism of pulling effect. Firstly, under the traditional assumption of perfect labor market, it is quite understandable that wages rises in one sector will soon infect the other through especially, but not limited to, the free flows of labors. Beyond the level of elementary assumption, however, it is notoriously that many economists had long argued that the function of labor market is imperfect in reality, disturbing by several factors such as monopoly / monopsony (Manning, 2003), asymmetric information, segmentation (Reich, 2008), and the government interventions. In the conditions of imperfect labor markets, the mechanisms through which the public sector wages affect the private sector wages are open to question.
In the existing literature, it is argued that the pulling effect may still occur in an imperfect labor market with four mechanisms: 1) competition for labor; 2) institution of wage setting; 3) Interdependent Utility, or envy effect; 4) Information or signal effect.
The first mechanism, competition for labor, means that the raising of public sector wage will affect the outside option of the unemployed by increasing the value of being employed in the public sector. Public sector wages raisings also attract more private sector workers to seek positions in the public sector. Both of these two cases decrease the labor supply to the firms in private sector, so to exert upward pressure on
5
private sector wages (Friberg, 2007; Lin, 1992).
The second mechanism, institution of wage setting, is mainly suggested by studies focusing on Scandinavian countries and other OECD countries. This mechanism emphasizes the political and social forces in wage bargaining such as trade unions and legal regulations. Under this mechanism, the effect of public sector wages on private sector wages may go in bottom-up or top-down patterns. In the bottom-up pattern, if the employees in public sector won a generous settlement through wage bargaining processes, employees in private sector would campaign to raise wages accordingly, in order to restore the existing pattern of wage relative distributions. As for the top-down pattern, the government may cast harsh regulation of labor market for political reasons. As a result, there would be a strong influence of public sector wages on private sector wages (Mizala and Romaguera, 1995).
The third mechanism, the interdependent utility or envy effect, suggests that the utility function of employees in private sector contains the relative wage in public sector and the magnitude of effort they put on current positions. When public sector wage rises, while the employees in private sector cannot transfer into public sector, they would reduce the magnitude of effort to balance and to keep their utility the same.
Facing this situation, the employers in private sector have to either increase the magnitude of supervision or raise wages. As the increasing supervision is often high-cost and ineffective, employers would tend to raise the wage (D'Adamo, 2010;
Hsin, 1988).
The fourth mechanism, information or signal effect, implies that individual employers does not sure which level should the wages be set, since the lacks of
information about wage rates across sectors and the outlooks of macro economy. Then the decisions of government in public sector wages raisings are treated by employers as an indicator or signal of positive economic dynamics, and will help forming
6
general optimistic expectations among the public which makes employers more willing for wages raisings.
While these explanations are all plausible at the first glance, within literature it is not without questions at the same time, especially in the case of Taiwan. For the first mechanism, competition for labor, while it may occur in the past, there are opinions arguing that it is not likely to continue under the condition of excess labor supply in general and the extreme low quit rates in public sector in the recent years (Chen, 2010;
Editorial, 2011). And the second, institution of wage setting, has been far away from existence in Taiwan. Indeed, it is more convincing for the third and fourth mechanism, but they are on the other hand more difficult to verify or falsify empirically, since they all concern with some subtle factors which cannot be surely measured.
With the strength and weakness of these four explanations in mind, there is no single theory of this issue generally acknowledged. The emphasis of literature is therefore much more on the empirical evidences and econometric estimates, which involve heavily in the historical and institutional characteristics of labor market in each country.
7
2.2 Empirical Studies
Hsin (1988) is the first attempt in analyzing this issue in Taiwan. He uses the yearly macro data from 1953 to 1985, with the wage rate of private sector as the dependent variable, and the wage rate of public sector, the change rate of wholesale price index, the growth rate of labor productivity of private sector, and unemployment rate as the independent variables. He finds that the effect of public sector wage on private sector wage is positive and statistically significant, with the coefficient of the public sector wage variable being 0.1703.
Huang (1990) applies the methods of residual analysis and impulse response simulation on the yearly industrial data from 1959 to 1988. He finds that public sector wages do affect private sector wages for 11 in 16 industries, and the extent of this spillover effect ranges from 0.3-0.7.
Contrary to Hsin (1988) and Huang (1990), Lin (1992) finds that the pulling effect is not statistically significant both in the service and manufacture sectors. He analyses the relationship between public sector wages, prices and private sector wages under a complete macro model, then test the pulling effect separately on service and manufacture sector wages with the data cover from 1973 to 1991. After controlling the price, productivity, unemployment rate and the lagged term of wage, he finds that the effect is insignificant in the yearly sample models and slightly significant in the seasonal sample models, but dismiss the latter as the poor quality of seasonal data.
In a macro-econometric model with unemployment gap, Wu et al. (2002) finds that pulling effect is statistically insignificant over the data till 2001. On the other hand, Wu (1995) studies the data of period 1980-1994 and finds that it is the private sector wages affect the public sector wages.
Aside from the case of Taiwan, the main group of literature on this issue is those
8
researches which are evolved from the Scandinavian model of inflation and mainly focus around the case of Scandinavian economies (Lindquist and Vilhelmsson, 2006).
In its analysis of the interactions between domestic and international macroeconomic factors, Scandinavian model predicts that the tradable goods sector would act as the wage leader, i.e. wage increases occurred in the tradable goods sector first, and then transmitted to the non-tradable goods sectors (Lindbeck, 1979; Söderström and Viotti, 1979). Since Scandinavian countries often have small, open economies with highly unionized labor forces and relatively large public sectors, the linkages between public (non-tradable) sector and private (tradable) sector have been an issue for positive studies. Besides, in some Scandinavian countries, this model also serves as a normative model to set wages in the non-tradable public sectors, without placing
undue upward pressures on the wage formation in the private tradable sectors to harm their international competitiveness (Lindquist and Vilhelmsson, 2006).
Holmlund and Ohlsson (1992) find that while the public sector wages were always higher than private sector, from around 20% in late 1960s to 5% in early 1990s, the private sector wage changes Granger causes wage changes in central as well as local governments, which is consistent with the Scandinavian model. In fact, most studies within this context had also confirmed the wage leadership of private sector, such as Jacobson and Ohlsson (1994) and Lindquist and Vilhelmsson (2006).
As an exception, Friberg (2007) finds no evidence of a unique wage leading role for the internationally exposed manufacturing sector.
By focusing on the wage agreements of public and private sector in Canada during the 1967-1978 period, Lacroix and Dussault (1984) analyzes the possible spillover effects of the public sector over private sector, and finds that the
public-private spillover effect occurs only under the two following conditions: First, the corresponding public sector employees are white- or blue-color workers, rather
9
than teachers, nurses, fireman, policemen; Second, they are located in the same urban area as the private sector workers. Besides, the magnitude of the spillover effect is affected positively by the degree of tightness in the labor market, and negatively by the size of the urban area where the private sector workers are located and by the degree of foreign competition faced by their employer.
Mizala and Romaguera (1995) argue for the importance of institutional factors in the leading role of public sector wages in Chile. Since Chile has had a long history of state interventions in labor market, especially since the military coup in 1973, they find that the influence of public sector wages on private sector wages was quite strong before 1979, then significantly reduced with the deregulation process during
1979-1982, and finally rejected in the period of 1983-1990, in which period the state had no longer controlled the labor market.
Demekas and Kontolemis (1999) focused on the case of Greece from 1971 to 1993, and find that the increases in public sector wages did lead to increases in private sector wages, and the increases in public sector employment had no significant impact on unemployment. On the other hand, Christou (2007) find that for Romania the private sector leads in the whole sample period, and obtained a bi-directional causality from 1998 to 2006.
In the recent years, the European Central Bank (ECB) conducts a series of studies on the interaction between the public and private sector wages. Afonso and Gomes (2008) analyzes a panel data of OECD and EC country groups covering essentially the period from 1970 to 2007. They find that the effects of public sector wages and employment on private sector wages are statistically significant and positive. A 1% increase in real public sector wage growth increases private sector nominal wage growth by 0.3%, and a 1% increase in public sector employment increases private sector wage growth by close to 0.3%
10
Another ECB paper, Lamo et al. (2008), focuses the co-movement and Granger-causality between public and private sector wages in OECD and EURO countries from 1960-2006. They find that private sector wages exert mostly a stronger influence on public sector wages than the other way around, while the public sector wages exerted influence back via prices both directly and indirectly in some cases.
Pérez and Sánchez (2010) analyze the contemporaneous intra-annual causality between public and private wages for the four biggest European economies, i.e.
Germany, Spain, France and Italy, by using the quarterly data from 1980 to 2007.
They find that while there were significant linkages between public and private wages, the direction of wage leadership was depended on the choosing of countries, sample periods, and whether only the within-the year linkages were considered.
D’Adamo (2010) extends the analysis to the Central - Eastern European countries. He divides the economy into three sectors, i.e. tradable sector, market non-tradable sector and public sector, and constructed three scenarios labeled as
‘Scandinavian model’, ‘wage mark-up model’, and ‘envy-effect model,’ in which the three sectors acted as the wage leaders sequentially. By exploiting quarterly data from 2000Q1 to 2010Q2, he finds that the Scandinavian model is a good approximation only for Estonia and Slovak Republic, while the public sector wages lead in Romania, Czech Republic and Latvia. However, for remaining countries are concerned,
non-traded or public sector is not affected by the tradable sector.
Table 2.1: Summary of econometric studies
Paper Countries/Period Main findings
Hsin (1988) Taiwan, 1953-1985 Public sector pull up private sector wages
Huang (1990) Taiwan, 1959-1988 Public sector pull up private sector wages in 11 of 16 sectors
11
Lin (1992) Taiwan, 1973-1991 No pulling effect
Wu (1995) Taiwan, 1980-1994 Private sector pull public sector Wu et al. (2002) Taiwan, -2001 No pulling effect
Holmlund and
Ohlsson (1992) Sweden, 1965-1991 Private wage changes Granger caused public sector wage changes
Jacobson and
Ohlsson (1994) Sweden, 1968-1988 Private sector leads Lindquist and
Vilhelmss (2006)
Sweden, 1970-2002 Private sector leads
Friberg (2007) Sweden, 1980-2002 Central government sector leads D’Adamo
(2010)
10 Central and Eastern European Countries, 2000-2010
Tradable (private) sector leads only in Estonia and Slovak Republic
Lacroix and
Dussault (1984) Canada, 1967-1978 Public sector leads only in specific conditions
Mizala and Romaguera
(1995)
Chile, 1976-1990
Influence of public sector on private sector is strong before 1979 and fades away over time
Demekas and Kontolemis
(1999)
Greece, 1971-1993 Public sector leads
Christou (2007) Romania, 1993-2006
Private sector leads in whole sample period, and bi-directional causality in 1998-2006.
Afonso and Gomes (2008)
OECD and EU countries, 1970-2007
A 1% increase in public real wage/employment growth increases private nominal wage growth by 0.3%.
Lamo et al.
(2008)
OECD and EURO area countries, 1960-2006
1. private public closely correlated 2. Private sector lead
3. Public sector indirectly influence private sector via price
Pérez and Sánchez (2010)
Germany, Spain, France, Italy, 1980-2007 quarterly
Public sector wages has leading role only in the within-the year linkages and this role have faded in the past two decades at least for Germany and Spain
12
2.3 Summary and Conclusions
Basing on the review of econometric studies above, it can be easily found that the existence and extent of pulling effect are heavily influenced by various local factors, which is out of the reach of global theorization. It may be worthwhile to check some specific observations from the review of econometric studies above, to obtain some ideas which are helpful in our further analysis in this paper.
Firstly, we find that the existence of pulling effect seems to be quite sensitive to the selection of sample period, and a small difference in sample period will result at contradicting outcomes. Asides from the reasons of econometric model specification, this may imply that the pulling effect does vary from period to period. In this case, it is meaningful and also workable to divide the sample into some sub-periods to test the pulling effect in different periods. Unfortunately, in the literature there are only few exercises (Mizala and Romaguera, 1995; Pérez and Sánchez, 2010) in this direction and none of the case of Taiwan. On the other hand, while the reasons behind this phenomenon are certainly quite complicated, likes the conditions of labor supply in specific period, prevailing psychological current, general economic expatiations and so on, it is also important to investigate the historical development of this issue
against the social, economic and political backgrounds to provide realist directions for latter econometric analysis.
Secondly, within some studies of Taiwan, there are few weaknesses concerning the econometric procedures and qualities of data, such as the short sample series, lack of stationarity testing and so on (Hsin, 1988; Lin, 1992), which may influence the reliability of the outcome. These problems can be corrected with a more rigorous econometric procedure and longer sample series.
13
Thirdly, there are some studies find that the pulling effect is not universal across industries and sectors, which suggests that the specific characteristics of each industry may have some influences. However, for the accessibility of data and respectively various focuses, most studies use aggregate macro data and are not able to deal with the differences among industries or sectors. This limitation is also applied to this paper. But this paper does try to avoid mixing the wages of state owned enterprises with the private sector wages, which is a common shortcoming in previous studies of Taiwan case, except Hsin (1988).
Fourthly, as a common practice in time series analysis, most previous studies take the lagged effect into consideration and add the lagged term of public sector wage rise (Wgt-1) as an explanatory variable. Yet, since the discussions and decisions of public sector wage rise are always occurred and made ahead its realization for about 1-1.5 year, it is reasonable to include the quasi-expected term (Wgt+1) in the list of explanatory variable.
14
Chapter Three The Historical Evolution and Empirical Observations
This chapter is to analyses the historical development of the pulling effect of public sector wage rise on the private sector wage in Taiwan. The purposes of this chapter are not only to present the evolution of the debate around this issue, but also to provide some guide lines for further econometric analysis in the next chapter. The first section devotes to a discourse review, using different kinds of texts which appeared in various newspapers during 1953 to 2011 as the object of review. The second section will focuses on the descriptive statistics from several official surveys which had directly engaged in this issue. Third section discusses the ideas which may help for econometric analysis in the next chapter.
3.1 The Historical Evolution of Debate around Pulling Effect
According to the record of the official and Hsin (1988), from 1953 to 2011 Taiwanese government raised the public sector wage for 29 times. During these 59 years, the public opinions and the official statements around public sector wage rise are relatively steady at the beginning years, then gradually change and reverse completely at the end.
Focusing on the discussion of pulling effect, we find no mention about the pulling effect on the newspapers before 1970. Even during 1970s, there are only few articles on the newspapers had mentioned this phenomenon occasionally. Most public opinions appeared on newspapers support the public sector wage rise, basing on the
15
fact that public sector wage level is much lower than private sector and hard to meet the basic needs during the 1960s, and needs to catch up with private sector wage to attract talents joining in the civil service during 1970s. This line of discourse, public wage is too low to attract talents from the private sector, remains popular during 1980s and continues working in some cases during 1990s.
During 1980s, discussions about the pulling effect are gradually increasing. In the beginning, it is mentioned that the mechanism through which public wage rise pull up private wage is: public sector wage rise → stimulates inflation → private sector wage rise. As time goes by, more believes the mechanism is: public sector wage rise
→ private sector workers demand the same wage rise → private sector wage rise.
This mechanism, which can be called as envy-effect (D'Adamo, 2010) or
interdependent utility (Hsin, 1988), becomes a popular discourse among the public opinions into the second half of 1980s. After the prevailing of this discourse, comes the new emergence of labor movements accompanied with the abolishing of Martial Law, and some labor unions of big private firms or of state owned enterprises start demanding the same rate of annual wage rise as the public sector.
As the slowdown of economic growth in the early 1990s, many private firms find them unable to keep path with the public sector wage rise or simply keep their wage from growing. The Ministry of Economic Affairs also starts to argue openly against public sector wage rise, since this would cast unduly pressures on the wage costs of private firms. Throughout the period of 1990s, while most public opinions turn to against the public sector wage rise, basing on the existence of pulling effect as a premise, the government (except the Ministry of Economic Affairs) continues insisting there is no such pulling effect and raises public sector wage every years till 1998.
16
At the same time, more public opinions start to criticize the generous wage and welfare of public sector, arguing that the public sector wage is already comparable with private big firms and surpasses most medium-small sized firms, so it is
unreasonable and unnecessary to raise public wage to attract talents. This becomes a main argument against the public sector wage rise hereafter and marks the
transformation of the public opinions toward public sector wage rise from supporting to criticizing.
From the late 1990s to the whole 2000s, the frequency and magnitude of public sector wage rise are both significantly decline, also the reports of cases of pulling effect. Interestingly, in 2008, Ching-Hsiou Chen, the Minister of Central Personnel Administration, states that public wage rise will pull up private wage, stimulate domestic consumption and be positive to economic growth. Comparing with the past, the official opinion on the pulling effect turns upside down in this period, and lasts into the present.
17
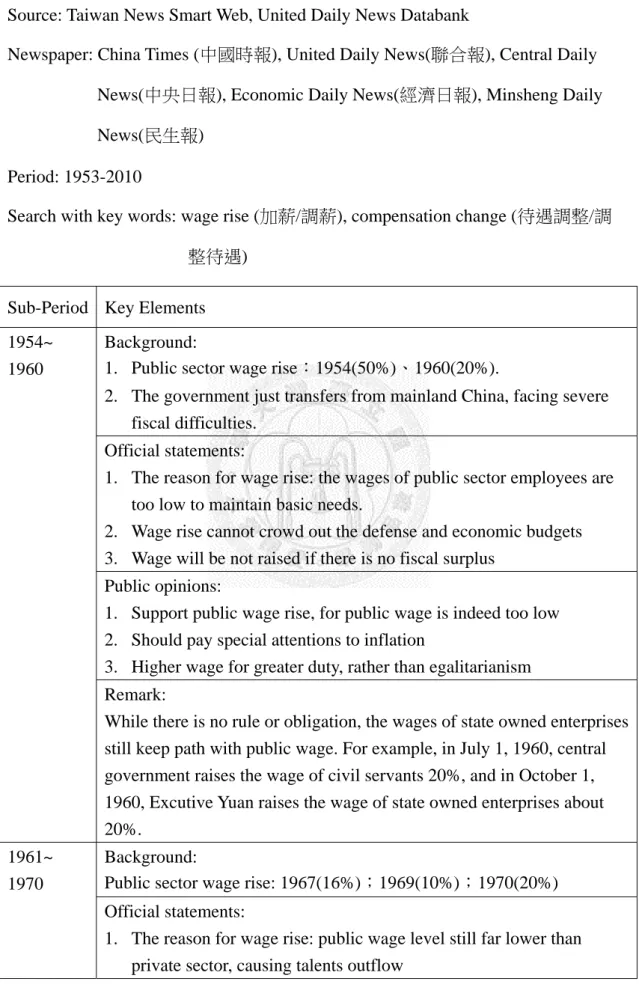
Table 3.1: The main findings of discourse review
Source: Taiwan News Smart Web, United Daily News Databank
Newspaper: China Times (中國時報), United Daily News(聯合報), Central Daily News(中央日報), Economic Daily News(經濟日報), Minsheng Daily News(民生報)
Period: 1953-2010
Search with key words: wage rise (加薪/調薪), compensation change (待遇調整/調 整待遇)
Sub-Period Key Elements 1954~
1960
Background:
1. Public sector wage rise:1954(50%)、1960(20%).
2. The government just transfers from mainland China, facing severe fiscal difficulties.
Official statements:
1. The reason for wage rise: the wages of public sector employees are too low to maintain basic needs.
2. Wage rise cannot crowd out the defense and economic budgets 3. Wage will be not raised if there is no fiscal surplus
Public opinions:
1. Support public wage rise, for public wage is indeed too low 2. Should pay special attentions to inflation
3. Higher wage for greater duty, rather than egalitarianism Remark:
While there is no rule or obligation, the wages of state owned enterprises still keep path with public wage. For example, in July 1, 1960, central government raises the wage of civil servants 20%, and in October 1, 1960, Excutive Yuan raises the wage of state owned enterprises about 20%.
1961~
1970
Background:
Public sector wage rise: 1967(16%);1969(10%);1970(20%) Official statements:
1. The reason for wage rise: public wage level still far lower than private sector, causing talents outflow
18
2. Wage will be not raised if there is no fiscal surplus Public opinions:
1. To attract talents, public wage should be raised to the same level of private sector, rather than meeting the basic needs
2. Pro: public wage rise will promote the administrative efficiency 3. The institutions and rules about public wage should be reformed to
simplification Remark
1. No mention about the pulling effect on private sector wage.
2. The rate of Inflation is controlled well between 2~8% since 1961 1971~
1980
Background:
1. Public sector wage rise: 1973(30.5%);1974(20%);1976(11.2%);
1977(14.7%);1978(20%);1979(13.8);1980(20%);1981(20%) 2. Inflation rate surges when the first and second oil shocks, but fall
back soon after
3. Private sector wage grows steadily
4. Breaking of relations between the United States and Taiwan, 1978 Official statements:
1. Public wage rise should not break the equality between high and low ranks
2. Public wage rise will not stimulate inflation and private wage Public opinions:
1. Higher wage for greater duty and talent
2. Public wage rise may stimulate inflation, stagnating real wage 3. Public wage rise may has demonstration effect, promoting private
sector workers’ demands Remark
1. While there are some opinions on the newspapers mentioning that public wage rise will pull up private wage, the main emphasis is still on the possibility of stimulating inflation, and the public wage should keep path with inflation.
2. The government had issued two policies sequentially in 1973 and 1980 to substantially increase public sector wage: 2 times of per capita GNP for lower public employees’ yearly income, 5 times for middle ranking and 10 times for higher ranking officials. These goals are not fulfilled somehow.
1981~
1986
Background:
Public sector wage rise:1981(20%);1984(8%);1985(8%)。
19
Official statements:
1. Public sector wage is still lower than private sector, causing talents outflow
2. Public wage should keep path with inflation
3. In 1985, government sets the goal to raise public wage to the same level as private sector, and will enlarge the difference between the wage levels of higher and lower ranks.
4. The general compensation system will be reformed.
5. In 1985, government set per capita GNP, price index, private sector wage and the growth rate of GNP as references for public sector wage rise.
Public opinions:
1. Public sector wage is still lower than private sector, causing talents outflow.
2. Public wage should be raised more to keep path with inflation.
Remarks:
1. There are increasing opinions mentioned the pulling effect, but the main mechanism is through inflation (public wage rise → inflation grows → private wage increase).
2. The officials consistently deny that public sector wage rise may pull up private sector wage or stimulate inflation.
1987~
1991
Background:
1. Public sector wage rise: 1987(10%); 1988(8%); 1989(12%);
1990(13%); 1991(6%). From 1987 to 1998, public wage raises every year.
2. In 1987, abolishing Martial Law 3. Newly emerging labor movements
4. Manufacturers gradually move out of Taiwan Official statements:
1. Public sector wage is still lower than private sector, should raises to attract talents.
2. Public wage rise does not stimulate inflation Public opinions:
1. There are obviously political electoral reasons behind the public sector wage rise.
2. Public wage rise will stimulate inflation
3. In responding to reporters, some big private firms claim that they will use public wage as their reference, while some others won’t
20
since their wage levels are already higher than public wage
4. Workers of state owned enterprises and big private firms form trade unions, demanding the growth rate of their wage should keep path with the public wage
Remark:
1. In 1989, the Chinese Federation of Labor suggests that minimum wage adjustment should follow the public wage rise
2. In 1990, government set a plan to increase the high-end public wage to 6 times of per capita GDP and the low-end to 1.2 times.
3. The qualification rates of Senior and Junior Civil Service
Examinations grow to historically high level during the heyday of asset bubble (late 1980s to early 1990s) and reverse thereafter.
1992~
1998
Background:
Public wage rise:1992(6%);1993(8%);1994(3%);1995(5%);
1996(3%);1997(3%);1998(3%) Official statements:
1. Prime Minister Pei-Tsun Hau states that public sector wage rise has no influence on inflation and private sector wage
2. Private firms will not and don’t have to follow the public wage rise 3. Minister of Economic Affairs sings a different tune and argues that
the public wage rise does cast pressures on private firms.
Public opinions:
1. Public sector wage rise will stimulate workers in private firms to demand higher wage
2. Private should not follow public wage rise, or not in the same scale 3. Public sector wage is comparable or even higher than private sector
wage. Public sector should be downsized to raise efficiency 4. Some criticize the generous wage and welfare of public sector
employees Remark:
1. The opinions of the officials begin to diversify; the Ministry of Economic Affairs is usually against public wage rise, for it will push up the wage costs of private firms.
2. In 1997, the Labor Council tries to promote the annual collective agreement institution between the capital and labor, setting private wage rise following public wage rise, but not succeed.
3. The cases of wage rise demanding by private sector workers decrease significantly, contrary to the workers in state owned
21
enterprises.
1999~
2011
Background:
1. Public sector wage rise: 2001(3%); 2005(3%); 2011(3%).
2. The growth rates of GDP turn to negative in 2001 and 2009
3. Private sector wage stagnates for years and even slightly decreases.
Official statements:
1. Public sector wage rise will pull up private sector wage 2. Public sector wage rise will increase domestic consumptions 3. It is reasonable for civil servants to share the fruits of economic
growth Public opinions:
1. Public sector wage rise will push up the wage costs of private firms.
2. The wage and welfare of public sector employees are already on a unreasonable high level.
3. Many private firms state that they will not follow public wage rise Remark:
in 2008, Ching-Hsiou Chen, the Minister of Central Personnel
Administration, Executive Yuan, states that public wage rise will pull up private wage, stimulate domestic consumption and be positive to
economic growth. Comparing with the past, the official opinion on the pulling effect turns upside down in this period.
22
3.2 Empirical Observations of Survey Data
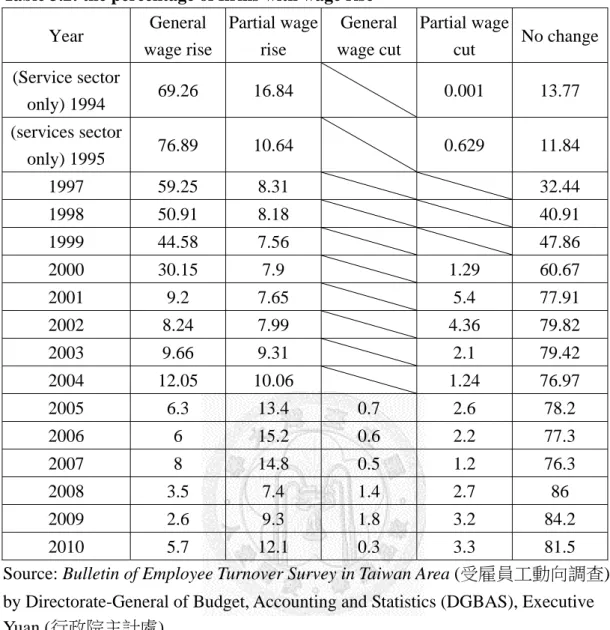
In this section, several official survey data concerning the pulling effect will be presented. We review firstly that the historical change of wage rise of overall private firms. As shown in Table 2.2, the percentage of firms with general wage rise decreases after the second half of 1990s, and drops most sharply in 2001. Largely corresponding to the dynamic of aggregate economic growth of Taiwan, this percentage revives in 2003, 2004, 2007 and 2010, while falls in other years, and some firms raise their wage in a partial form. On the other hand, the percentage of firms with no wage change increases overwhelmingly from 2000, and far surpasses the percentage of firms with general wage rise. This coincides with the results from the public opinions reviewed in previous section.
There are few official surveys which had inquired employers about the pulling effect, but only conducts in selected years. One conducts during 1986-1989 by the Labor Council, the other by the DGBAS in 1993,1995, 1997,1998, 1999, 2000, 2005 and 2010. According to the questionnaire used by DGBAS, employers firstly are asked whether they raise wage this year, if yes, then they are asked whether the public sector wage rise is one of their references for wage rise. So the result does not include the firms with no wage change.
23
Table 3.2: the percentage of firms with wage rise Year General
wage rise
Partial wage rise
General wage cut
Partial wage
cut No change (Service sector
only) 1994 69.26 16.84 0.001 13.77
(services sector
only) 1995 76.89 10.64 0.629 11.84
1997 59.25 8.31 32.44
1998 50.91 8.18 40.91
1999 44.58 7.56 47.86
2000 30.15 7.9 1.29 60.67
2001 9.2 7.65 5.4 77.91
2002 8.24 7.99 4.36 79.82
2003 9.66 9.31 2.1 79.42
2004 12.05 10.06 1.24 76.97
2005 6.3 13.4 0.7 2.6 78.2
2006 6 15.2 0.6 2.2 77.3
2007 8 14.8 0.5 1.2 76.3
2008 3.5 7.4 1.4 2.7 86
2009 2.6 9.3 1.8 3.2 84.2
2010 5.7 12.1 0.3 3.3 81.5
Source: Bulletin of Employee Turnover Survey in Taiwan Area (受雇員工動向調查), by Directorate-General of Budget, Accounting and Statistics (DGBAS), Executive Yuan (行政院主計處).
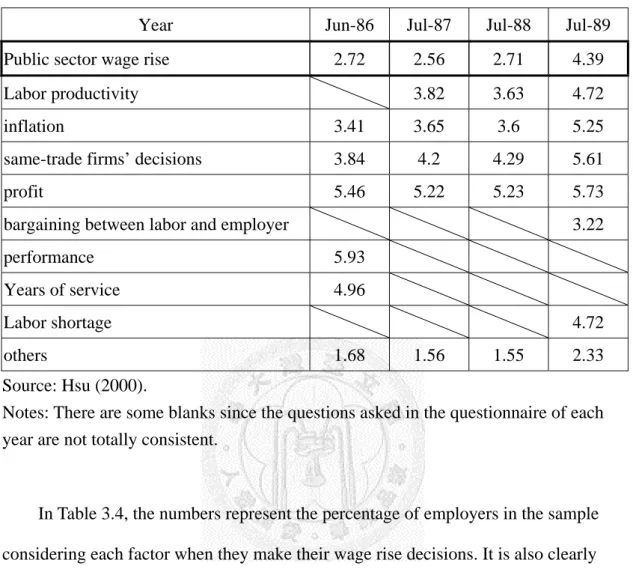
In Table 3.3, the numbers represent the relative weight among factors, 6 is the highest weight and 1 is the lowest; it is clearly that some employers do take “public sector wage rise” as a reference in their wage setting decisions, while of less weight comparing with “profit”, “same-trade firms’ decisions”, “performance”, “inflation”, and so on. Surprisingly, the weight of “bargaining between labor and employer” in 1989, which may represent the often mentioned envy-effect or labor-demand, is the second lowest only higher than “others”.
24
Table 3.3: The references used by employers in wage rise decisions (by Labor Council)
Year Jun-86 Jul-87 Jul-88 Jul-89
Public sector wage rise 2.72 2.56 2.71 4.39
Labor productivity 3.82 3.63 4.72
inflation 3.41 3.65 3.6 5.25
same-trade firms’ decisions 3.84 4.2 4.29 5.61
profit 5.46 5.22 5.23 5.73
bargaining between labor and employer 3.22
performance 5.93
Years of service 4.96
Labor shortage 4.72
others 1.68 1.56 1.55 2.33
Source: Hsu (2000).
Notes: There are some blanks since the questions asked in the questionnaire of each year are not totally consistent.
In Table 3.4, the numbers represent the percentage of employers in the sample considering each factor when they make their wage rise decisions. It is also clearly that the employers’ decisions do influenced by public sector wage rise, especially in 1993, 1995, 1998 and1999, there are more than 50% of employers taking public sector wage rise into considering when they make their wage rise decisions. But this percentage declines significantly since 2000, and the trend of declining is also shown in the Chart 3.1 below.
25
Table 3.4: The percentage of factors influencing wage rise decisions, manufacture and service sectors (%) (DGBAS)
Year
1993 (service
only)
1995 (service
only)
1997 1998 1999 2000 2005 2010
Public sector
wage rise 52.61 61.06 37.16 53.26 61.5 22.07 8.3 6.6 Productivity 48.18 37.54 24.46 24.59 19.64 22.82 21.2 65.7
Inflation 53.87 62.52 48.71 24.17 21.43 57.21 9.8 23
same-trade
firms’ decisions 62.11 64.56 60.85 62.77 69.92 63.6 17.8 41.4
profit 77.8 64.61 74.2 80.36 86.77 87.42 26.1 75.4
bargaining between labor and employer
33.34 32.58 11.51 13.3 11.9 15.76 11.4 23.2
per company
stipulation 44.4
labor shortage 42.54 49.62 minimum wage
rise 46.36
others 4.06 3.91 2.64 2.25 1.69 2.22 2.9 2.1
Source: Bulletin of Employee Turnover Survey in Taiwan Area (受雇員工動向調查), by Directorate-General of Budget, Accounting and Statistics, Executive Yuan (行政院 主計處).
Chart 3.1 shows that the percentages of employers taking public sector wage rise into considerations of their wage rise for most sectors are high during 1990s, but declines sharply since 2000. “Electricity, gas & water” has usually the highest percentage in the industry sector, and “Finance, insurance & real state” in the service sector.
26
Chart 3.1: By sector, the percentage of employers taking public sector wage rise into considerations of their wage rise (%)
Source: Bulletin of Employee Turnover Survey in Taiwan Area (受雇員工動向調查), by Directorate-General of Budget, Accounting and Statistics, Executive Yuan (行政院 主計處).
The scale of firms seems to be another factor concerning the pulling effect. Table 3.5 shows that the larger firms are more likely to increasing wage than the smaller ones, especially since 2000. Concerning the pulling effect, however, the pattern is not that clear. As shown in Table 3.6, while larger firms seem to have higher percentage than smaller ones in general, the difference is not that big and regular as in Table 3.5, and the largest firm (500 above) does not has the highest percentage in any year.
27
Table 3.5: By Scale, the percentage of firms with general wage rise (%) Number of
employees 1997 1998 1999 2000 2005 2010
500 above 92.86 89.13 83.51 73.8 41.2 50.5 300~499 93.83 81.12 79.61 70.55 30.3 40.2
200~299 91.49 81.26 71.6 56.3 20.7 33.5
100~199 84.91 80.17 72.31 58.45 23.9 31.3 30~99 79.42 71.69 65.24 50.63 14.9 21
10~29 73.31 62.67 58.66 40.02 8 10.3
9 below 50.26 45.95 38.39 25.68 4.8 4.1
Source: Bulletin of Employee Turnover Survey in Taiwan Area (受雇員工動向調查), by Directorate-General of Budget, Accounting and Statistics, Executive Yuan (行政院 主計處).
Table 3.6: By scale, the percentage of firms taking public sector wage rise into considerations of their wage rise (%)
Number of
employees 1997 1998 1999 2000 2005
500 above 46.62 50.71 51.42 33.51 21.7
300~499 45 57.2 62.5 32.63 22.8
200~299 47.78 52.72 48.74 33.76 11.7 100~199 44.68 56.11 59.64 38.85 16.7 30~99 40.46 53.16 61.91 35.48 13.2 10~29 38.23 54.05 63.34 21.54 8.1 9 below 34.29 52.74 60.76 19.62 6.1
Source: Bulletin of Employee Turnover Survey in Taiwan Area (受雇員工動向調查), by Directorate-General of Budget, Accounting and Statistics, Executive Yuan (行政院 主計處).
28
3.3 Summary
What can we learn from the discourse review and descriptive statistics above?
On the one hand, we have lots of public opinions on newspapers arguing for the existence of pulling effect. While the public opinions on newspapers may be biased since they are definitively influenced by personal motives and some political or social psychological forces, they can still be viewed as a kind of sample survey. This is especially true for those reports of the direct opinions of employers and employees.
The review above shows that many people believe the existence of pulling effect, or even take actions basing on it, and help the creation or strengthening of pulling effect in fact. On the other hand, we find that many employers answer “yes, we do take public sector wage rise into consider when we make wage rise decisions” in several official surveys. Which may be viewed as a sign of suggesting the pulling effect does work in some ways. So, since the findings of these two sections all point toward the existence of pulling effect in certain sense, a proper task left for this paper may be to test and measure it with a rigorous method.
Secondly, we also find that the public opinions and survey data concerning pulling effect are changing through time. The opinions and data suggest that pulling effect existed largely appear in 1980s and both decline in 2000s, which reflects changes in the existence and extent of pulling effect. While the reasons behind these changes are certainly far more complicated and out of the reach of this paper, it is still proper for this paper to find some ways to grasp these time-variance changes.
Thirdly, questionnaire of the official surveys presented in the second section involves almost all factors which are usually considered to be determinates of wage setting in private firms, and some of them may be also suitable for our econometric
29
analysis. We will examine these factors in the next chapters.
Fourthly, the state owned enterprises traditionally follow public sector wage rise.
But most previous studies do not distinct private sector wages from the wages of state owned enterprises, and may damage the accuracy of their results.
Fifthly, from the survey data it is plausible that the extent of pulling effect, if exist, are different among different sectors. This is also shown by Huang (1990).
However, for some limitations of data and times, this paper will not deal with this issue.
Another interesting finding is that government turns its opinion on the pulling effect upside down into the 2000s. This change of policy thinking may reflect some changes in the affecting factors of public sector wage rise, since the social, economic and political conditions change a lot between and after year 2000. But this is also far beyond the task of this paper.
30
Chapter Four Empirical Model and Data
To analysis the effect of public sector wage rise on private sector wage, the most common and direct way in the literature is to focus on private sector wage and its possible determinants, and to estimate the effect of public sector wage rise among them. Adapting this idea, this chapter use the findings presented in previous chapters as the base to select variables and specify the econometric model.
4.1 Model Specification
Concerning private sector wage, the essential microeconomic theory shows that the marginal product of labor would equal to the real price of labor when firms operate in competitive markets and try to maximize profit. Conversely, if there are some exogenous factors affect labor market outcomes and disturb this competitive character of labor markets, the marginal product of labor would not equal to the price of labor. In the literature it is used to represent marginal product of labor by the labor productivity. And since the real price of labor is the real wage, the price, or inflation, should be included.
Some factors included in the two official surveys presented in the last chapter can be used for reference. Except “public sector wage rise”, “labor productivity” and
“inflation”, they also include “same-trade firms’ decisions”, “profit”, “bargaining between labor and employer”, “performance”, “years of service”, “per company stipulation”, “labor shortage”, and “minimum wage rise”. Some of these factors are
31
obviously confined to the characteristics of individual employee, such as
“performance”, “years of service” which are not suitable for this paper. “Same-trade firms’ decisions”, “per company stipulation” and “bargaining between labor and employer” may be meaningful for this paper but not clearly defined or measureable.
What remains are the “labor shortage”, “minimum wage rise”, and “profit”. While
“profit” is quite meaningful, there is no proper statistical series with enough length for it. “Minimum wage rise” is long found to be weakly or no effect on the overall private sector wage dynamics in the literature (Wu et al., 2009), and is another complicated issue about public interventions beyond the scope of this paper. “Labor shortage” can be represented by the rate of unemployment, but there are some ambiguities about its meaning within model specifications need to clarify.
Since we deal with the time series data, it is often observed that the value in the series at time t is likely related with, or can be largely predicted by, the value at time t-1. That’s why many researchers add lagged term into their model. As for the pulling
effect issue in question, it is not uncommon for workers or reporters to refer to wage rises in the past when discussing about the wage rise in the future. It may be worth of testing this proposition in our analysis.
We then set our basic econometric model as follow:
Wp
t : growth rate of private sector wage.Wp
t-1 : lagged growth rate of private sector wage rise.Wg
t-1,Wg
t,Wg
t+1: lagged, current and advanced term of the rate of public sector wage rise. Since public sector wage rise is usually discussed and announced in32
advance of its implementation for about 1 to 1.5 year, and there are some uncertainties about when does private sector responds, so we would add a lagged, a current and also an advanced term into the model to grasp this character.
CPI
t : growth rate of consumer price index.LP
t : growth rate of labor productivity.U
t : growth rate of unemployment.e
t : unexplained error termConcerning the form of dependent variable
Wp
t, in the literature some studies employ wages per employee in level values (Friberg, 2007; Jacobson and Ohlsson, 1994), while some focus on the growth rate (Afonso and Gomes, 2008). This paper prefers growth rates, since our aim is to assess the pulling effect of public sector wage rises which are always announced in the form of growth rate by Taiwanesegovernment. All other variable are transfer to growth rate to keep the explanatory consistency.
4.2 Data Source
Wp
t : There are several official survey on private sector wage, but most of them do not distinct the wage of private firms from the wage of state owned enterprises.Since state owned enterprises are often embodied with very different market environments and operation conditions, and most importantly, usually follow public sector wage rise, it may make our estimation biased. The data series of private sector wage rise used in this paper is confined particularly in the wage of private sector, which is taken from the National Accounts Yearbook.
33
Wg
t: We take the rate of public sector wage rise from the record published by Directorate-General of Personnel Administration, Executive Yuan, which is presented in the form of the announced rate of wage rise in particular years, rather than the real wage level. Because Taiwanese government does not publish the average wage of public sector employees, it is this rate the object recognized and discussed by the public around the issue in question.CPI
t : From Price Statistics Monthly published by Directorate General of Budget, Accounting and Statistics, Executive Yuan.LP
t : There are several ways to calculate labor productivity. Following Hsin (1988), this paper calculate labor productivity from: Real Domestic Factor Income – Private Enterprises ÷ Number of Employees in Private Sector. To obtain the longest series and to keep coordinate withWp
t , the Real Domestic FactorIncome – Private Enterprises is also taken from the National Accounts Yearbook, and the Number of Employees in Private Sector is taken from the Yearbook of Manpower Survey Statistics in Taiwan Area.
U
t : From Yearbook of Manpower Survey Statistics in Taiwan Area.The duration of data series used in this paper is from 1960-2010. For more details about the method of calculations, please see Appendix.
34
Chapter Five Empirical Findings
In this chapter, the econometric analysis is conducted as follow: 1) in the first section, we estimate the existence and extent of pulling effect for full sample points, after a series of tests, such as of stationarity and of multicollinearity, and a procedure of variables selection; 2) in the second section, the change in the extent of pulling effect over different periods is analyzed by rolling regression, and backward / forward recursive regression.
5.1 The Existence and Extent of Pulling Effect: Several Tests, Full Sample Regression and Variables Selection
There are basically five time series data used in this paper: Wpt, Wgt, CPIt, LPt
and Ut, which are all in the form of growth rate. For time series data is often suffered from being non-stationary, we implement unit-root tests firstly, and do necessary modifications if non-stationary. Secondly, to avoid the problem of multicollinearity and residual autocorrelation, we check covariance coefficients among explanatory variables and also the pattern of residual of each model. Thirdly we apply causality test to check if our estimation results reliable.
35
5.1.1 Unit-root test
It is said that “Anyone who tries to analyses a time series without plotting it first is seeking for troubles”, so we do plotting as below to observe the characteristics of our series.
Observing these plots, there is seemly a drift within most series except change rate of unemployment. Besides, for the series of growth rate of private sector wage, it is usually higher in the first half and seems to be a slightly downward trend, as the same as the series of growth rate of public sector wage and consumer price index. For the growth rate of labor productivity and change rate of unemployment, there is seemly no clear trend within.
36
Chart 5.1: Time series plotting
37
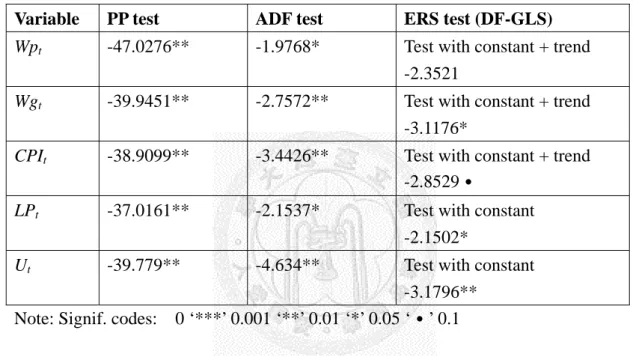
The traditional practice in formally testing the unit-root problem is to conduct Phillips-Perron test (PP test) and Augmented Dicky-Fuller test (ADF test). According to Maddala and Kim (1998), however, these two tests are suspect for low power. So we implement Elliott-Rothenberg-Stock test (ERS test) further. The results are shown in Table 5.1.
Table 5.1: Unit root tests
Variable PP test ADF test ERS test (DF-GLS) Wpt -47.0276** -1.9768* Test with constant + trend
-2.3521
Wgt -39.9451** -2.7572** Test with constant + trend -3.1176*
CPIt -38.9099** -3.4426** Test with constant + trend -2.8529˙
LPt -37.0161** -2.1537* Test with constant -2.1502*
Ut -39.779** -4.634** Test with constant
-3.1796**
Note: Signif. codes: 0 ‘***’ 0.001 ‘**’ 0.01 ‘*’ 0.05 ‘˙’ 0.1
The PP / ADF tests suggest that our variables are stationary time series, but according to the ERS test, most of them are trend stationary, embodied with a trend and/or a constant, while Wpt cannot be transformed to stationary even by
differentiating several orders.
We decide to follow basically the results of ERS test, since the power of PP / ADF test is more suspect. However, we will use de-trend rather than usual
differentiation method to obtain stationary series, for differentiation will cost us valuable sample points. We apply the de-trend modification to the series Wpt too.
38
To remove the constant and deterministic trend of a time series, we can estimate a series with a trend and a constant (drift) by the following regression:
After running this regression, we obtain
Where the estimated error term, , represents the de-trend Wpt series. We obtain the de-trend Wgt, CPIt series in the same way. For the series with a constant (drift), LPt
and Ut, we first calculate its expectation (mean) and then subtract it from the series, like:
5.1.2 Full sample regression
After obtaining stationary time series, we now turn to estimate the effects of explanatory variables on Wpt, and put special attentions on the effect of Wgt. We will try different variables step by step under the guidance drawn from previous chapters, moving toward the model specified in chapter 4. Basing on the different performances of different models, the most well fitted model will be selected out by the theoretical judgment, also by the help from several tools including stepwise regression
(bidirectional elimination), calculating AIC and VIF, and employing Durbin-Watson test and Breusch-Godfrey test.
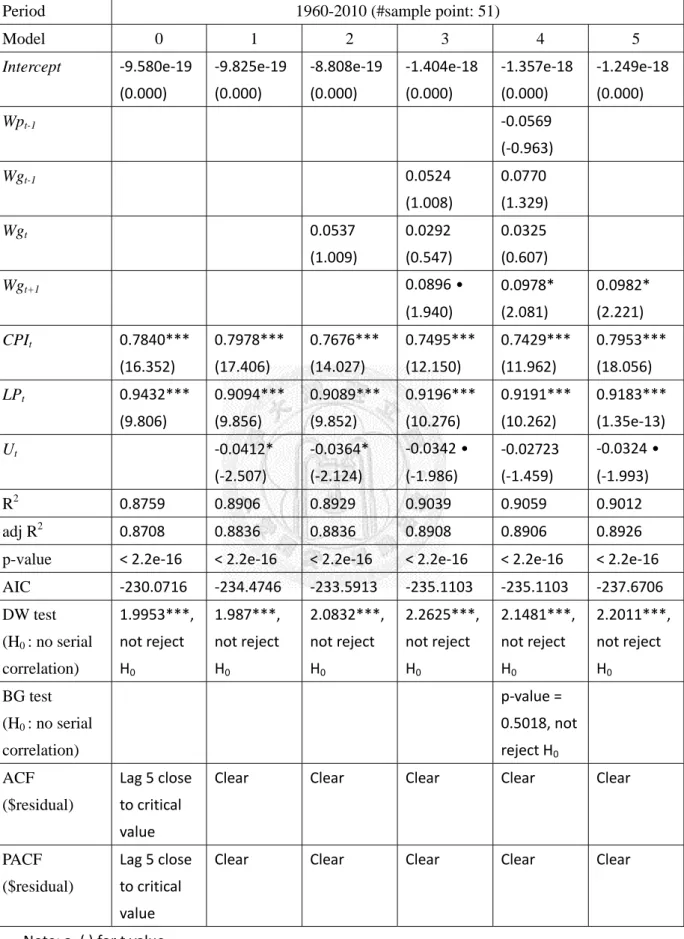
The results are presented in Table 5.2.
39
Table 5.2: Full sample regression
Note: a. ( ) for t value
b. Signif. codes: 0 ‘***’ 0.001 ‘**’ 0.01 ‘*’ 0.05 ‘˙’ 0.1
Period 1960-2010 (#sample point: 51)
Model 0 1 2 3 4 5
Intercept -9.580e-19 (0.000)
-9.825e-19 (0.000)
-8.808e-19 (0.000)
-1.404e-18 (0.000)
-1.357e-18 (0.000)
-1.249e-18 (0.000)
Wpt-1 -0.0569
(-0.963)
Wgt-1 0.0524
(1.008)
0.0770 (1.329)
Wgt 0.0537
(1.009)
0.0292 (0.547)
0.0325 (0.607)
Wgt+1 0.0896˙
(1.940)
0.0978*
(2.081)
0.0982*
(2.221)
CPIt 0.7840***
(16.352)
0.7978***
(17.406)
0.7676***
(14.027)
0.7495***
(12.150)
0.7429***
(11.962)
0.7953***
(18.056)
LPt 0.9432***
(9.806)
0.9094***
(9.856)
0.9089***
(9.852)
0.9196***
(10.276)
0.9191***
(10.262)
0.9183***
(1.35e-13)
Ut -0.0412*
(-2.507)
-0.0364*
(-2.124)
-0.0342˙
(-1.986)
-0.02723 (-1.459)
-0.0324˙
(-1.993)
R2 0.8759 0.8906 0.8929 0.9039 0.9059 0.9012
adj R2 0.8708 0.8836 0.8836 0.8908 0.8906 0.8926
p-value < 2.2e-16 < 2.2e-16 < 2.2e-16 < 2.2e-16 < 2.2e-16 < 2.2e-16
AIC -230.0716 -234.4746 -233.5913 -235.1103 -235.1103 -237.6706
DW test (H0 : no serial correlation)
1.9953***, not reject H0
1.987***, not reject H0
2.0832***, not reject H0
2.2625***, not reject H0
2.1481***, not reject H0
2.2011***, not reject H0
BG test (H0 : no serial correlation)
p-value = 0.5018, not reject H0 ACF
($residual)
Lag 5 close to critical value
Clear Clear Clear Clear Clear
PACF ($residual)
Lag 5 close to critical value
Clear Clear Clear Clear Clear
40
Model 0 is the most basic model, indicating directly by the essential economic theory. Model 0 performs well in our data series except few concerns about the residual correlation. Model 1 adds the variable about labor market condition Utinto regression, and also performs well for increasing the fitness of model (R2, AIC) and reducing the residual correlation.
Next, Wgt is added into Model 2. We find that the coefficient of Wgt is
insignificant statistically, R2 and adjusted R2 have basically no change, and the value of AIC raises a little. These all indicate to the poor explanatory power of variable Wgt. In Model 3, the pulling effect is measured by the lagged, current and advanced term of public sector wage rise, and it is Wgt+1, the advanced term of public sector wage rise, to be significant statistically rather than Wgt-1 while Wgt remains insignificant.
We also find that R2, adjusted R2 and AIC are all improved. All previous studies try to capture the pulling effect by Wgt, but Model 3 implies that the pulling effect may exist and work through Wgt+1.
In Model 4, we add Wpt-1 into regression and find that R2, adjusted R2 and AIC are all basically have no change while the Wpt-1 is insignificant statistically. This may imply for poor explanatory of Wpt-1.
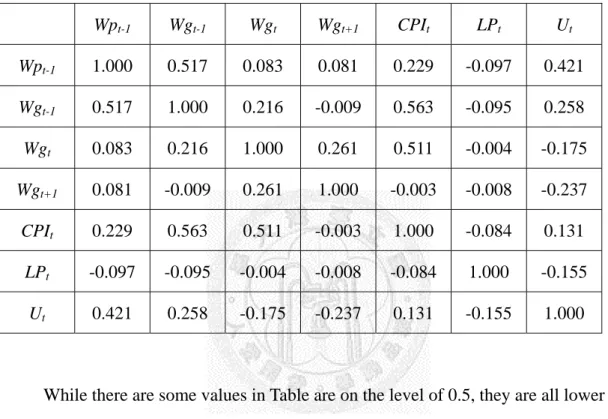
Besides, we notice the changes occurred to the coefficients of Wgt+1, Wgt, Wgt-1, and Ut,which may indicate to the problem of muliticollinearity. As we already find that Wgt+1 and Ut are good explanatory variables for Wpt, the occurrence of
muliticollinearity is quite understandable since Wgt and Ut are in the similar relation to Wpt-1.
It is worth noting that we had tried transforming Wgt+1 into a dummy variable, and the coefficient became insignificant statistically, which may imply that the average pulling effect is not very strong. Besides, we had replaced LPt with the growth rate of GDP (GDPt) in Model 0~5 to capture the possible influence of general
41
economic dynamics. We found that GDPt was significant and Wgt+1 became
insignificant, but at the same time the R2 in each model was lower, which may mean that the explanatory power of GDPt is not as good as LPt.
Model 5 shows that 1% of increasing public sector wage will lead to an increase of private sector wage growth about 0.1%. We can also calculate the long-range effect of Wgt+1 form Model 4 by 0.0978 / 1-(-0.0569) = 0.0925.
5.1.3 Detecting Muliticollinearity
To explore the effect of Wpt-1 and the possible multicollinearity among variables, we at first calculate the autocorrelation function (ACF) and partial autocorrelation function (PACF) of Wpt to check its autocorrelation. As the Chart 5.2 below shows, there is no serious autocorrelation in Wpt.
Chart 5.2: Check autocorrelation of Wpt