Leukemia WEHI-3 Cells In Vivo, and Stimulates Macrophage Phagocytosis and Natural Killer Cell Cytotoxicity in Leukemic Mice
Fu-Shun Yu,
1Jai-Sing Yang,
2Chun-Shu Yu,
3Jo-Hua Chiang,
4Chi-Cheng Lu,
4Hsiung-Kwang Chung,
5,6Chien-Chih Yu,
3Chih-Chung Wu,
7Heng-Chien Ho,
8*Jing-Gung Chung
9,10*1
Department of Dental Hygiene, China Medical University, Taichung 404, Taiwan
2
Department of Pharmacology, China Medical University, Taichung 404, Taiwan
3
School of Pharmacy, China Medical University, Taichung 404, Taiwan
4
Department of Life Sciences, National Chung Hsing University, Taichung 402, Taiwan
5
Graduate Institute of Clinical Medical Science, China Medical University, Taichung 404, Taiwan
6
Department of Otorhinolaryngology-Head and Neck Surgery, China Medical University Hospital, Taichung 404, Taiwan
7
Department of Nutrition and Health Sciences, Chang Jung Christian University, Tainan 711, Taiwan
8
Department of Biochemistry, China Medical University, Taichung 404, Taiwan
9
Department of Biological Science and Technology, China Medical University, Taichung 404, Taiwan
10
Department of Biotechnology, Asia University, Taichung 413, Taiwan
Received 14 February 2011; revised 7 June 2011; accepted 20 June 2011
ABSTRACT: Many anticancer drugs are obtained from phytochemicals and natural products. However, some phytochemicals have mutagenic effects. Safrole, a component of Piper betle inflorescence, has been reported to be a carcinogen. We have previously reported that safrole induced apoptosis in human oral cancer cells in vitro and inhibited the human oral tumor xenograft growth in vivo. Until now, there is no information addressing if safrole promotes immune responses in vivo. To evaluate whether safrole modu- lated immune function, BALB/c mice were intraperitoneally injected with murine myelomonocytic WEHI-3 leukemia cells to establish leukemia and then were treated with or without safrole at 4 and 16 mg/kg. Ani- mals were sacrificed after 2 weeks post-treatment with safrole for examining the immune cell populations, phagocytosis of macrophages and the natural killer (NK) cells’ cytotoxicity. Results indicated that safrole
*These authors contributed equally to this work.
Correspondence to: J.-G. Chung; e-mail: [email protected] Contract grant sponsor: China Medical University; Contract grant num- ber: CMU96-066
Contract grant sponsor: Taiwan Department of Health, China Medical University Hospital Cancer Research Center of Excellence
Contract grant number: DOH100-TD-C-111-005
Published online in Wiley Online Library (wileyonlinelibrary.com).
DOI 10.1002/tox.20756
increased the body weight, and decreased the weights of spleen and liver in leukemic mice. Furthermore, safrole promoted the activities of macrophages phagocytosis and NK cells’ cytotoxicity in leukemic mice when compared with untreated leukemic mice. After determining the cell marker population, we found that safrole promoted the levels of CD3 (T cells), CD19 (B cells) and Mac-3 (macrophages), but it did not affect CD11b (monocytes) in leukemic mice. In conclusion, safrole altered the immune modulation and inhibited the leukemia WEHI-3 cells in vivo.
#2011 Wiley Periodicals, Inc. Environ Toxicol 00: 000–000, 2011.Keywords: safrole; murine leukemia WEHI-3 cells; macrophage phagocytosis; NK cell cytotoxicity;
leukemic mice
INTRODUCTION
It is well documented that diet can play a vital role in can- cer prevention (Chen and Xu, 2010). Increased consump- tion of a plant-based diet may reduce the risk of cancer de- velopment from epidemiological and animal studies (Mah- moud et al., 2000; Mutoh et al., 2000; Wenzel et al., 2000;
Chiang et al., 2011). Leukemia is one of cancer-related cause death worldwide. About 3.7 individuals per 100,000 die each year from leukemia in the United States (Jensen et al., 2004). Based on a 2009 report of the Department of Health, Executive Yuan, Taiwan, about 4/100,000 individu- als die of leukemia in Taiwan (Lin et al., 2011). At present, there is going attention to discover chemotherapy for leuke- mia, and it is vital for treatment approach.
In Taiwan, it was reported that people chewing betel quid containing Piper betle inflorescence or leaf, an Asian climbing tropical plant (Piperaceae family), induced high concentration of safrole (420 lM) in the saliva to increase the risk of oral caner (Wang and Hwang, 1993; Chen et al., 1999). Although safrole has been recognized to be as a group 2B carcinogen, there are no adequate evidences elu- cidating the relationship between exposure to safrole and human cancers (IARC, 1976). Safrole has been reported to cause marked [Ca
21] elevation and decrease cell viability in human osteosarcoma cells (Lin et al., 2006), and binds to DNA forming safrole-DNA adducts (Daimon et al., 1997, 1998; Lee et al., 2005).
It was reported that safrole reduced the bactericidal ac- tivity of polymorphonuclear leukocytes (PMNs) against Actinobacillus actinomycetemcomitans and it also decreased the release of superoxide anions from PMNs (Hung et al., 2003). Our previous studies have shown that safrole induced apoptosis in human oral cancer HSC-3 cells in vitro and reduced xenograft mice model in vivo (Yu et al., 2011b). Also, safrole induced apoptotic death in human tongue squamous cancer SCC-4 cells via mitochon- dria-dependent caspases activation signaling (Yu et al., 2011a). Currently, there is no report showing the effects of safrole on the function of immune system of leukemic mice in vivo. This study investigated that safrole might promote phagocytosis of macrophages and increase cytotoxicity of natural killer (NK) cells from leukemic BALB/c mice in vivo.
MATERIALS AND METHODS Materials and Reagents
Safrole, dimethyl sulfoxide (DMSO), and propidium iodide (PI) were obtained from Sigma-Aldrich Corp. (St. Louis, MO). RPMI-1640 medium, fetal bovine serum (FBS), peni- cillin-streptomycin and L-glutamine were obtained from Invitrogen Life Technologies (Carlsbad, CA).
Murine WEHI-3 Leukemia Cell Line
The WEHI-3 murine myelomonocytic leukemia cell line was obtained from the Food Industry Research and Devel- opment Institute (Hsinchu, Taiwan). Cells were cultured in culture plastic flasks (75-cm
2) at 378C under a humidified 5% CO
2atmosphere in RPMI-1640 medium supplemented with 10% FBS, 2 mM
L-glutamine, 100 units/mL penicillin, and 100 lg/mL streptomycin. The cells were cultivated for two complete cycles in an incubator.
Male BALB/c Mice
Fifty male BALB/c mice 6 weeks of age and ~22–28 g in weight were obtained from the Laboratory Animal Center, College of Medicine, National Taiwan University (Taipei, Taiwan). Animals for this study were used according to the institutional guidelines (Affidavit of Approval of Animal Use Protocol, No. 96-147-C) approved by the Institutional Animal Care and Use Committee (IACUC) of China Medi- cal University (Taichung, Taiwan).
Establish Leukemic Mice and Safrole Treatment
Fifty BALB/c mice were randomly divided into 5 groups to
receive different treatments. Three groups of 10 mice per
group were intraperitoneally (i.p.) injected with 1 3 10
5WEHI-3 cells per mouse and maintained for 2 weeks to
generate the leukemic mice model (Glass et al., 1996; Yang
et al., 2006). Thereafter, these mice were randomly distrib-
uted into 3 different groups receiving vehicle only (olive
oil) and safrole (4 and 16 mg/kg) (Yu et al., 2011b). The
other twenty normal mice served as the control (10
animals) or were treated with vehicle (olive oil; 10 ani- mals), respectively. Safrole was administered by oral ga- vage to treating the groups by the above doses daily for up to 2 weeks before being weighed and sacrificed.
Weights of Body, Spleen, and Liver Tissues All animals were weighed and blood was withdrawn.
Spleen and liver samples were isolated and weighed indi- vidually (Tsou et al., 2009; Lin et al., 2010).
Phagocytic Activity of Macrophages
PHAGOTEST kit (Glycotope Biotechnology GmbH, Hei- delberg, Germany) was used to measure the phagocytosis as previously described (Lin et al., 2010; Yu et al., 2010).
At the end of treatment, heparinized blood samples of 1 mL from all experimental mice were collected before animals were sacrificed. Peritoneal macrophages from each mouse in safrole-treated or untreated groups were isolated as described elsewhere (Hendriks et al., 2008). ~1 3 10
5leuko- cytes in 100 lL of whole blood and peritoneal cavity from each treatment of all groups were incubated for 1 h at 37 8C with fluorescein isothiocyanate (FITC)-labeled opsonized Escherichia coli (E. coli) (2 3 10
7bacteria in 20 lL 1X so- lution from the kit). The quenching solution (100 lL) was added to the reaction and then the whole blood is lysed and fixed with 2 mL of 1X lysing solution for 20 min at room temperature according to the manufacturer’s instruction.
After the completion of phagocytosis by macrophages, DNA was stained according to the manufacturer’s protocol.
Cells from each sample were analyzed by flow cytometery (Becton Dickinson, FACSCalibur
TM, Franklin Lakes, NJ) as previously described (Lin et al., 2010). Fluorescence data were collected on 10,000 cells and analyzed using the BD CELLQUEST Pro software.
Whole Blood Samples and
Immunofluorescence Staining for Surface Markers
The blood samples of 500 lL from each group were indi- vidually exposed to 1X Pharm Lyse
TMlysing buffer (BD Biosciences, San Jose, CA) for lysing of the red blood cells.
Subsequently, all samples were centrifuged for 15 min at 350 3 g at 48C and washed with phosphate buffer saline (PBS). The isolated white blood cells from each treatment were stained by the FITC-conjugated antimouse CD3, phy- coerythrin (PE)-conjugated antimouse CD19, PE-conju- gated antimouse Mac-3 and FITC-conjugated antimouse CD11b antibodies (BD Pharmingen Inc, San Diego, CA) before being analyzed to determine the levels of cell markers by flow cytometry as previously described (Lin et al., 2010; Yu et al., 2010).
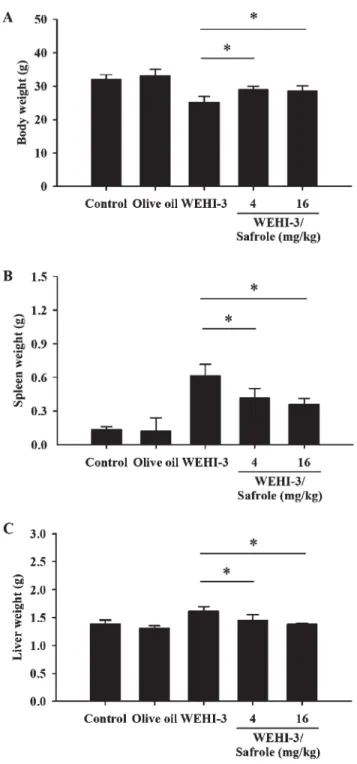
Fig. 1. Safrole affected the body, spleen, and liver weights of leukemic BALB/c mice. The animals were intraperitoneally injected with WEHI-3 cells (1 3 10
5cells/100 lL per mouse) for 2 weeks and then orally treated with or without safrole (4 and 16 mg/kg/mice) for 2 weeks. The body (A), spleen (B), and liver (C) weights were weighted as described in the
‘‘Materials and Methods’’ Section. Each point is mean 6 S.D
(n 5 10).*p \ 0.05 was considered significant when com-
pared with the WEHI-3 leukemic mice.
NK Cell Cytotoxicity
At the end of treatment, the fresh spleens from all experi- mental mice were processed to isolate splenocytes (Chang et al., 2009; Lin et al., 2010). About 1 3 10
5splenocytes in 1 mL RPMI-1640 medium were cultured in each well of 24- well culture plates. About 1 3 10
6of YAC-1 cells were cul- tured in 15 mL tubes with serum-free RPMI-1640 medium and then PKH-67/Diluent C buffer (Sigma-Aldrich Corp.) was added to the cells, mixed thoroughly for 2 min at 25 8C then 2 mL PBS was added for 1 min. RPMI-1640 medium at 4 mL was added for a 10 min-incubation then were followed by centrifugation at 350 3 g of 258C. YAC-1 cells in 100 lL were placed on 96-well plates before the addition of the leukocytes from each treatment to the wells for 12 h and determination of NK cell cytotoxic activity by a PI exclusion assay and flow cytometry as previously described (Chang et al., 2009; Lin et al., 2010; Lu et al., 2010).
Statistical Analysis
The results were expressed as mean 6 S.D. and the differ- ence between control and safrole-treated groups was ana- lyzed by one-way the analysis of variance (one-way ANOVA) followed by Dunnett’s test. A p-value of less than 0.05 was taken as significant.
RESULTS
Safrole Affected the Body, Spleen, and Liver Weights in WEHI-3 Leukemic BLAB/c Mice At the end of safrole treatment, body weights of each ani- mal were weighed then spleen or liver tissues were isolated and were weighed. Safrole increased the body weights of each treatment as compared with the leukemic mice group Fig. 2. Safrole stimulated phagocytotic activity of PBMC and peritoneal cavity in leukemic mice. Macrophages were isolated from PBMC (A and B) and peritoneal cavity (C and D) of each group from normal and leukemic BALB/c mice after exposure to 4 and 16 mg/kg/day of safrole by oral administration for 14 days. The percentages of phagocytosis with phagocyte green flu- orescent particles (FITC-E. coli.) after safrole oral treatment were determined by flow cytometric analysis as described in the
‘‘Materials and Methods’’ Section. Each point is mean 6 S.D (n 5 10). *p \ 0.05 was considered significant when compared
with the WEHI-3 leukemic mice.
Fig. 3. Safrole affected the levels of cell markers in white blood cells from BALB/c leukemic mice. The animals were intraperi- toneally injected with WEHI-3 cells (1 3 10
5cells/mouse) for 2 weeks and orally treated with or without safrole for 2 weeks.
Blood was collected from each group of animal and analyzed for cell surface markers by flow cytometry as described in the
‘‘Materials and Methods’’ Section. The profiles from flow cytometric analysis by using BD CELLQUEST Pro software were
shown the levels of CD3 (X-axis) and CD19 (Y-axis) double staining (A), CD11b (B) as well as Mac-3 (C). The data are
expressed the similar results at least three experiments. [Color figure can be viewed in the online issue, which is available at
wileyonlinelibrary.com.]
[Fig. 1(A)]. Also, safrole significantly decreased the weights of spleen [Fig. 1(B)] and liver [Fig. 1(C)] tissues in comparison to WEHI-3 cells-injected mice in vivo.
Safrole Promoted the Phagocytosis by Macrophages from Peripheral Blood Mononuclear Cells (PBMC) and
Peritoneal Cavity in WEHI-3 Leukemia BALB/c Mice
To investigate whether or not safrole affected phagocytosis, the leukocytes from safrole-treated or untreated groups were isolated and phagocytic activity was measured.
Safrole (4 and 16 mg/kg/day) promoted the activity of phagocytosis from PBMC (4 mg/kg/day: 16.4%; 16 mg/kg/
day: 6.0%) [Fig. 2(A,B)] and peritoneal cavity (4 mg/kg/
day: 6.5%; 16 mg/kg/day: 12.1%) [Fig. 2(C,D)] from leuke- mic mice by comparison to control (untreated leukemic mice).
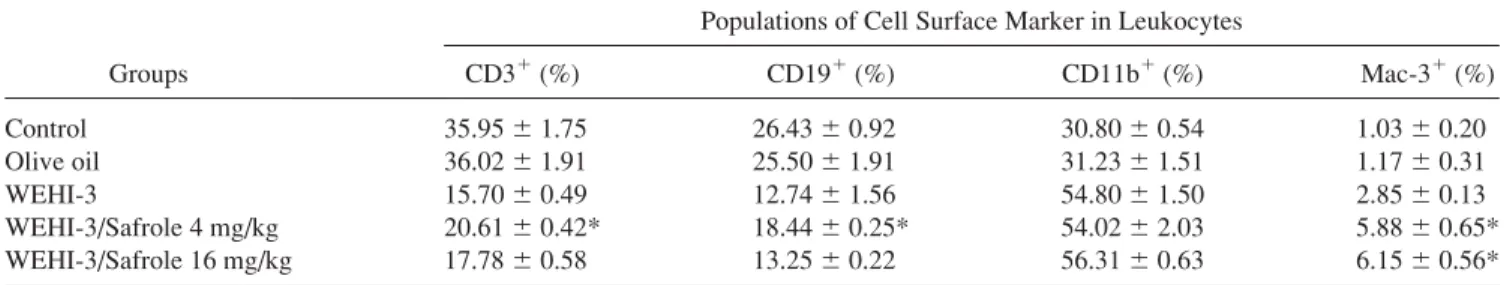
Safrole Altered the Surface Markers of Whole Blood Cells from WEHI-3 Leukemic BALB/c Mice
To investigate whether safrole affected the levels of cell surface marker, leukocytes from normal and leukemic mice in the absence and presence of safrole exposure were iso- lated and levels of CD3, CD19, Mac-3, and CD11b were determined by flow cytometric analysis. Safrole increased the levels of CD3 [Fig. 3(A) and Table I] (4 mg/kg/day:
5.3%), CD19 [Fig. 3(A) and Table I)] (4 mg/kg/day: 5.9%) and Mac-3 [Fig. 3(C) and Table I] (4 mg/kg/day: 3.6%; 16 mg/kg/day: 3.8%), but it did not significantly affect the level (p [ 0.05) of CD11b [Fig. 3(D) and Table I] when compared with the leukemic group without safrole treatment.
Safrole Affected NK Cell Cytotoxic Activity of Splenocytes from WEHI-3 Leukemia BALB/c Mice
To determine whether safrole affects NK cell cytotoxicity, splenocytes from safrole-treated or untreated groups were isolated and NK cell cytotoxicity was determined by flow cytometry. YAC-1 target cells were killed by NK cells derived exclusively from the higher dose of safrole tested (16 mg/kg/day) compared to the untreated control leukemic mice. Safrole at the higher dose tested (16 mg/kg/day) was effective at both target ratios of 50/1 and 25/1 as shown in Figure 4.
TABLE I. Effects of cell surface markers of white blood cells from normal and leukemic BALB/c mice
Groups
Populations of Cell Surface Marker in Leukocytes
CD3
1(%) CD19
1(%) CD11b
1(%) Mac-3
1(%)
Control 35.95 6 1.75 26.43 6 0.92 30.80 6 0.54 1.03 6 0.20
Olive oil 36.02 6 1.91 25.50 6 1.91 31.23 6 1.51 1.17 6 0.31
WEHI-3 15.70 6 0.49 12.74 6 1.56 54.80 6 1.50 2.85 6 0.13
WEHI-3/Safrole 4 mg/kg 20.61 6 0.42* 18.44 6 0.25* 54.02 6 2.03 5.88 6 0.65*
WEHI-3/Safrole 16 mg/kg 17.78 6 0.58 13.25 6 0.22 56.31 6 0.63 6.15 6 0.56*
Results show significant differences between values for WEHI-3 leukemic mice and safrole treatment groups. Mice after intraperitoneal injection with WEHI-3 cells (13105cells/mouse) for 2 weeks were exposed to safrole (4 and 16 mg/kg) for 2 weeks by oral administration. Thereafter, leukocytes in hepari- nized whole blood from each group of mice were stained with FITC anti-mouse CD3, PE anti-mouse CD19, PE anti-mouse Mac-3, and FITC anti-mouse CD11b antibodies, respectively, for determining cell surface markers by using flow cytometric analysis as described in the ‘‘Materials and Methods’’ Section.
An asterisk (*) is considered significant (p\ 0.05) by one-way ANOVA followed by Dunnett’s test and all data were expressed as the mean 6 S.D. (n 5 10).