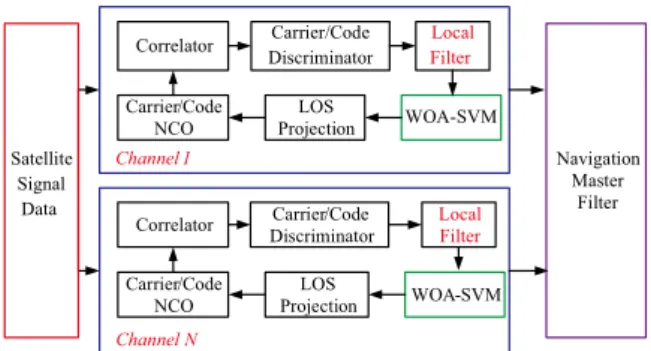
THE WHALE ALGORITHM OPTIMIZED SUPPORT VECTOR MACHINE FOR CHANNEL QUALITY CONTROL OF GNSS VECTOR TRACKING LOOP
8
0
0
全文
(2)
(3)
(4)
(5)
(6)
(7)
(8)
數據
相關文件
7A105 Receiving equipment for Global Navigation Satellite Systems (GNSS; e.g. GPS, GLONASS, or Galileo), other than those specified in 7A005, having any of the
• The ArrayList class is an example of a collection class. • Starting with version 5.0, Java has added a new kind of for loop called a for each
The best way to picture a vector field is to draw the arrow representing the vector F(x, y) starting at the point (x, y).. Of course, it’s impossible to do this for all points (x,
If x or F is a vector, then the condition number is defined in a similar way using norms and it measures the maximum relative change, which is attained for some, but not all
Keywords Support vector machine · ε-insensitive loss function · ε-smooth support vector regression · Smoothing Newton algorithm..
support vector machine, ε-insensitive loss function, ε-smooth support vector regression, smoothing Newton algorithm..
Abstract In this paper, we study the parabolic second-order directional derivative in the Hadamard sense of a vector-valued function associated with circular cone.. The
In case of non UPnP AV scenario, any application (acting as a Control Point) can invoke the QosManager service for setting up the Quality of Service for a particular traffic..
