科技部補助專題研究計畫報告
雙極性情感疾患之胰島素抗性與腦功能研究(第二、三年)
報 告 類 別 : 成果報告 計 畫 類 別 : 個別型計畫
計 畫 編 號 : MOST 108-2314-B-006-045- 執 行 期 間 : 108年08月01日至109年07月31日 執 行 單 位 : 國立成功大學醫學系精神科
計 畫 主 持 人 : 陳柏熹
計畫參與人員: 碩士級-專任助理:韓伊涵
本研究具有政策應用參考價值:■否 □是,建議提供機關
(勾選「是」者,請列舉建議可提供施政參考之業務主管機關)
本研究具影響公共利益之重大發現:□否 □是
中 華 民 國 109 年 10 月 29 日
中 文 摘 要 : 流行病學調查顯示30-50%之情緒疾患個案同時罹患代謝異常,且兩 者之間具有雙向性關聯。重要的是研究顯示葡萄糖代謝異常會影響 雙極性情感疾患之病程,其中合併代謝異常者之治療反應較差。其 可能的原因之一是胰島素抗性本身對大腦有直接之作用,因而影響 其預後。由此推論,胰島素抗性的作用可能造成雙極性情感疾患腦 部之變化。然而,至今僅有少數研究探討雙極性情感疾患個案之腦 部變化與其合併葡萄糖代謝異常間之相關。為此,本計畫將系統性 評估葡萄糖代謝正常、糖尿病前期、糖尿病雙極性情感疾患個案之 葡萄糖代謝狀態,神經認知功能,腦結構與功能。計劃中我們將由 成大醫院招募一百五十位年齡在十八到六十五歲之間,接受接受包 含丙戊酸或鋰鹽等情緒穩定劑治療,符合DSM 5診斷準則之雙極性情 緒疾患受試者。其精神病理症狀將以漢氏憂鬱量表以及楊氏躁症量 表評估。 個案之長期治療反應將以Alda 量表評估。本計劃之目標 包含: (1) 評估周邊胰島素抗性之嚴重度與雙極性情緒疾患個案神 經認知功能表現之相關性。此外,將運用類澱粉蛋白正子掃描檢查 罹患糖尿病之雙極性情感疾患個案腦中是否產生類澱粉蛋白病變;
(2) 運用 [99mTc]TRODAT 單光子電腦斷層造影比較各組個案間大 腦紋狀體之多巴胺轉運體數量; 以及(3)使用基於體素的腦形態測量 與靜息/活化態功能性核磁共振影像比較各組個案間之可能差異。除 此之外,將探討上述各種腦功能/型態之變異是否與個案之精神病理 嚴重度、神經認知功能變化或長期病程相關。最後我們將嘗試運用 胰島素抗性指數以及上述腦影像功能指標作為雙極性情緒疾患之生 物指標,建立雙極性情緒疾患之分期系統。未來將可用於辨認特定 個案族群,以利給予該個案所需藥物以及非藥物介入,避免雙極性 情感疾患個案神經功能退化之發生。
中 文 關 鍵 詞 : 澱粉樣β-蛋白病變,雙極性情感性疾患,失智,多巴胺轉運體,胰 島素抗性
英 文 摘 要 : Background: Insulin sensitivity is associated with
neurocognitive trajectory and connectivity pattern within reward networks. High prevalence of insulin resistance has been reported in bipolar disorder (BD) patients.
Importantly, impaired insulin sensitivity could modulate the course and treatment outcome in BD. Here we
hypothesized that insulin sensitivity could be potentially associate with neurocognitive trajectory and aberrant frontal-striatal circuit connectivity in euthymic phase of BD.
Objectives: We aimed to test the differences of insulin sensitivity, execute function and resting-state striatal connectivity between BD patients and healthy controls. Then we examined the possible relationships insulin sensitivity, execute function and resting-state striatal connectivity.
Methods: 77 patients with BD receiving mood stabilizers treatment and 242 healthy subjects were recruited in this
study. Wisconsin Card Sorting Test (WCST) was applied to test participants’ ability of shifting cognitive set.
Insulin sensitivity was estimated using the homeostasis model assessment of insulin resistance (HOMA-IR). Among the participants, 29 healthy adults and 22 BD patients
underwent 5-min resting-state fMRI scanning. Seed-to-whole brain connectivity of ventral striatum (VS) was estimated.
Multivariate regression analysis was performed to measure relations among factors.
Results: The results indicated the fasting insulin level and HOMA-IR value in the BD group were significantly higher than HC group (p<0.001). With regard to executive
functions, BD group performed significantly worse than HC group (p<0.01). Moreover, ANOVA test showed a significant interaction effect between BD diagnosis and HOMA-IR value on the number of WCST-perseveration errors (p=0.02). For the healthy group, both WCST and HOMA-IR measurements were found to be related to ventral striatal connectivity with middle frontal areas though in a differentiated manner.
Participants scored higher in WCST showed stronger frontostriatal connectivity while participants who had higher insulin resistance revealed weaker frontostriatal connections. However, this correlation was not identified in the BD group.
Conclusions: Insulin sensitivity significantly is
associated with more severe cognitive and frontal-striatal connectivity abnormalities in BD. Function of frontal- striatal circuit play a key role underling the cognitive deficit and metabolic co-morbidity in BD. Interventions focusing frontal-striatal circuit could give a chance to improve functional outcome of BD.
英 文 關 鍵 詞 : Amyloid beta pathology, bipolar disorder, dementia, dopamine transporter and insulin resistance
目錄
計畫中文摘要。(五百字以內) ... II 計畫英文摘要。(五百字以內) ... III
前言: ... 1
研究目的: ... 3
文獻探討: ... 4
結果與討論(含結論與建議): ... 13
科技部補助研究計畫涉及臨床試驗之性別分析報告 ... 21
附錄:2019 AsCNP 研討會論文 ... 22
計畫中文摘要。(五百字以內)
流行病學調查顯示 30-50%之情緒疾患個案同時罹患代謝異常,且兩者之間具有雙向性關聯。重要 的是研究顯示葡萄糖代謝異常會影響雙極性情感疾患之病程,其中合併代謝異常者之治療反應較差。
其可能的原因之一是胰島素抗性本身對大腦有直接之作用,因而影響其預後。由此推論,胰島素抗性 的作用可能造成雙極性情感疾患腦部之變化。然而,至今僅有少數研究探討雙極性情感疾患個案之腦 部變化與其合併葡萄糖代謝異常間之相關。為此,本計畫將系統性評估葡萄糖代謝正常、糖尿病前期、
糖尿病雙極性情感疾患個案之葡萄糖代謝狀態,神經認知功能,腦結構與功能。計劃中我們將由成大 醫院招募一百五十位年齡在十八到六十五歲之間,接受接受包含丙戊酸或鋰鹽等情緒穩定劑治療,符 合 DSM 5 診斷準則之雙極性情緒疾患受試者。其精神病理症狀將以漢氏憂鬱量表以及楊氏躁症量表評 估。 個案之長期治療反應將以 Alda 量表評估。本計劃之目標包含: (1) 評估周邊胰島素抗性之嚴重 度與雙極性情緒疾患個案神經認知功能表現之相關性。此外,將運用類澱粉蛋白正子掃描檢查罹患糖 尿病之雙極性情感疾患個案腦中是否產生類澱粉蛋白病變; (2) 運用 [99mTc]TRODAT 單光子電腦 斷層造影比較各組個案間大腦紋狀體之多巴胺轉運體數量; 以及(3)使用基於體素的腦形態測量與靜息/
活化態功能性核磁共振影像比較各組個案間之可能差異。除此之外,將探討上述各種腦功能/型態之變 異是否與個案之精神病理嚴重度、神經認知功能變化或長期病程相關。最後我們將嘗試運用胰島素抗 性指數以及上述腦影像功能指標作為雙極性情緒疾患之生物指標,建立雙極性情緒疾患之分期系統。
未來將可用於辨認特定個案族群,以利給予該個案所需藥物以及非藥物介入,避免雙極性情感疾患個 案神經功能退化之發生。
關鍵字:澱粉樣β-蛋白病變,雙極性情感性疾患,失智,多巴胺轉運體,胰島素抗性
計畫英文摘要。(五百字以內)
Background: Insulin sensitivity is associated with neurocognitive trajectory and connectivity pattern within reward networks. High prevalence of insulin resistance has been reported in bipolar disorder (BD) patients.
Importantly, impaired insulin sensitivity could modulate the course and treatment outcome in BD. Here we hypothesized that insulin sensitivity could be potentially associate with neurocognitive trajectory and aberrant frontal-striatal circuit connectivity in euthymic phase of BD.
Objectives: We aimed to test the differences of insulin sensitivity, execute function and resting-state striatal connectivity between BD patients and healthy controls. Then we examined the possible relationships insulin sensitivity, execute function and resting-state striatal connectivity.
Methods: 77 patients with BD receiving mood stabilizers treatment and 242 healthy subjects were recruited in this study. Wisconsin Card Sorting Test (WCST) was applied to test participants’ ability of shifting cognitive set. Insulin sensitivity was estimated using the homeostasis model assessment of insulin resistance (HOMA-IR). Among the participants, 29 healthy adults and 22 BD patients underwent 5-min resting-state fMRI scanning. Seed-to-whole brain connectivity of ventral striatum (VS) was estimated. Multivariate regression analysis was performed to measure relations among factors.
Results: The results indicated the fasting insulin level and HOMA-IR value in the BD group were significantly higher than HC group (p<0.001). With regard to executive functions, BD group performed significantly worse than HC group (p<0.01). Moreover, ANOVA test showed a significant interaction effect between BD diagnosis and HOMA-IR value on the number of WCST-perseveration errors (p=0.02). For the healthy group, both WCST and HOMA-IR measurements were found to be related to ventral striatal connectivity with middle frontal areas though in a differentiated manner. Participants scored higher in WCST showed stronger frontostriatal connectivity while participants who had higher insulin resistance revealed weaker frontostriatal connections. However, this correlation was not identified in the BD group.
Conclusions: Insulin sensitivity significantly is associated with more severe cognitive and frontal-striatal connectivity abnormalities in BD. Function of frontal-striatal circuit play a key role underling the cognitive deficit and metabolic co-morbidity in BD. Interventions focusing frontal-striatal circuit could give a chance to improve functional outcome of BD.
Key word: Amyloid beta pathology, bipolar disorder, dementia, dopamine transporter and insulin resistance
前言:
Neuroprogression in bipolar disorder
Major social stress could be defined as ‘allostatic load and overload’ involving the cumulative wear-and-tear on the body and brain from adverse experiences over the life course in the social and physical environment along with resulting health-damaging behaviors [21]. In the field of bipolar disorder (BD), allostatic load offers an important clue as to why patients who undergo recurrent mood episodes are clinically perceived as less resilient, as the kindling theory described [22]. In addition, allostatic load helps explaining the cumulative disruptive effects of intermittent episodes and stressors by the understanding of neuroprogression in BD patients [23]. As major social stress is required to trigger initial onsets and recurrences of mood episodes, but successive episodes become progressively less tied to stressors and may eventually occur autonomously
[24, 25].
Stress exposure would induce substantial plastic changes that modify the maturation of neuroendocrine, autonomic, immune and metabolic systems involved in the active process of adaptation and maintaining homeostasis [26-28]. Immune activation and failure of physiologic compensatory mechanisms over time have been implicated in the pathophysiology of nueroprogression in BD. Recent evidence suggests that such changes are important contributors to neuroprogression and may mediate the cross-sensitization of episode recurrence, trauma exposure and substance use [29]. Changes in physiologic systems implicated in allostasis have been proposed to impact brain structures as well as medical comorbidity in BD patients. Abnormalities in insulin physiology, for example, insulin resistance (IR), hyperinsulinemia and central insulinopenia, are implicated as effectors of allostatic load in BD [30].
Comorbid metabolic disorder and bipolar disorder
Epidemiologic evidences have indicated increased metabolic disturbances in BD patients [31]. Previous literature reported a 30-50% prevalence of metabolic syndrome in BD patients, which was higher than that in the general population [32]. Other studies indicated that 8% to 17% of BD patients have hyperglycemia and Type 2 diabetes, 17 to 36 % had high TG, 20 to 23% had low HDL-C, 36 to 49% had large waist circumferences, and 29 to 39% had hypertension [33]. These metabolic abnormalities, which include abnormalities in glucose and lipid levels, body mass index, and blood pressure, also indicate high risk for cardiovascular diseases and diabetes [46, 47]. Among them, high levels of adipokines and hepatokines are also involved in chronic inflammation and correlated with higher morbidity and mortality [47-51].
Insulin resistance increases the risk of dementia
Before, it was generally considered that the brain was insensitive to insulin, but it is now accepted that insulin has central modulatory functions. Recent work has highlighted the important role of insulin's action in the nervous system on glucose and energy homeostasis, memory, and mood [34]. A recent study showed the brain-specific deletion of the insulin receptor in mice leads to obesity, hyperphagia, and systemic IR. This clearly demonstrated the crucial function of brain insulin signaling in regulating metabolic homeostasis [35]. Cumulating evidence demonstrated that brain insulin signaling plays a pivotal role in regulating peripheral metabolism via the modulation of autonomic nervous system, independent of circulating insulin and glucose levels [36, 37].
IR in muscle and liver and β-cell failure represent the core pathophysiologic defects in type 2 diabetes. In addition to the muscle, liver, and β-cell, the fat cell, gastrointestinal tract, α-cell, kidney, and brain IR all plays important roles in the development of glucose intolerance in type 2 diabetic individuals. Moreover, brain IR is related to greater amyloid burden post-mortem and increased deposition within areas affected by early Alzheimer's disease (AD) [38, 39]. Brain IR is related to greater amyloid burden post-mortem and increased deposition within areas affected by early AD. Human study also demonstrated that brain IR might contribute to amyloid deposition in brain regions affected by AD [40]. It has been proposed that differences in the metabolic reliance on glycolysis, and the expression of glucose transporters and insulin signaling genes determine the vulnerability of different brain regions to Tau and/or Amyloid beta (Aβ) pathology, and that IR is a critical link between these two pathologies that define AD [41].
Bipolar disorder increases the risk of dementia
Importantly, patients with BD have two to three times increased risk of T2DM or metabolic syndrome and the clear independent roles of BD and IR in dementia risk have been demonstrated [42]. In recent years, cognitive impairment has been increasingly recognized as an integral part of the BD phenotype [43]. Several
studies have shown that patients with BD have significant cognitive impairment, especially with executive function; attention/working memory; speed/reaction time; verbal memory; visual memory [44]. The presence of cognitive impairment has been associated with greater disability, and cognitive impairment has been proposed as a marker of neurodegeneration in BD [45, 46]. Furthermore, results also suggested that subjects with BD tend to develop dementia in middle age [47]. A meta-analysis had confirmed the association between BD and future risk of dementia [48].
Impaired glucose metabolism moderates the course of bipolar disorder
However, the longitudinal course of BD is highly variable, and a subset of patients seems to present a progressive course associated with brain changes and functional impairment [49]. The individual differences come from the age of onset, early trauma, severity of illness overall, inter-episodic symptoms, comorbid conditions, cognitive dysfunction, social support, diet, sleep hygiene, smoking, and even the neurotic syndrome [50]. The cumulative allostatic load of individual factors could be identified through key inflammation, glucose and lipids factors that accompany neuroprogression [51]. IR, as the consequences of cumulative allostatic overload, could also be part of the shared neurobiological mechanisms linking BD and type 2 diabetes [52, 53]. Moreover, accumulating evidence suggested impaired glucose metabolism moderates the course of illness and treatment outcomes in BD [45][54-56]. Patients with BD and type 2 diabetes or IR had three times higher odds of a chronic course of BD compared with euglycaemic patients, three times higher odds of rapid cycling and were more likely to be refractory to lithium treatment [57].
One possible explanation of the effect is that IR may have a direct effect on the brain, influencing outcome. Therefore, impaired glucose metabolism may be a complicating factor affecting the course of illness and may be responsible for the quality of remission, at least in a subset of patients with BD. The effects of IR on the brain may also account for some of the brain changes seen in patients with BD. However, few studies investigated whether comorbid impaired glucose metabolism would correlate with the brain changes found in BD. To address these issues, we will systematically evaluate the correlations between status of glucose metabolism, neurocognition, and brain morphology and functional scans from euglycemic BD patients, BD patients with prediabetes/T2DM and euglycemic, nonpsychiatric controls. We hypothesize that impaired glucose metabolism in BD would be associated with accelerated age or illness burden-related brain changes.
Last, we will test analytic approaches using multimodal data hold the potential to establish a staging system by using these biomarkers that identifying signatures of subgroups of patients for providing specific pharmacological strategies and functional remediation to stop the neuroprogressive course in BD.
研究目的:
Work items expected to be finished:
We plan to recruit 150 participants from the Department of Psychiatry at the National Cheng Kung University Hospital in 3 years. Their metabolic indices, boy mass index, waist circumference, and blood pressure will also be measured. The patients’ psychopathology will be evaluated using the Hamilton Rating Scale for Depression (HDRS) and the Young Mania Rating Scale (YMRS). In addition, their neurocognitive function will be assessed. The BD patients will be divided into euglycemic patients, patients with prediabetes and patients with T2DM. Among them, 20 BD patients with T2DM and neurocognitive impairment will receive amyloid PET/CT scanning. 15 of each group (age/sex matched) will receive SPECT to measure their striatal DAT availability. All patients will receive MR scanning to do the voxel-based morphometry and functional MR acquisition. Last, we will test analytic approaches using multimodal data hold the potential to establish a staging system by using these biomarkers that identifying signatures of subgroups of patients for providing specific pharmacological strategies and functional remediation to stop the neuroprogressive course in BD.
Potential contribution to academics, national developments, or other applications 1. To better understand the shared pathophysiological features between BD and brain IR.
2. To establish a clinical staging system for BD using these biomarkers that informs prognosis, clinical course, and treatment, and assists individualized care places BD patients on a probabilistic continuum of increasing potential disease severity, ranging from clinically at-risk or latency stage through first threshold episode of illness or recurrence, and, finally, to late or end-stage disease [96, 97].
3. To development of effective strategies targeting insulin resistance in BD to prevent and treat neurocognitive impairment associated with BD [98]. These efforts may ultimately lead to an improvement of psychosocial functioning and reducing indirect cost in BD patients [29].
Potential training to be gained by personnel participating in this project
The personnel participating in this project will be trained to learn the skills including neurocognitive testing, structure and functional imaging, and psychopathology. They will also learn emotional neuroscience from molecules to social emotional behaviors, and realize how to design and carry out a research project to fish out potential therapeutic targets of mood disorders. Finally, participants would realize how to design and carry out a translational clinical research.
Expected research results and achievements
We expect 3 conference papers and 3 journal articles ranking within 20% of the field after complete the 3 years project. Moreover, the results could be the first step for future translational study.
文獻探討:
1. Chang, H.H., et al., The change of insulin levels after six weeks antidepressant use in drug-naive major depressive patients. J Affect Disord, 2013. 150(2): p. 295-9.
2. Chang, H.H., et al., High prevalence of metabolic disturbances in patients with bipolar disorder in Taiwan. J Affect Disord, 2009. 117(1-2): p. 124-9.
3. Chang, H.H., et al., The role of valproate in metabolic disturbances in bipolar disorder patients. J Affect Disord, 2010. 124(3): p. 319-23.
4. Chen, P.S., et al., Correlation between body mass index and striatal dopamine transporter availability in healthy volunteers--a SPECT study. Neuroimage, 2008. 40(1): p. 275-9.
5. Tseng, H.C., et al., Sex-specific associations between plasma oxytocin levels and schizotypal personality features in healthy individuals. J Psychiatr Res, 2014. 51: p. 37-41.
6. Chang, W.H., et al., Oxytocin receptor gene rs53576 polymorphism modulates oxytocin-dopamine interaction and neuroticism traits--a SPECT study. Psychoneuroendocrinology, 2014. 47: p. 212-20.
7. Lee, S.Y., et al., The COMT Val158Met Polymorphism Is Associated With Response to Add-on Dextromethorphan Treatment in Bipolar Disorder. J Clin Psychopharmacol, 2017. 37(1): p. 94-98.
8. Chen, P.S., et al., A longitudinal study of the association between the GNB3 C825T polymorphism and metabolic disturbance in bipolar II patients treated with valproate. Pharmacogenomics J, 2017. 17(2): p.
155-161.
9. Chang, H.H., et al., C-reactive protein: A differential biomarker for major depressive disorder and bipolar II disorder. World J Biol Psychiatry, 2017. 18(1): p. 63-70.
10. Chang, H.H., et al., Effect of memantine on C-reactive protein and lipid profiles in bipolar disorder. J Affect Disord, 2017. 221: p. 151-157.
11. Chang, H.H., et al., C825T polymorphism of the GNB3 gene on valproate-related metabolic abnormalities in bipolar disorder patients. J Clin Psychopharmacol, 2010. 30(5): p. 512-7.
12. Lin, H.C., et al., The amygdala excitatory/inhibitory balance in a valproate-induced rat autism model.
PLoS One, 2013. 8(1): p. e55248.
13. Wu, H.F., et al., D-Cycloserine Ameliorates Autism-Like Deficits by Removing GluA2-Containing AMPA Receptors in a Valproic Acid-Induced Rat Model. Mol Neurobiol, 2017.
14. Wu, H.F., et al., Alleviation of N-Methyl-D-Aspartate Receptor-Dependent Long-Term Depression via Regulation of the Glycogen Synthase Kinase-3beta Pathway in the Amygdala of a Valproic Acid-Induced Animal Model of Autism. Mol Neurobiol, 2017. 54(7): p. 5264-5276.
15. Chen, Y.W., et al., Activation of mGluR2/3 underlies the effects of N-acetylcystein on amygdala-associated autism-like phenotypes in a valproate-induced rat model of autism. Front Behav Neurosci, 2014. 8: p. 219.
16. Wang, C.C., et al., 5-HT1A-receptor agonist modified amygdala activity and amygdala-associated social behavior in a valproate-induced rat autism model. Int J Neuropsychopharmacol, 2013. 16(9): p. 2027-39.
17. Peng, G.S., et al., Valproate pretreatment protects dopaminergic neurons from LPS-induced neurotoxicity in rat primary midbrain cultures: role of microglia. Brain Res Mol Brain Res, 2005. 134(1): p. 162-9.
18. Chen, P.S., et al., Valproate protects dopaminergic neurons in midbrain neuron/glia cultures by stimulating the release of neurotrophic factors from astrocytes. Mol Psychiatry, 2006. 11(12): p. 1116-25.
19. Wu, X., et al., Histone deacetylase inhibitors up-regulate astrocyte GDNF and BDNF gene transcription and protect dopaminergic neurons. Int J Neuropsychopharmacol, 2008. 11(8): p. 1123-34.
20. Chen, P.S., et al., Valproic acid and other histone deacetylase inhibitors induce microglial apoptosis and attenuate lipopolysaccharide-induced dopaminergic neurotoxicity. Neuroscience, 2007. 149(1): p.
203-12.
21. McEwen, B.S., Protective and damaging effects of stress mediators. N Engl J Med, 1998. 338(3): p.
171-9.
22. Ghaemi, S.N., E.E. Boiman, and F.K. Goodwin, Kindling and second messengers: an approach to the neurobiology of recurrence in bipolar disorder. Biol Psychiatry, 1999. 45(2): p. 137-44.
23. Kapczinski, F., et al., Allostatic load in bipolar disorder: implications for pathophysiology and treatment.
Neurosci Biobehav Rev, 2008. 32(4): p. 675-92.
24. Weiss, R.B., et al., Kindling of life stress in bipolar disorder: comparison of sensitization and autonomy models. J Abnorm Psychol, 2015. 124(1): p. 4-16.
25. Bender, R.E. and L.B. Alloy, Life stress and kindling in bipolar disorder: review of the evidence and integration with emerging biopsychosocial theories. Clin Psychol Rev, 2011. 31(3): p. 383-98.
26. Meyer-Lindenberg, A. and H. Tost, Neural mechanisms of social risk for psychiatric disorders. Nat Neurosci, 2012. 15(5): p. 663-8.
27. Eisenberger, N.I. and S.W. Cole, Social neuroscience and health: neurophysiological mechanisms linking social ties with physical health. Nat Neurosci, 2012. 15(5): p. 669-74.
28. Sandi, C. and J. Haller, Stress and the social brain: behavioural effects and neurobiological mechanisms.
Nat Rev Neurosci, 2015. 16(5): p. 290-304.
29. da Costa, S.C., et al., Refractory bipolar disorder and neuroprogression. Prog Neuropsychopharmacol Biol Psychiatry, 2016. 70: p. 103-10.
30. Brietzke, E., et al., Insulin dysfunction and allostatic load in bipolar disorder. Expert Rev Neurother, 2011. 11(7): p. 1017-28.
31. Taylor, V. and G. MacQueen, Associations between bipolar disorder and metabolic syndrome: A review. J Clin Psychiatry, 2006. 67: p. 1034-41.
32. Ford, E.S., et al., Prevalence of the metabolic syndrome among US adults: findings from the third National Health and Nutrition Examination Survey. JAMA, 2002. 287: p. 356-59.
33. van Winkel, R., et al., Prevalence of diabetes and the metabolic syndrome in a sample of patients with bipolar disorder. Bipolar Disorders, 2008. 10(2): p. 342-8.
34. Lee, S.H., et al., Insulin in the nervous system and the mind: Functions in metabolism, memory, and mood. Mol Metab, 2016. 5(8): p. 589-601.
35. Bruning, J.C., et al., Role of brain insulin receptor in control of body weight and reproduction. Science, 2000. 289(5487): p. 2122-5.
36. Obici, S., et al., Hypothalamic insulin signaling is required for inhibition of glucose production. Nat Med, 2002. 8(12): p. 1376-82.
37. Scherer, T., et al., Brain insulin controls adipose tissue lipolysis and lipogenesis. Cell Metab, 2011. 13(2):
p. 183-94.
38. De Felice, F.G., M.V. Lourenco, and S.T. Ferreira, How does brain insulin resistance develop in Alzheimer's disease? Alzheimers Dement, 2014. 10(1 Suppl): p. S26-32.
39. Mullins, R.J., et al., Exosomal biomarkers of brain insulin resistance associated with regional atrophy in Alzheimer's disease. Hum Brain Mapp, 2017. 38(4): p. 1933-1940.
40. Willette, A.A., et al., Insulin resistance predicts brain amyloid deposition in late middle-aged adults.
Alzheimers Dement, 2015. 11(5): p. 504-510 e1.
41. Mullins, R.J., et al., Insulin Resistance as a Link between Amyloid-Beta and Tau Pathologies in Alzheimer's Disease. Front Aging Neurosci, 2017. 9: p. 118.
42. Vancampfort, D., et al., Prevalence and predictors of type 2 diabetes mellitus in people with bipolar disorder: a systematic review and meta-analysis. J Clin Psychiatry, 2015. 76(11): p. 1490-9.
43. Sole, B., et al., Cognitive Impairment in Bipolar Disorder: Treatment and Prevention Strategies. Int J Neuropsychopharmacol, 2017. 20(8): p. 670-680.
44. Cullen, B., et al., Prevalence and correlates of cognitive impairment in euthymic adults with bipolar disorder: A systematic review. J Affect Disord, 2016. 205: p. 165-181.
45. Samalin, L., et al., Residual depressive symptoms, sleep disturbance and perceived cognitive impairment as determinants of functioning in patients with bipolar disorder. J Affect Disord, 2017. 210: p. 280-286.
46. Goodwin, G.M., et al., Cognitive impairment in bipolar disorder: neurodevelopment or neurodegeneration? An ECNP expert meeting report. Eur Neuropsychopharmacol, 2008. 18(11): p.
787-93.
47. Wu, K.Y., et al., Increased risk of developing dementia in patients with bipolar disorder: a nested matched case-control study. Bipolar Disord, 2013. 15(7): p. 787-94.
48. Diniz, B.S., et al., History of Bipolar Disorder and the Risk of Dementia: A Systematic Review and Meta-Analysis. Am J Geriatr Psychiatry, 2017. 25(4): p. 357-362.
49. Kapczinski, N.S., et al., Neuroprogression and illness trajectories in bipolar disorder. Expert Rev Neurother, 2017. 17(3): p. 277-285.
50. Nierenberg, A.A., Bipolar disorder: multiple pathways to neuroprogression. Acta Psychiatr Scand, 2016.
134(2): p. 89-90.
51. Wiley, J.F., et al., Modeling Multisystem Physiological Dysregulation. Psychosom Med, 2016. 78(3): p.
290-301.
52. Calkin, C.V., et al., The relationship between bipolar disorder and type 2 diabetes: more than just co-morbid disorders. Ann Med, 2013. 45(2): p. 171-81.
53. Alam, I., et al., Obesity, metabolic syndrome and sleep apnoea: all pro-inflammatory states. Obes Rev, 2007. 8(2): p. 119-27.
54. Charles, E.F., C.G. Lambert, and B. Kerner, Bipolar disorder and diabetes mellitus: evidence for disease-modifying effects and treatment implications. Int J Bipolar Disord, 2016. 4(1): p. 13.
55. Mansur, R.B., et al., Brain-derived neurotrophic factor, impaired glucose metabolism, and bipolar disorder course. Bipolar Disord, 2016. 18(4): p. 373-8.
56. Mansur, R.B., et al., Impaired glucose metabolism moderates the course of illness in bipolar disorder. J Affect Disord, 2016. 195: p. 57-62.
57. Calkin, C.V., et al., Insulin resistance and outcome in bipolar disorder. Br J Psychiatry, 2015. 206(1): p.
52-7.
58. Endicott, J. and R.L. Spitzer, A diagnostic interview: the schedule for affective disorders and schizophrenia. Arch Gen Psychiatry, 1978. 35(7): p. 837-44.
59. Huang, S.Y., et al., Possible interaction of alcohol dehydrogenase and aldehyde dehydrogenase genes with the dopamine D2 receptor gene in anxiety-depressive alcohol dependence. Alcohol Clin Exp Res, 2004. 28(3): p. 374-84.
60. Grof, P., et al., Is response to prophylactic lithium a familial trait? J Clin Psychiatry, 2002. 63(10): p.
942-7.
61. Manchia, M., et al., Assessment of Response to Lithium Maintenance Treatment in Bipolar Disorder: A Consortium on Lithium Genetics (ConLiGen) Report. PLoS One, 2013. 8(6): p. e65636.
62. Cardoso, T., et al., Neuroprogression and Cognitive Functioning in Bipolar Disorder: A Systematic Review. Curr Psychiatry Rep, 2015. 17(9): p. 75.
63. Willette, A.A., et al., Association of Insulin Resistance With Cerebral Glucose Uptake in Late Middle-Aged Adults at Risk for Alzheimer Disease. JAMA Neurol, 2015. 72(9): p. 1013-20.
64. Kullmann, S., et al., Brain Insulin Resistance at the Crossroads of Metabolic and Cognitive Disorders in Humans. Physiol Rev, 2016. 96(4): p. 1169-209.
65. Ashok, A.H., et al., The dopamine hypothesis of bipolar affective disorder: the state of the art and implications for treatment. Mol Psychiatry, 2017. 22(5): p. 666-679.
66. Plum, L., M. Schubert, and J.C. Bruning, The role of insulin receptor signaling in the brain. Trends Endocrinol Metab, 2005. 16(2): p. 59-65.
67. Defronzo, R.A., Banting Lecture. From the triumvirate to the ominous octet: a new paradigm for the treatment of type 2 diabetes mellitus. Diabetes, 2009. 58(4): p. 773-95.
68. Kleinridders, A., et al., Insulin resistance in brain alters dopamine turnover and causes behavioral disorders. Proc Natl Acad Sci U S A, 2015. 112(11): p. 3463-8.
69. Chen, P.S., et al., Effects of C825T polymorphism of the GNB3 gene on availability of dopamine transporter in healthy volunteers--a SPECT study. Neuroimage, 2011. 56(3): p. 1526-30.
70. McEwen, B.S., et al., Mechanisms of stress in the brain. Nat Neurosci, 2015. 18(10): p. 1353-63.
71. Mazza, E., et al., Body mass index associates with white matter microstructure in bipolar depression.
Bipolar Disord, 2017. 19(2): p. 116-127.
72. Passos, I.C., et al., Areas of controversy in neuroprogression in bipolar disorder. Acta Psychiatr Scand, 2016. 134(2): p. 91-103.
73. Kozicky, J.M., et al., Neuroprogression and episode recurrence in bipolar I disorder: A study of gray matter volume changes in first-episode mania and association with clinical outcome. Bipolar Disord, 2016. 18(6): p. 511-519.
74. Hajek, T., et al., Insulin resistance, diabetes mellitus, and brain structure in bipolar disorders.
Neuropsychopharmacology, 2014. 39(12): p. 2910-8.
75. Liu, C.H., et al., Resting-state abnormal baseline brain activity in unipolar and bipolar depression.
Neurosci Lett, 2012. 516(2): p. 202-6.
76. Liu, C.H., et al., Abnormal baseline brain activity in bipolar depression: a resting state functional magnetic resonance imaging study. Psychiatry Res, 2012. 203(2-3): p. 175-9.
77. Vargas, C., C. Lopez-Jaramillo, and E. Vieta, A systematic literature review of resting state network--functional MRI in bipolar disorder. J Affect Disord, 2013. 150(3): p. 727-35.
78. Doucet, G.E., et al., The Role of Intrinsic Brain Functional Connectivity in Vulnerability and Resilience to Bipolar Disorder. Am J Psychiatry, 2017: p. appiajp201717010095.
79. Chase, H.W. and M.L. Phillips, Elucidating neural network functional connectivity abnormalities in bipolar disorder: toward a harmonized methodological approach. Biol Psychiatry Cogn Neurosci Neuroimaging, 2016. 1(3): p. 288-298.
80. Brady, R.O., Jr., et al., Differential brain network activity across mood states in bipolar disorder. J Affect Disord, 2017. 207: p. 367-376.
81. Chen, Y.C., et al., Aberrant brain functional connectivity related to insulin resistance in type 2 diabetes:
a resting-state fMRI study. Diabetes Care, 2014. 37(6): p. 1689-96.
82. Musen, G., et al., Resting-state brain functional connectivity is altered in type 2 diabetes. Diabetes, 2012.
61(9): p. 2375-9.
83. Zhou, H., et al., Impairments in cognition and resting-state connectivity of the hippocampus in elderly subjects with type 2 diabetes. Neurosci Lett, 2010. 473(1): p. 5-10.
84. Xia, W., et al., Disrupted resting-state attentional networks in T2DM patients. Sci Rep, 2015. 5: p.
11148.
85. Felger, J.C., et al., Inflammation is associated with decreased functional connectivity within corticostriatal reward circuitry in depression. Mol Psychiatry, 2016. 21(10): p. 1358-65.
86. Schneider, M.R., et al., Neuroprogression in bipolar disorder. Bipolar Disord, 2012. 14(4): p. 356-74.
87. van den Heuvel, M.P. and H.E. Hulshoff Pol, Exploring the brain network: a review on resting-state fMRI functional connectivity. European Neuropsychopharmacology, 2010. 20(8): p. 519-34.
88. Aertsen, A.M., et al., Dynamics of neuronal firing correlation: modulation of "effective connectivity".
Journal of Neurophysiology, 1989. 61(5): p. 900-17.
89. Friston, K.J., et al., Functional connectivity: the principal-component analysis of large (PET) data sets.
Journal of Cerebral Blood Flow and Metabolism, 1993. 13(1): p. 5-14.
90. Bechara, A., et al., Insensitivity to future consequences following damage to human prefrontal cortex.
Cognition, 1994. 50(1-3): p. 7-15.
91. Greicius, M., Resting-state functional connectivity in neuropsychiatric disorders. Current Opinion in Neurology, 2008. 21(4): p. 424-30.
92. Buckner, R.L., J.R. Andrews-Hanna, and D.L. Schacter, The brain's default network: anatomy, function, and relevance to disease. Annals of the New York Academy of Sciences, 2008. 1124: p. 1-38.
93. Buelow, M.T. and J.A. Suhr, Construct validity of the Iowa Gambling Task. Neuropsychology Review, 2009. 19(1): p. 102-14.
94. Li, X., et al., The Iowa Gambling Task in fMRI images. Human Brain Mapping, 2010. 31(3): p. 410-23.
95. Lin, C.H., et al., Brain maps of Iowa gambling task. BMC Neurosci, 2008. 9: p. 72.
96. Berk, M., et al., Stage managing bipolar disorder. Bipolar Disord, 2014. 16(5): p. 471-7.
97. Berk, M., et al., Staging in bipolar disorder: from theoretical framework to clinical utility. World Psychiatry, 2017. 16(3): p. 236-244.
98. Cha, D.S., et al., A randomized, double-blind, placebo-controlled, crossover trial evaluating the effect of intranasal insulin on cognition and mood in individuals with treatment-resistant major depressive disorder. J Affect Disord, 2017. 210: p. 57-65.
研究方法:
Subjects’ enrollment and measurement of psychopathology: We plan to recruit 150 participants from the Department of Psychiatry at the National Cheng Kung University Hospital. Eligible participants are aged between 18-65 years, diagnosed with BD according to the DSM 5 criteria, and receive mood stabilizers treatment, including VPA and lithium, will be enrolled consecutively. We will use the Chinese Version of the modified Schedule for Affective Disorders and Schizophrenia, Lifetime version (SADS-L) to formulate the main diagnoses based upon DSM-IV criteria [58, 59]. Their boy mass index, waist circumference, and blood pressure will also be measured. Metabolic syndrome will be defined according to the IDF 2005 criteria. The patients’ psychopathology will be evaluated using the Hamilton Rating Scale for Depression (HDRS) and the Young Mania Rating Scale (YMRS). Patients will be excluded if they had (1) the diagnosis of organic mood disorder, (2) a mood disorder not otherwise specified, or (3) more than one lifetime course of electroconvulsive therapy (ECT) or ECT within the last 6 months, (4) cerebrovascular disease, (5) neurodegenerative disorders, or (6) macrovascular disorders. All patients will provide written informed consent for participation in the trial, and the National Cheng Kung University Hospital Institutional Review Board would review and approve this study protocol before patients’ enrollment.
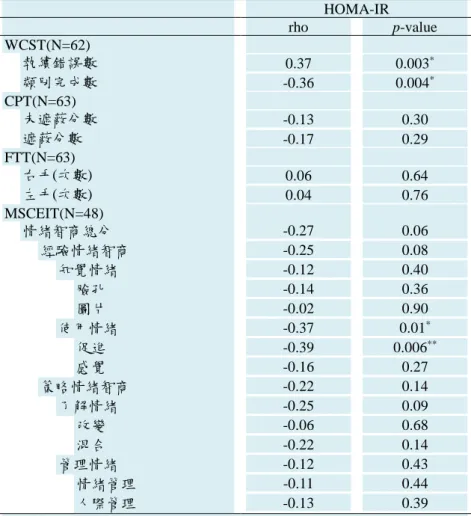
Diagnosis of IR and T2DM: All patients have fasting plasma glucose (FPG) and fasting serum insulin (FSI) tests performed and analyzed in a single laboratory with the same assay to eliminate variability. If FPG is elevated (>7 mmol/l), the test will be repeated on another day to confirm the diagnosis of T2DM. If the diagnosis of T2DM is equivocal (the repeated test is not >7 mmol/l, or the initial FPG is between 5.7 and 6.9 mmol/l), then a 2-h 75 g oral glucose tolerance test would be performed. Glucose intolerance (GI) is defined by a FPG <7.0 mmol/l and a glucose level >7.8 and <11.1 mmol/l measured 2 h after ingestion of 75 g of glucose. The diagnosis of T2DM would be made if the 2-h glucose level is >11.1 mmol/l, irrespective of FPG. These are standard diagnostic procedures for T2DM. In patients who do not meet the laboratory criteria for T2DM or GI, IR would be estimated using the homeostatic model assessment-IR (HOMA-IR) equation (HOMA-IR=FPG (mmol/l) x FSI (U/ml)/22.5). The participants with IR and GI will be combined into a single group (BD+IR/GI group) for the analyses.
Long-term treatment outcome measurement: The clinical long-term treatment response will be measured by the Alda scale (Retrospective Criteria of Long-Term Treatment Response in Research Subjects with Bipolar Disorder)” [60]. The Alda scale provides a Total Score (TS) for treatment response that is derived from the scores on two sub-scales, namely the A scale (which assesses change in illness activity following the introduction of lithium) minus the B scale score. Whilst the TS could be used as a continuous measure of lithium response, it could also be used to define response categories: Full Response (FR), Partial Response (PR) and Non-Response (NR). At present, the cut-off between FR and PR is more consistent than the lower cut-off used to identify the NR group [61].
Aim 1: To test the correlation between peripheral insulin sensitivity, neurocognitive function and brain amyloid beta pathology in BD.
There has been a growing appreciation of the importance of identifying and treating neurocognitive impairment associated with BD, since it persists in remission periods and significantly influences patients’
psychosocial outcomes. Therefore, an increasing body of research seeks to achieve a better understanding of potential moderators contributing to neurocognitive impairment in BD in order to develop prevention strategies and effective treatments [43]. The decline in neurocognitive abilities over the course of the BD seems to be associated with the allostatic load [62]. On the other hand, abnormalities in insulin physiology, for example, IR, hyperinsulinemia and central insulinopenia, are implicated as effectors of allostatic load in BD
[30]. And brain IR has been known to contribute to worse memory performance and beta amyloid deposition in brain regions affected by AD [41, 63]. Furthermore, brain IR links tightly to peripheral insulin sensitivity and metabolic disorders [64]. In aim 1, we will (1) estimate the possible correlations between the degrees of peripheral insulin sensitivity and neurocognitive function in BD patients; (2) compare the neurocognitive function between euglycemic BD patients, BD patients with prediabetes/T2DM and euglycemic, nonpsychiatric controls; and (3) test if the amyloid beta (Aβ) pathology exist in BD patients with T2DM/ neurocognitive impairment by using amyloid PET/CT scanning.
Method
Cognitive assessments:
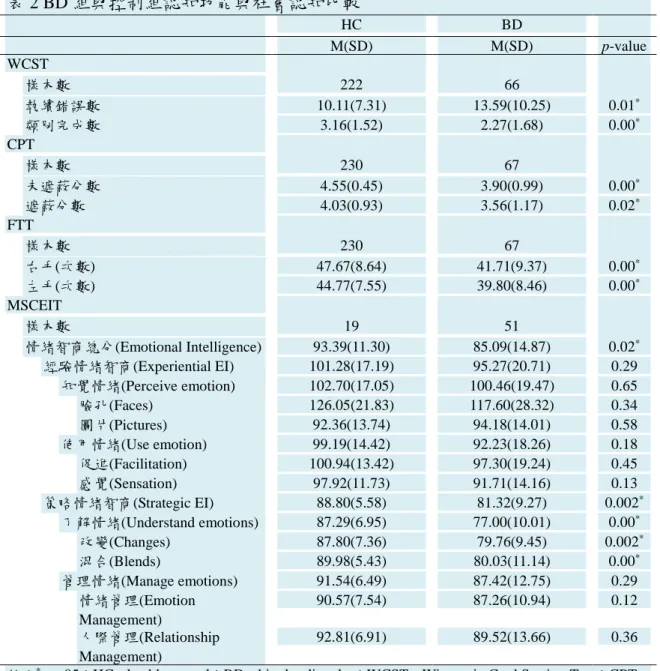
Continuous Performance Test (CPT): The CPT is a psychological test for humans that primarilymeasures attention. The critical stimulus may be defined either as a particular single stimulus out of the available set (X task: subjects were asked to respond to number “9”) or a particular sequence of two stimuli out of the available set (AX task: subjects were asked to respond whenever the number “9” was preceded by the number
“1”). Only the AX task was used in the present study. Each test session began with 2 min of practice (repeated if the subjects required it) to ensure that they knew how to press the button correctly. During the test, numbers from 0 to 9 were randomly presented for 50 ms each, at a rate of one per second. A total of 331 trials, 34 (10%) of which are target stimuli, are presented over 5 min in each session. Each subject undertook two sessions, including the non-masked task and the 25% masked task. During the masked session, a pattern of snow will be used to toggle background and foreground so that the image is visually distorted. The masked CPT is more sensitive for the detection of cognitive deficits. In this study, subject responses will be recorded automatically on a diskette using the CPT machine (Sunrise Systems, version 2.20, Pembroke, MA, USA). The rater monitors each subject’s performance through the computer monitor.
Finger-Tapping Test (FTT): The finger-tapping test (FTT) is a neuropsychological test that examines motor speed and lateralized coordination. FTT consists of tapping with the index finger on a computer mouse as many times as possible within 10 s. The test will be repeated three consecutive times and performed randomly across subjects, and the order will be kept constant in each subject at each session. The average number of taps would be then calculated.
Wisconsin Card-Sorting Test (WCST): The WCST will be conducted by an experienced clinical neuropsychologist. There are 64 cards in the test. All definitions of the indices are as described in the WCST manual. Using a computerized version of the WCST, the patients are required to match response cards to four stimulus cards along one of three dimensions (color, form, or number) on the basis of sign feedback (correct or wrong). The subjects will not be given any information about the dimensions. After sorting a series of 10 cards in one category, the subject would be asked to sort the cards again in a different category. The index of completed categories and preservative errors are used to assess performance in WCST.
Amyloid PET: All of the subjects will receive a single intravenous bolus of approximately 296 MBq (8 mCi) of 18F-florbetaben. The PET scanner used is a Discovery 710 PET/CT system (GE Healthcare, Waukesha, WI, USA) in three-dimensional acquisition mode. A continuous 20 minutes (min) brain PET data scan was acquired 90-min post injection and was reconstructed using 4 frames of 5-min each. Each subject also had an
magnetic resonance imaging scan session, including a T1-weighted scan, which was employed for spatial normalization during voxel-based analysis. For the quantitative analysis of the 18F-florbetaben PET images, a region-of-interest (ROI) analysis will be performed on the individual PET images, which are spatially normalized to the Montreal Neurological Institute (MNI) atlas space using Statistical Parametric Mapping 2.0 (SPM2; Wellcome Department of Imaging Neuroscience, Institute of Neurology, University College London).
The mean cortical ROI templates contained 10 regions (frontal, temporal, occipital, parietal regions, basal ganglia [BG], cingulum, hippocampus, insula, amygdale and central region), as defined by the Automated Anatomic Labeling. Mean cortical and whole cerebellar ROI templates would be applied to all PET scans to calculate the mean regional cerebral-to-cerebellar standard uptake values (SUVRs). The average of these regions will be evaluated as a measure of the global mean cortical 18F-florbetaben binding. Aβ-positive (Aβ+) and Aβ-negative (Aβ−) 18F-florbetaben PET statuses will be defined according to the threshold of ≥1.10, a criterion derived from the Alzheimer’s Disease Neuro-imaging Initiative (ADNI) database.
Limitation and alternative approach: The cost for amyloid PET/CT scanning is high. Therefore, we will select only BD patients with T2DM/ neurocognitive impairment to receive the examination.
Aim 2: To test the correlation between peripheral insulin sensitivity and striatal dopamine transporter availability in BD.
Dopamine has been a key theory of the pathophysiology of both manic and depressive phases of BD.
Converging findings from pharmacological and imaging studies found elevations in dopamine D2/3 receptor availability and a hyperactive reward-processing network, underlies mania. In BD depression imaging studies show increased dopamine transporter levels. Thus, it can be speculated that a failure of dopamine receptor and transporter homoeostasis might underlie the pathophysiology of this disorder [65]. Interestingly, a recent animal study demonstrated that brain IR induces dopaminergic dysfunction leading to anxiety and behavioral disorders. Moreover, the role for insulin signaling in brain dopaminergic system activity might be the shared neurobiological mechanisms in the pathogenesis of IR that is found in metabolic disorders, cognitive dysfunction, and mood disorders [66-68]. Using TRODAT-1/SPECT scanning, in aim 2, we will compare striatal dopamine transporter (DAT) availability between euglycemic BD patients, BD patients with prediabetes/T2DM and euglycemic, nonpsychiatric controls. Moreover, we will test if the striatal DAT availability is associated with neurocognition and clinical outcome in BD.
Method
Striatal DAT availability: The imaging procedure is identical to our previous study [69]. For brain imaging, each subject will be intravenously administered 740 MBq (20 mCi) [99mTc] TRODAT-1 (a radio-labeled form of tropan derivative for the selective labeling of DAT) in a quiet environment about ten minutes after insertion of an intravenous line. The SPECT data will be obtained using an energy window of 15% centered on 140 keV for [99mTc]. Imaging of [99mTc] TRODAT-1 is initiated approximately 240 minutes after injection, and SPECT images are acquired over a circular 360° rotation in 120 steps, 50 seconds per step, in a 128×128×16 matrix. The images are then reconstructed using Butterworth and Ramp filters (cut-off frequency
= 0.3 Nyquist; power factor = 7) with attenuations by Chang’s method, and the reconstructed transverse images are realigned parallel to the canthomeatal line. The slice thickness of each transverse image is 2.89 mm. In addition, all subjects undergo magnetic resonance imaging (Signa CV-I, 1.5 Tesla, GE Medical Systems, Milwaukee, WI, USA). Using the commercial software PMOD (PMOD Technologies, Zurich, Switzerland), each subject’s SPECT image is co-registered with the corresponding T2-weighted MRI image automatically then finely adjusted manually by an experienced nuclear medicine physician. The MRI image will be used as a reference, so the slice thickness of the co-registered images is the thickness of the T2-weighted MRI images (3.3 mm). For co-registration, rigid transformations are defined by 6 parameters:
the rotation angles and translation distances in the three spatial directions. The interpolation method is trilinear.
On the co-registered images, the two contiguous transverse slices that contained the most intense striatal radioactivity will be further examined in order to ascertain whether the SPECT and MRI images are co-registered accurately and whether the striatum is best seen on the two slices of the MRI images. If that is not the case, further adjustment of co-registration was performed manually until a satisfactory outcome was achieved. Regions of interest (ROIs), including the striatum and occipital cortex, are then drawn on the two contiguous MRI transverse slices, and these ROIs are projected onto the co-registered SPECT images. The ratio of the radioactivity [the (St-Oc)/Oc ratio] will be then derived by dividing the difference between the average activity in the striatum (St) and the average activity in the occipital cortex (Oc) by the average activity in the occipital cortex (Oc).
Aim 3: To test the correlation between peripheral insulin sensitivity and brain morphology/functional connectivity changes in BD.
The brain is the central organ of perceiving and adapting to stressors via structural remodeling and dysfunctional processing of information. Persistence changes of neural architecture when stress ends might indicate failed resilience [70]. Interestingly, BD is associated with gray matter volume (GMV) and white matter tract alterations in neural regions important for emotional regulation [71]. And the reductions of GMV are only been seen in BD patients with multiple episodes, suggesting that changes occur with neuroprogression [72, 73]. Moreover, T2DM or even prediabetes may be risk factors for smaller hippocampal and cortical volumes in BD. And abnormal glucose metabolism may accelerate the age-related decline in hippocampal volumes in BD
[74]. The pathological rewiring of the brain could take place in parallel with the cognitive and functional deterioration in the course of BD.
In addition, previous studies had also demonstrated widespread local functional abnormalities in multiple brain regions in BD, including the medial prefrontal cortex, anterior cingulate cortex, thalamus, pallidostriatum, amygdala, and hippocampus by using functional magnetic resonance imaging [75-77]. Changes in functional connectivity were identified between specific regions, such as default-mode network (DMN), thalami-striatum connectivity, anterior cingulate-amygdalae connectivity, and prefrontal-limbic connectivity
[78-80]. Moreover, several studies have showed reduced functional connectivity between the nodes of the DMN, such as the posterior cingulated cortex and the hippocampus, in T2DM patients [81-83]. Moreover, the aberrant brain functional connectivity might be related to the degree of IR or inflammation [84, 85].
While magnetic resonance imaging has provided significant insight into the structural, functional, and connectivity abnormalities associated with BD, research assessing stage dependent changes has been more limited [86]. Using voxel-based morphometry, resting-state functional MR imaging data and voxel-based graph theory analysis, in aim 3 we plan to compare structure change and the whole-brain intrinsic functional connectivity patterns between groups. Moreover, we will test if these changes are associated with neurocognition and clinical outcome in BD. These findings have important implications for the treatment of BD as stage dependent intervention might minimize neuroprogression in BD.
Method
Voxel-based brain morphometry: MRI data will be collected using the following parameters: 1.488 ms echo time, 6.3 ms repetition time, 10° flip angle, 256 × 256 acquisition matrix, 230 mm × 230 mm FOV, 2 mm slice thickness, 1mm between slices, 144 slices, and TR/TE = 6.3 ms/1.488 ms. The data is preprocessed using the voxel-based morphometry 8 (VBM8) toolbox. DARTEL (Diffeomorphic Anatomical Registration Through Exponentiated Lie Algebra) VBM image-processing techniques will be adopted for evaluating differences in volumetric changes of various brain areas. We will process the MRI data using Statistical Parametric Mapping 8 (SPM8, Wellcome Institute of Neurology, University College London, UK) running under MATLAB R2010a (MathWorks Inc., Natick, MA USA). Briefly, the anatomical MRI images are co-registered, normalized, and spatially smoothed using an 8-mm full-width-at-half-maximum (FWHM) Gaussian kernel in SPM8. Gray matter will be used for the following analyses. The statistical results are then presented using SPM8 and xjView 8.0 (Human Neuroimaging Lab, Baylor College of Medicine, Houston, TX, USA).
Functional MR imaging: The striatum dopamine and amygdala activity will be measured by fMRI that constitute with a resting-state fMRI [87] for the functional connectivity [88, 89], and an Iowa gambling task (IGT) for assessing the brain function during decision making [90]. A structural MRI will be collected as well for co-registration.
Resting-state fMRI: Resting-state fMRI has been applied to assessing the association between default mode network with behavior, emotion, and social response as well as some psychiatric disorders [91, 92]. During the resting-state fMRI procedure, the subject will be instructed to close eyes and rest, while avoids any movement as possible. The echoplanar imaging sequence (EPI) will be conducted for data acquisition for 5 minutes (TR/TE = 2000/25 ms, 32 axial slices, voxel dimensions = 3.1×3.1×5 mm to cover the whole brain). A voxel-wise and ROI-wise method will both be conducted for data analysis.
Iowa gambling task (IGT) with fMRI: We will apply a computer version of IGT. This task has sound construct validity [93]. Recently, a fMRI study identified that prefrontal-striatal networks involved in the IGT
in task-progression [94]. The paradigm will be similar to previous study with identical gain-loss structure and instruction [95]. In each trail, the subject will be asked to turn a card from 4-decks voluntarily, and maximize gains and minimize losses during the game. A time interval of 6 seconds preceding the button press was defined as anticipation period and the interval after was defined as experience period. Subjects will conduct a short practice trails with different gain-loss structure. The fMRI inter-trial interval will be longer than 10 seconds to enhance the sensitive. To avoid the MRI-signal inhomogeneity and the inter-session confounding, there will be 9 interruptions in which the subjects will be ask to unrelated questions.
fMRI data acquisition: Image will be acquired using a 3.0 T GE MR750 MRI scanner system. Functional data will be acquired with a T2*-weighted gradient-echo EPI using BOLD contrast (TR = 2000ms, TE = 50 ms, flip angle = 90 degree, slice thickness = 4 mm, inter-slice interval = 0 mm, field of view = 230 × 230 mm2, 64 × 64 × 32 matrix, whole brain coverage). The first five images of each session were discarded from the analysis. The anatomical image was acquired using a high-resolution T1-weighted 3D gradient-echo pulse sequence (TR = 88.1ms, TE = 4.12 ms, TI = 650 ms, flip angle = 90 degree, slice thickness = 1.5mm, field of view = 230 × 230 mm2, 256× 256 × 128 matrix).
Data process and analysis: Image and statistical analysis will be processed with SPM8 (Welcome Department of Cognitive Neurology, London, UK). Scans will be realigned, time corrected, co-registered, normalized, and spatially smoothed with a 4 mm full-width-at-half-maximum Gaussian Kernal with the SPM.
Generalized Linear Model will be used to model the event time course of each subject. Regional differences were statistically threshold at p < .05, FDR corrected for multiple comparison, voxel extent (k) > 10, in within-subject analysis. A random-effect model will be applied for second-level random effects group analysis.
結果與討論(含結論與建議):
表 1 BD 組與控制組人口學與臨床變項比較
HC BD
M(SD) M(SD) p-value
人口學變項
人數 242 77
性別(男性/女性) a 110/131 27/50 0.10
年齡(年) 32.83(11.41) 38.66(12.32) 0.00*
教育程度(年) 14.62(3.11) 14.16(2.85) 0.25
婚姻狀況(人數)a -
單身 - 41%(28)
離婚 - 16%(11)
已婚 - 43%(30)
職業狀況(人數) a 0.00*
無業 3%(7) 20%(14)
家庭主婦 2%(5) 15%(10)
兼職 6%(15) 10%(7)
全職 60%(142) 36%(25)
義工 1%(1) 1%(1)
退休 1%(2) 6%(4)
學生 27%(64) 12%(8)
經濟收入(人數) a 0.02*
10,000 元以下 4%(9) 15%(10)
10,000-30,000 13%(29) 20%(13)
30,001-50,000 22%(51) 18%(12)
50,001-70,000 27%(63) 15%(10)
70,000-100,000 21%(47) 20%(13)
100,001-200,000 12%(28) 11%(7)
200,000 以上 1%(3) 1%(1)
交友相處頻率(人數) a 0.01*
每天 26%(60) 15%(10)
每週 2-3 次 25%(57) 17%(12)
每週 1 次 20%(45) 20%(14)
每月 1 次 15%(34) 19%(13)
少於每月一次 11%(25) 14%(10)
無 3%(8) 15%(10)
知心好友有無(人數) a 0.001*
無 11%(26) 29%(19)
有 83%(190) 71%(47)
不適用 6%(14) 0%(0)
是否滿意朋友支持(人數) a 0.00*
否 5%(12) 23%(14)
是 89%(204) 77%(48)
不適用 6%(14) 0%(0)
抽菸狀況(人數)a -
未曾 - 71%(49)
以前有目前無 - 10%(7)
目前有 - 19%(13)
目前抽菸狀況(人數)a 0.39
無 14%(26) 81%(56)
有 86%(154) 19%(13)
喝酒狀況(人數) -
未曾 - 71%(49)
以前有目前無 - 13%(9)
目前有 - 16%(11)
運動狀況(人數)a -
幾乎無 - 33%(23)
每月<1 次 - 3%(2)
每月 1-3 次 - 20%(14)
每週 1-2 次 - 12%(8)
每週 3-5 次 - 14%(10)
天天運動 - 17%(12)
劇烈運動(人數)a -
<1 次(週) - 57%(34)
1-2 次(週) - 28%(17)
3-5 次(週) - 10%(6)
>5 次(週) - 5%(3)
臨床變項
診斷(BD-I/BD-II) a - 35/39 -
疾病初發年齡(年) - 32.38(11.44) -
病程(年) - 6.85(7.68) -
用藥狀況(人數) a -
無或僅用選擇性血清素回收抑制劑 - 4%(3)
情緒穩定劑(鋰鹽或丙戊酸) - 26%(19)
非典型抗精神病藥物 - 14%(10)
情緒穩定劑和非典型抗精神病藥物 - 56%(40)
丙戊酸 (ug/ml) - 59.14(29.12) -
楊氏躁症量表 0.13(0.48) 1.97(3.52) 0.00*
漢氏憂鬱量表 3.09(1.77) 3.93(5.42) 0.04*
住院次數(5 年內) - 0.63(1.22) -
住院次數(10 年內) - 1.07(2.06) -
病史(人數) a
糖尿病 - 9%(7/77) -
高血壓 - 9%(7/77) -
高血脂症 - 4%(3/77) -
腦中風 - 0%(0/77) -
心臟病 - 4%(3/77) -
甲狀腺疾病 - 4%(3/77) -
腎臟病 - 4%(3/77) -
肝臟病 - 10%(8/77) -
收縮壓(mmHG) 116.40(17.75) 120.40(15.79) 0.07
舒張壓(mmHG) 74.77(12.03) 77.05(11.32) 0.11
體重(kg) 64.34(14.88) 70.90(16.09) 0.001*
身高(cm) 164.57(8.50) 163.03(7.66) 0.09
身體質量指數(kg/cm2) 23.61(4.37) 26.50(5.00) 0.00*
腰圍(cm) b 82.22(14.33) 86.97(13.64) 0.06
臀圍(cm) b 100.36(9.00) 99.74(9.36) 0.71
空腹血糖(mg/dl) 88.96(8.95) 97.57(32.44) 0.12
糖化血色素(%) 5.48(0.54) 5.65(1.24) 0.35
胰島素(mU/ml) 8.65(6.86) 16.72(9.58) 0.00*
C-胜肽(ng/ml) 1.71(0.98) 2.33(1.28) 0.00*
HOMA-IR 1.88(1.76) 4.02(2.63) 0.00*
HOMA-β 118.71(88.28) 228.11(146.78) 0.00*
胰島素阻抗(人數) a 19.7% (44/223) 66.7% (42/63) 0.00*
膽固醇(mg/dl) 185.78(35.24) 181.26(34.97) 0.44
高密度脂蛋白(mg/dl) 55.76(14.16) 56.57(20.36) 0.58
低密度脂蛋白(mg/dl) b 113.95(30.93) 114.77(31.83) 0.85
瘦素(ng/ml) 13.12(12.06) 23.63(19.05) 0.00*
三酸甘油脂(mg/dl) 96.19(67.08) 122.75(75.14) 0.001*
高敏感性 C-反應蛋白(pg/ml) 252660.96(312403.91) 364304.62(445253.62) 0.13
皮質醇(ug/dl) 12.94(5.62) 11.67(5.90) 0.10
催產素(pg/ml) 233.48(53.98) 159.60(99.74) 0.00*
腦源性神經營養因子(pg/ml) - 30222.79(6169.39) -
FGF21(pg/ml) - 304.36(233.76) -
註:a卡方分析;b獨立樣本 t 檢定;-無資料;*p<.05;HC,health control;BD,bipolar disorder;HOMA-IR,
Homeostasis model assessment-insulin resistance;HOMA-β,homeostasis model assessment of β-cell function ; FGF21,Fibroblast growth factor 21