Number 3/07, June 2007
China Economic Issues
Impact of the Renminbi Exchange Rate on Asian Currencies
Chang Shu, Nathan Chow and Jun-yu Chan
This study investigates a widely-held belief that movement of the renminbi is having an increasing impact on movement of Asian currencies in recent years.
Our empirical analysis suggests that since the exchange rate reform in July 2005, the renminbi has indeed begun to affect Asian currencies in that its movements independent of those of the US dollar tend to be followed by Asian currencies by varying degrees. However, the renminbi’s influence is constrained by its own limited fluctuations against the US dollar.
It is not clear whether the renminbi’s influence on the Asian currencies is the result of government policy of the Asian economies or market forces.
Nevertheless, the empirical findings indicate that the renminbi exchange rate
has assumed an international dimension. Since the reform in July 2005, the
RMB/USD exchange rate has seen increasing variations, and greater flexibility
seems to be a policy goal, as signalled by the recent announcement of
widening the trading band for the RMB/USD exchange rate. This, coupled
with the increasing importance of the Mainland economy in the region,
suggests that the renminbi’s role in the region is likely to grow over time.
I. Introduction
With the growing importance of the Mainland economy, it is widely believed that its currency is having increasing impact on Asian currencies. Foreign exchange traders and analysts frequently attribute movement of Asian currencies to those of the renminbi. 1 A (Mainland) China dominance hypothesis has surfaced in academic research papers, suggesting that the sheer size of the Mainland economy will ensure that that the renminbi will gradually play a central role in the region, and may become an anchor currency in Asia (Colavecchio and Funke, 2007, and Greenaway et al, 2006). The knock-on effects that the renminbi can have on regional currencies have also been noted by policymakers worldwide. Yam (2007), for example, remarks that a large (stepwise) appreciation of the renminbi against the US dollar would trigger substantial movements in the exchange rates of developing economies, particularly those in Asia.
While the influence of the renminbi on Asian currencies has been frequently referred to, there have been few formal studies to examine the issue. One study carried out by Colavecchio and Funke (2007) examines the spill-over effects from the renminbi to Asian currencies in the onshore and offshore forward markets. However, there does not appear to be any work undertaken on the spot market.
This study modifies a method introduced by Frankel and Wei (1994) to examine the spot exchange rate data with a view to addressing empirically the following two questions: Has there clearly been an impact from the renminbi on Asian currencies in recent years? Has the renminbi displaced the US dollar as the dominant driver of Asian currencies?
1 See, for example, Jen (2006).
This paper is organised as follows. Section 2 discusses possible reasons for the renminbi to drive Asian currencies. Section 3 follows the Frankel and Wei (1994) framework to examine empirically how Asian currencies are affected by the renminbi along with a number of major currencies including the US dollar, Japanese yen and euro. Section 4 discusses policy implications of the empirical findings on developments of exchange rate regimes in the region and financial stability globally.
II. Reasons for the renminbi’s regional impact
The majority of Asian economies, Mainland China included, have had a long standing exchange rate policy of closely following the US dollar, de jure or de facto. In an earlier study by Frankel and Wei (1994), the US dollar is shown to dominate all other currencies in its influence on Asian currencies between the period 1979-1992.
The dollar standard broke down for a short period during the Asian crisis in 1997-8, but was quickly re-established by 2002 as the day-to-day volatility of Asian countries’
exchange rates against the dollar became negligible (McKinnon and Schnabl, 2004).
These findings are corroborated by Benassy-Quere and Coeure (2003) who identify a number of Asian currencies, including the Korean won, Philippines peso, Singapore dollar, and Thai baht, as being pegged to the US dollar, which is at variance with the International Monetary Fund’s official classification of these countries’ exchange rate regimes.
There is, however, a sense among many quarters that developments in the renminbi exchange rate have been influencing regional currencies in recent years. The influence was even detected before the major exchange rate regime reform that took place in July 2005. Ho et al. (2005) noted that due to rising speculation on renminbi appreciation, the renminbi non-deliverable
forward rates affected the spot rates of Asian currencies in 2003-4.
The impact of the renminbi spot rate on Asian currencies started to appear visible after July 2005, when Mainland China shifted away from a strict peg to the US dollar. With a reference to a basket and a daily trading band of ±0.3%, or ±0.5% more recently, around the central parity against the US dollar, the renminbi has been on an appreciating trend against the US dollar, and its volatility has generally been rising since the reform. During the same period, the majority of the Asian currencies also
appreciated against the US dollar with the exception of the Hong Kong dollar and New Taiwan dollar (Chart 1). Among the other currencies, the Indonesian ruphiah only saw a very modest gain of less than 1%. Four currencies – the Korean won, Malaysian ringgit, Philippines peso and Singapore dollar – appreciated by 10-13%. The Thai baht recorded the largest gain of over 20%.
While some of these currencies were following an appreciating trend even before July 2005, Chart 1 shows that the changes in the renminbi exchange rate regime seem to have precipitated their further appreciation.
Chart 1. Co-movements between renminbi and Asian currencies
7.6 7.8 8.0 8.2 8.4
7.68 7.72 7.76 7.80 7.84
99 00 01 02 03 04 05 06 CNYUSD HKDUSD
7.6 7.8 8.0 8.2 8.4
900 1000 1100 1200 1300 1400
99 00 01 02 03 04 05 06 CNYUSD KRWUSD
7.6 7.8 8.0 8.2 8.4
6000 8000 10000 12000 14000
99 00 01 02 03 04 05 06 CNYUSD IDRUSD
7.6 7.8 8.0 8.2 8.4
42 44 46 48 50
99 00 01 02 03 04 05 06 CNYUSD INRUSD
7.6 7.8 8.0 8.2 8.4
3.4 3.5 3.6 3.7 3.8 3.9
99 00 01 02 03 04 05 06 CNYUSD MYRUSD
7.6 7.8 8.0 8.2 8.4
35 40 45 50 55 60
99 00 01 02 03 04 05 06 CNYUSD P HP USD
7.6 7.8 8.0 8.2 8.4
1.5 1.6 1.7 1.8 1.9
99 00 01 02 03 04 05 06 CNYUSD SGDUSD
7.6 7.8 8.0 8.2 8.4
30 31 32 33 34 35 36
99 00 01 02 03 04 05 06 CNYUSD T WDUSD
7.6 7.8 8.0 8.2 8.4
28 32 36 40 44 48
99 00 01 02 03 04 05 06 CNYUSD T HBUSD
This influence is reflected by a general rise in bivariate correlation between the renminbi and individual Asian currencies after July 2005 (Table 1). The Malaysian ringgit, which followed the renminbi to de- link with the US dollar, has the highest correlation with the renminbi with a correlation coefficient of over 0.9. As noted above, the Hong Kong dollar and New Taiwan dollar defied the appreciation trend in the region, and have been negatively correlated with the renminbi in the period since the renminbi exchange rate reform.
The correlation with the renminbi may be the result of government policies and/or market forces. Asian economies have often pursued an export-driven strategy for economic growth. It has been suggested that Asian currencies may be moving away from a dollar bloc to tracking a broad-basket effective exchange rate in order to maintain competitiveness of their exports (Kawai, 2002 and Ho, et al., 2005). If this is the case, the renminbi may have started to feature in the currency baskets that Asian economies track because of the competitive relationship between Mainland China and these economies in export markets.
Branson and Healy (2005) show that the
structure of the Mainland’s exports, both in terms of market and commodity distributions, is similar to that of a number of Asian economies. Asian economies therefore have the incentive to keep a close watch on renminbi movements in managing their currencies in order not to lose competitiveness against Mainland exports.
Apart from government policies, market forces may also give rise to the renminbi’s influence. The importance of the Mainland economy may lead the market to believe that the Asian currencies should follow the renminbi movements. In addition, some Asian currencies such as the Singapore dollar have been used as proxies for renminbi trading in the global foreign exchange markets (Yam, 2007). In view of the Mainland’s large trade surpluses, there have been wide expectations of renminbi appreciation in recent years. However, as the renminbi is unconvertible and the access to renminbi trading is restricted, it is difficult for international investors to position themselves to directly benefit from renminbi appreciation. Under the circumstances, there are reports of practice in the currency market to use Asian currencies as proxies to take a position for Table 1. Correlation between the renminbi and Asian currencies
Hong Kong dollar -0.339 -0.875
Indian rupee -0.392 0.118
Indonesian rupiah -0.436 0.625
Korean won -0.040 0.764
Malaysian ringgit -0.186 0.927
Philippine peso -0.730 0.890
Singapore dollar -0.083 0.893
New Taiwan dollar -0.453 -0.160
Thai baht -0.391 0.955
After reform Before reform
(5/1/1999 - 20/7/2005) (21/7/2005 - 2/4/2007)
renminbi appreciation, on expectations that these currencies will follow suit if the renminbi appreciates.
III. Empirical analysis
Following some cursory observations of co- movements between the renminbi and Asian currencies, this section examines more formally whether the renminbi has an influence on Asian currencies by estimating a modified version of the method introduced by Frankel and Wei (1994).
Methodology and data
The Frankel and Weil (1994) framework takes the general form of:
(1) i
k
i i
j e
e = + ∆
∆
∑
=1
0 α
α .
In equation (1), ej and ‘ei’s are, respectively, exchange rates of the currency under study and those which might influence it. They are measured against a common currency,
typically the Swiss franc. A significant αi would suggest that currency i has an impact on ej, and αiis interpreted as the importance or weight of currency i in the currency basket. The sum of the ‘αi ’s should be close to one if all the relevant currencies are included in the basket the currency j is targeting. The approach has been widely used in estimating weights in a currency basket and for classifying de facto exchange rate regimes, including a number of applications on Asian currencies. For example, Eichengreen (2006) and Frankel (2007) apply it in an attempt to unveil the composition of the currency basket in the new renminbi exchange rate regime.
McKinnon and Schnabl’s (2004) application is to demonstrate the evolving role of the US dollar in influencing Asian currencies after the 1997-8 financial crisis.
For this study, we focus on the impact of the renminbi and G3 currencies on Asian currencies, and thus estimate the equation in the following form:
(2)
SwissFranc Rmb
SwissFranc Eur
SwissFranc Yen
SwissFranc Usd
SwissFranc ncy
Asiancurre
e e
e e
e
/ 4 /
3
/ 2 /
1 0 /
+ ∆ + ∆
∆ +
∆ +
=
∆
α α
α α
α
The exchange rates are taken logs and transformed into first differences. For the estimation, daily data for nine Asian currencies between 1 January 1999 and 2 April 2007, obtained from Bloomberg and CEIC, are used. The sample is split into two periods: before and after the renminbi exchange rate reform in July 2005, to investigate whether the role of the renminbi has changed over time.
As the first pass of the estimation, the renminbi exchange rate against the Swiss franc is directly used. The results are not reasonable. In a number of cases, including the Hong Kong dollar which is known to be
pegging to the US dollar, the coefficient on the US dollar, α1 , is not statistically significant, and/or carries a wrong sign.
The results may be explained by the high correlation between the renminbi and US dollar, even after the de jure de-linking of the two. Peng et al. (2006) show that significance was still attached to the stability of the RMB/USD exchange rate for their sample period of between end-July 2005 and 2006 Q2. Eichengreen (2006) and Frankel (2007) also reveal that although declining, the weight of the US dollar remained very high in 2006 in the currency basket the renminbi has been tracking.
To circumvent the multi-collinearity problem, we run an auxiliary regression of the changes in the renminbi on those of the US dollar. The residual from this regression is taken to be renminbi movements independent of the US dollar. We therefore use this residual to represent the renminbi exchange rate in estimating equation (2). 2 In this modified framework, α4 can still indicate how much the renminbi exchange rate influences movements of an Asian currency, but it can no longer be interpreted as the weight in a currency basket. As will be seen later in our estimation results, the
‘αi’s do not sum up to one as in the original framework of Frankel and Wei (1994).
Following the majority of the studies using the approach, the equation is estimated by the OLS. However, there could be a simultaneity problem as conceivably the renminbi exchange rate is also influenced by Asian currencies, and hence endogenous to the system, leading to biased estimates. To check this, we undertake the Hausman specification test. The results show that for the periods both before and after the exchange rate regime reform, the renminbi
can be treated as an exogenous variable in the equation, and thus the OLS can be used for the estimation. 3 These findings may be explained intuitively. While the renminbi exchange rate is said to be set according to a basket of currencies, the US dollar is found to have a dominant weight (Eichengreen, 2006 and Frankel, 2007). Other currencies, including the euro, Japanese and other Asian currencies, do not appear to have a strong impact on renminbi movements.
Estimation results
Tables 2-3 report the estimation results for two sample periods – before and after the exchange rate reform. The overall results point to a clear rise in the importance of the renminbi in influencing other currencies after the regime shift. The US dollar continues to have a dominant effect on Asian currencies, and the Japanese yen is also a component in currency baskets many Asian currencies track. We now discuss the details of the estimation results for the two periods.
2 We have also estimated auxiliary regressions which include all G3 currencies as regressors. However, the coefficients on the euro and yen are not significant.
3 Details of the Hausman specification test can be found in the Appendix.
Table 2. Asian currencies regimes before the renminbi exchange rate reform (1/1/1999 -- 20/7/2005)
Adjusted R2
Hong Kong dollar 0.000 0.994 *** 0.005 *** 0.004 ** 0.002 0.998
(0.340) (536.921) (3.227) (2.156) (0.015)
Indian rupee 0.001 0.987 *** 0.022 *** 0.032 * 0.459 0.951
(0.354) (130.578) (3.330) (1.858) (0.371)
Indonesian rupiah 0.011 0.879 *** 0.188 *** 0.083 -13.295 0.314
(0.444) (16.920) (3.579) (0.674) (-1.438)
Korean won -0.008 0.851 *** 0.177 *** 0.014 -1.397 0.706
(-0.785) (39.795) (9.022) (0.330) (-0.373)
Malaysian ringgit 0.000 1.001 *** 0.000 -0.001 -0.075 1.000
(0.017) (2151.299) (-0.641) (-1.558) (-0.950)
Philippine peso 0.021 * 0.920 *** 0.080 *** 0.032 -3.512 0.672
(1.820) (50.471) (2.892) (0.773) (-0.986)
Singapore dollar 0.001 0.723 *** 0.201 *** 0.048 1.373 0.877
(0.252) (60.609) (19.024) (1.623) (0.806)
New Taiwan dollar 0.000 0.934 *** 0.040 *** -0.007 -0.226 0.890
(-0.047) (82.627) (3.255) (-0.291) (-0.111)
Thai baht 0.009 0.786 *** 0.178 *** 0.045 0.960 0.774
(1.048) (45.052) (11.569) (1.209) (0.319)
Constant α0
Note: t-values are in ( ). *, ** and *** indicate that coefficients are significant at the 10%, 5% and 1% levels respectively.
Sources: Bloomberg and staff estimates.
Dollar α1 Yen α2 Euro α3 Rmb α4
Before the exchange rate regime reform:
The estimation over the period shows that among the nine currencies, the Hong Kong dollar and Malaysian ringgit were strict dollar peggers. The weight of the coefficient on the US dollar is almost one in the equation for the two currencies, and so is the adjusted R2. Apart from these two officially pegged to the US dollar, other Asian currencies were also heavily influenced by the US dollar. In the equation for the Indian rupee and Indonesian rupiah, the US dollar also has a coefficient close to one. The coefficient for the US dollar, α1, is around 0.9 for the Korean Won, Philippine peso and New Taiwan dollar.
The US dollar’s influence on the Singapore dollar and Thai baht was slightly smaller, with a weight of around 0.7-0.8.
The Japanese yen’s influence was noticeably smaller, but present in a number of cases. It did not impact on the Malaysian ringgit. In the equation for the Hong Kong dollar, α2 is somehow statistically significant, but its magnitude is too small to exert any material impact. α2 is significant in the other seven equations, and around 0.2 for the Indonesian rupiah, Singapore dollar and Thai baht – higher than for other Asian currencies. The euro virtually had no impact on Asian currencies.
The renminbi did not show any impact during this period with its coefficient, α4, being statistically insignificant in all the equations.
Table 3. Asian currencies regimes after the renminbi exchange rate reform (21/7/2005 -- 2/4/2007)
Adjusted R2
Hong Kong dollar 0.001 0.990 *** 0.009 *** -0.002 0.051 *** 0.998 (0.917) (420.209) (3.520) (-0.333) (4.934)
Indian rupee -0.001 0.870 *** 0.086 * 0.038 0.388 *** 0.763
(-0.086) (25.732) (1.942) (0.4093) (3.695)
Indonesian rupiah -0.016 0.846 *** 0.032 0.015 0.334 ** 0.394
(-0.578) (11.211) (0.474) (0.094) (2.081)
Korean won -0.025 0.832 *** 0.134 *** -0.019 1.062 *** 0.660
(-1.528) (20.756) (2.898) (-0.190) (12.994)
Malaysian ringgit -0.022 ** 0.948 *** 0.028 0.016 0.210 0.866
(-2.254) (36.721) (1.180) (0.254) (1.138)
Philippine peso -0.031 ** 0.924 *** -0.005 0.023 0.198 0.747
(-2.253) (25.527) (-0.111) (0.247) (1.331)
Singapore dollar -0.021 *** 0.644 *** 0.186 *** 0.272 *** 0.585 *** 0.864
(-2.616) (32.472) (7.696) (5.154) (4.660)
New Taiwan dollar 0.006 0.888 *** 0.113 *** -0.043 0.672 *** 0.797 (0.516) (26.080) (3.070) (-0.557) (5.959)
Thai baht -0.060 *** 0.724 *** 0.216 *** 0.115 0.683 *** 0.489
(-2.717) (18.465) (3.724) (0.847) (4.510)
Note: t-values are in ( ). *, ** and *** indicate that coefficients are significant at the 10%, 5% and 1% levels respectively.
Sources: Bloomberg and staff estimates.
Constant α0 Dollar α1 Yen α2 Euro α3 Rmb α4
Goodness of fit is generally reasonable for most of the equations. Apart from the two US dollar peggers with adjusted R2 close to 1, the adjusted R2 for other equations is mostly between 0.71-0.95. However, the equation for Indonesian rupiah has relatively low explanatory power with its adjusted R2 being 0.31
After the renminbi exchange rate reform:
The Hong Kong dollar is the only currency whose regime has remained unchanged from before the reform period. The coefficient on the US dollar, α1, is close to 1, and the adjusted R2 is virtually 1. This suggests that the Hong Kong dollar has maintained a strict peg to the US dollar. α2
on the Japanese yen is statistically significant, but small, while the euro has had no impact on the Hong Kong dollar.
Renminbi movements that were uncorrelated with those of the US dollar appear to influence the Hong Kong dollar.
Rather than reflecting government policy, this may be capturing market forces at play.
Upon strong upward pressures on the renminbi in recent years, some investors speculated that Hong Kong might abandon the link with the US dollar, and eventually link to the renminbi. Also, the Hong Kong dollar has been used as a proxy for the unconvertible renminbi for placing bets on renminbi appreciation. These factors drove the Hong Kong dollar to be traded on the
strong side of its target zone for considerable periods of time, e.g. in late 2005 and the first half of 2006.
For most of the other currencies, the US dollar has continued to dominate in its impact, but its coefficient, α1, has generally declined compared with the period before July 2005. Notably, α1 drops from close to 1 to 0.95 in Malaysia’s case. Shortly after Mainland China announced the changes in the exchange rate regime, Malaysia also officially abandoned the dollar peg, which is captured by the decline in the US dollar weight in the estimated equation for the Malaysian ringgit.
The impact of the Japanese yen is broadly similar to that prior to the renminbi exchange rate regime reform with two exceptions. Its coefficient is no longer significant in the equation for the Indonesian rupiah and Philippine peso. The euro has continued to play no part in influencing movements of all Asian currencies except one – the Singapore dollar.
The distinctive change comes from the impact of the renminbi which appears to have started to play a role in regional currency movements. Apart from the Malaysia ringgit and Philippine peso, the coefficient for the renminbi, α4 has become statistically significant in other equations.
Among the currencies, the renminbi’s impact is the highest, almost one-for-one, for the Korean Won. That is, a 1% change in the renminbi exchange rate independent of US dollar movements will lead to a corresponding 1% change in the Korean won.
Robustness check
The results reported above are based on data series that have included all non-missing observations. However, it is known that including observations with unusually large movements may change the relationship
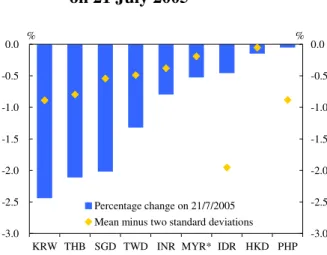
among variables. One noteworthy outlier, for example, is the announcement day of the renminbi exchange rate reform (21 July 2005) when most Asian currencies recorded unusually large movements (Chart 2).
Table 4 presents a different set of estimation results for the period after the renminbi exchange rate reform, using data series that have excluded outliers (defined as observations that are more than two standard deviations from the mean) including 21 July 2005. The estimates change somewhat compared to Table 3.
While the influence of G3 currencies is virtually unchanged, there are some differences in the renminbi’s impact. α4 becomes insignificant in the equations of the Hong Kong dollar and Thai baht, but turns significant for the Malaysian ringgit and Philippine peso. For the remaining five currencies, the estimates of α4 are largely robust and in the ballpark of those in Table 3, showing significant impacts of the renminbi. The results broadly support our earlier finding that the role of the renminbi has risen distinctively since the regime reform.
Chart 2. Asian exchange rate movements on 21 July 2005
-3.0 -2.5 -2.0 -1.5 -1.0 -0.5 0.0
KRW THB SGD TWD INR MYR* IDR HKD PHP -3.0 -2.5 -2.0 -1.5 -1.0 -0.5 0.0
Percentage change on 21/7/2005 Mean minus two standard deviations
% %
* Change on 22 July 2005
Table 4. Asian currencies regimes after the renminbi exchange rate reform (22/7/2005 -- 2/4/2007)
Adjusted R2
Hong Kong dollar 0.001 0.990 *** 0.010 *** -0.008 0.025 0.998
(1.085) (393.510) (3.800) (-1.082) (1.330)
Indian rupee -0.004 0.865 *** 0.091 ** -0.005 0.588 *** 0.750
(-0.353) (24.001) (2.521) (-0.053) (2.814)
Indonesian rupiah -0.043 * 0.848 *** 0.089 0.008 0.671 ** 0.467
(-1.942) (15.087) (1.439) (0.058) (2.195)
Korean won -0.028 * 0.814 *** 0.151 *** -0.093 1.056 *** 0.607
(-1.668) (19.905) (3.223) (-0.940) (4.435)
Malaysian ringgit -0.023 ** 0.896 *** 0.058 ** 0.043 0.763 *** 0.854
(-2.563) (37.493) (2.452) (0.670) (5.171)
Philippine peso -0.040 *** 0.887 *** -0.007 -0.049 0.642 *** 0.717 (-3.051) (25.980) (-0.191) (-0.534) (3.052)
Singapore dollar -0.022 *** 0.643 *** 0.197 *** 0.197 *** 0.220 * 0.838
(-2.754) (32.247) (8.464) (3.656) (1.749)
New Taiwan dollar 0.005 0.858 *** 0.127 *** -0.035 0.971 *** 0.769 (0.408) (26.237) (3.393) (-0.455) (5.877)
Thai baht -0.058 *** 0.681 *** 0.220 *** 0.054 0.131 0.599
(-3.718) (19.415) (4.684) (0.573) (0.437)
Note: t-values are in ( ). *, ** and *** indicate that coefficients are significant at the 10%, 5% and 1% levels respectively.
Sources: Bloomberg and staff estimates.
Constant α0 Dollar α1 Yen α2 Euro α3 Rmb α4
Major findings
Overall, there are a number of main findings from our empirical analysis:
• With the exception of the Hong Kong dollar which maintains a strict peg to the US dollar, major Asian currencies have been moving towards a regime targeting some measure of an effective exchange rate in recent years. This finding corroborates with observations by Ho et al. (2005).
• In the currency basket that Asian currencies are tracking, the US dollar
has continued to dominate in its impact, having a weight in the region of 0.8-0.9 in over half of the currencies, but its importance has declined somewhat after the renminbi exchange rate reform. In the case of the Singapore dollar, the US dollar has a lower weight of around 0.65 (Chart 3a).
• Movements of the Japanese yen have non-negligible impact on regional currencies, particularly for the Singapore dollar and Thai baht (Chart 3b). The euro only features in Singapore’s currency basket.
Chart 3a. Weights of the US dollar Chart 3b. Weights of the Japanese yen*
0.0 0.2 0.4 0.6 0.8 1.0
Hong Kong dollar Malaysian ringgit Philippine peso New Taiwan dollar Indian rupee Indonesian rupiah Korean won Thai baht Singapore dollar
After reform Before reform
-0.04 0.00 0.04 0.08 0.12 0.16 0.20 0.24 Thai baht
Singapore dollar Korean won New Taiwan dollar Indian rupee Hong Kong dollar Indonesian rupiah Malaysian ringgit Philippine peso
After reform Before reform
*A grey bar suggests that the coefficient is not statistically significant.
• One distinctive development in recent years is the rising importance of the renminbi on regional currencies. Since the exchange rate reform on 21 July 2005, the renminbi has had statistically significant impact on the movements of Asian currencies (Chart 4). Changes in the renminbi that are independent of those of the US dollar tend to lead to movements in other Asian currencies in the same direction. Nevertheless, it needs to be pointed out that the renminbi’s independent movements are relatively modest so far given the heavy weight attached to the stability of the RMB/USD exchange rate. In particular, as renminbi movements independent of the US dollar have been fairly limited, the renminbi did not have as much impact as the Japanese yen on regional currencies during the period under study despite bigger estimated coefficients on the renminbi variable than on the yen in some cases.
Chart 4. Coefficients on the renminbi*
0.0 0.2 0.4 0.6 0.8 1.0 1.2
Korean won Thai baht New Taiwan dollar Singapore dollar Indian rupee Indonesian rupiah Hong Kong dollar Malaysian ringgit Philippine peso
Estimates with outliers included Estimates excluding outliers
* A grey bar suggests that the coefficient is not statistically significant.
IV. Policy implications
The finding that the renminbi exchange rate has indeed had increasing impacts on Asian currencies should be interpreted with caution for two reasons. As already noted, the renminbi’s impact is in fact constrained by the heavy weight attached to the US dollar in the currency basket that the renminbi itself is tracking. Also, it is difficult to assess whether the impact is the result of government policy of Asian economies or market forces, or both.
These important considerations aside, the empirical finding indicates that the renminbi exchange rate has assumed an international dimension, alongside the key currencies in the global market place such as the US dollar and Japanese yen. It has been widely argued, as well as accepted by the Mainland authorities, that greater exchange rate flexibility is beneficial to the Mainland, especially in the medium to longer term.
The renminbi exchange rate has indeed been gaining flexibility after the regime shift, particularly since the second half of 2006, with increased variations against the US
dollar in both directions observed. The authorities also announced in May to widen the daily trading band for the RMB/USD exchange rate from ±0.3% to ±0.5%, signalling that greater flexibility is a policy goal. This, coupled with the increasing importance of the Mainland economy in the region, suggests that the renminbi’s role in the region is likely to grow over time.
References
Benassy-Quere, A. and B. Coeure (2003), “On the Identification of De Facto Currency Pegs,”
mimeo.
Branson, W. H. and C. N. Healy (2005), “Monetary and Exchange Rate Policy Coordination in ASEAN+1,” NBER Working Paper No. 11713.
Colavecchio, R. and M. Funke (2007), “Volatility Dependence Across Asia-Pacific On-shore and Off-shore U.S. Dollar Futures Markets,” Hamburg University Mimeo.
Eichengreen, B. (2006), “China’s Exchange Rate Regime: The Long and Short of It,”
University of California Berkeley mimeo.
Frankel, J. A. (2007), “Assessing China’s Exchange Rate Regime,” mimeo.
Frankel, J. A. and S. Wei (1994), “Yen Block or Dollar Bloc? Exchange Rate Policies of the East Asian Economies,” in Ito, T. and A. Krueger (eds.), Macroeconomic Linkage: Savings, Exchange Rates, and Capital Flows, Chicago: University of Chicago Press, 295-333.
Goldstein, M. (2007), “Assessing Progress on China’s Exchange Rate Policies,” Testimony Before the Hearing on “Risks and Reform: The Role of Currency in the US-China Relationship”, Committee on Finance, US Senate, 28 March 2007.
Greenaway, D., A. Mahabir and C. Milner (2006), “Has China Displaced Other Asian Countries’ Exports?” Leverhulme Centre for Research on Globalisation and Economic Policy, Nottingham University, Research Paper No. 2006/21.
Ho, C., G. Ma and R. N. McCauley (2005), “Trading Asian Currencies,” BIS Quarterly Review, March 2005, 49-58.
Jen S. (2006), “My Thoughts on Currencies,” Currency Economics, Morgan Stanley Equity Research, 16 Jan 2006.
Kawai, M. (2002), “Exchange Rate Arrangements in East Asia: Lessons from the 1997-98 Currency Crisis,” Monetary and Economic Studies, Bank of Japan, Institute for Monetary and Economic Studies, 20(S-1).
McKinnon, R. and G. Schnabl (2004), “The East Asian Dollar Standard, Fear of Floating, and Original Sin,” Review of Development Economics, 8(3), 331-360.
Peng, W. and C. Shu (2006), “The Renminbi Exchange Rate and Its Role in Macroeconomic Control,” China Economic Issues, 02/06, Hong Kong Monetary Authority.
Yam, J. (2007), “Political Pressure on the Renminbi Exchange Rate,” Viewpoint, 27/4/2006, Hong Kong Monetary Authority.
About the Author
Chang Shu is Senior Manager, and Nathan Chow and Jun-yu Chan Analysts, in the External Department. The authors would like to give special thanks to Wensheng Peng for his helpful suggestions. The authors are responsible for the views expressed in this article and any errors.
About the Series
China Economic Issues provides concise analysis of current economic and financial issues in China.
The series is edited by the External Department.
Appendix 1: Hausman Specification Test
When some regressors in an equation are endogenous and thus likely to be correlated with the error term, the OLS estimator will not be consistent. A version of the Hausman specification test can be used to find out whether there is a simultaneity issue. Assume that we are interested in estimating the following equation:
(A1) yt =α1xt +β1zt +et,
where zt and et are a set of totally exogenous variables and residuals respectively, and xt is a suspect endogenous regressor. To detect the presence of simultaneity is essentially to test whether xt is correlated with the error term, which can be carried out in two steps. In the first step, regress xt on the set of exogenous variables zt and relevant instrumental variables
ivt:
(A2) xt =α2zt +β2ivt +ut.
Then in the second step, include the calculated residual from the first step uˆt in the original equation for yt, and estimate:
(A3) yt =α3xt +β3zt +γ3uˆt +wt.
If the coefficient on uˆt is statistically significant, xt is correlated with the error term et in equation (A1), and thus the simultaneity issue is present, while an insignificant γ3 will indicate absence of simultaneity problems.
Following this procedure, we test whether the renminbi exchange rate variable is an endogenous variable in equation (2). Lagged renminbi exchange rates are used as instruments in the procedure. The test results are reported in Table A1. They show that the residuals are not significant for all the currencies for both sample periods of before and after the renminbi exchange rate reform. This suggests that the renminbi exchange rate can be treated as an exogenous variable in the regression for all the currencies, and the OLS estimator can be used.
Table A1. Hausman specification tests
Hong Kong dollar 0.856 [0.392] -0.643 [0.521]
Indian rupee -0.534 [0.594] -0.410 [0.682]
Indonesian rupiah 0.708 [0.479] -1.177 [0.240]
Korean won 0.432 [0.666] 0.032 [0.974]
Malaysian ringgit 0.993 [0.321] 1.007 [0.314]
Philippine peso 0.010 [0.992] 0.735 [0.463]
Singapore dollar -0.415 [0.678] 0.667 [0.505]
New Taiwan dollar 0.307 [0.759] -0.632 [0.528]
Thai baht -1.465 [0.143] 0.119 [0.906]
* Note: t-statistics are reported with associated p-values in [ ].
After reform Before reform