Number 2/09, July 2009
China Economic Issues
Exchange rate pass-through and currency invoicing in China’s exports
Li Cui, Chang Shu, and Jian Chang
This paper undertakes the first empirical study to estimate China’s pricing-to-market (PTM) elasticities based on both aggregate and panel data. China’s data are found to conform to the established regularity worldwide that exchange rate pass-through (ERPT) to export prices in foreign currencies is incomplete, and PTM behaviour in pricing is prevalent. Estimates from aggregate data suggest that half of the exchange rate changes will be reflected through adjustments in domestic currency prices, while the other half will be in foreign currency prices.
A large portion of the adjustment in domestic currency prices is due to strategic pricing, while a small part is due to cost considerations. Examinations over different sectors show that the aggregate PTM is mainly driven by that of the manufacturing sectors, and resource-based and non-resource-based manufacturing sectors show different PTM behaviour. As PTM and currency invoicing are determined by a similar set of factors including those driving price elasticity of foreign demand, the degree of PTM is intimately related to the decision of trade invoicing. International comparisons show our estimates of China’s PTM coefficient could correspond to about 20-30 percent of exports to be potentially invoiced in the renminbi when the use of the currency for such purpose is fully liberalised.
China Economic Issues – Number 2/09, July 2009 I. Introduction
The transmission of exchange rate changes to export prices, referred to as exchange rate pass- through (ERPT), has been studied for a wide range of countries and industries. The issue has significant policy implications. In particular, if the price changes in destination market currencies are less than those in the exchange rate, for instance because firms engage in strategic pricing-to-market, the use of exchange-rate policies to affect export growth would be less effective. As Mainland China’s (henceforth China) trade balance and exchange rate policy has received lots of attention in recent years, a study of ERPT would provide crucial input to the discussion regarding the impact of exchange-rate movements on exporters’ profitability and price competitiveness.
Another important reason for studying the degree of China’s ERPT at this juncture is that it would shed light on the potential market choices of invoicing currencies, when the actual choices by exporters are constrained by policies. The pricing decision of exporters in response to exchange rate changes and the exporters’ choices of invoicing currencies depend on the same set of factors (which are related to the market share, product competitiveness and differentiation of exports) in theory, and demonstrate close association empirically in cross- country data. The indication provided through a study on ERPT on the potential demand of using the renminbi in China’s exports would be particularly timely in China’s case in light of the latest liberalisation measures (see below).
This paper estimates the pass-through of exchange-rate changes to export prices for China in recent years, both at the aggregate level and disaggregated industry level. While the aggregate impact is important for informing discussions on macroeconomic policies, a more detailed examination using disaggregated data often provides much richer insights, as inherently the responsiveness of export prices to exchange rate changes is a microeconomic issue by nature, and varies by industries and markets. In our empirical strategy, we distinguish the impact of exchange rates on export prices through different channels, which have different influences on exporters’ profitability. In the case of appreciation, for example, exporters may choose to reduce the domestic currency denominated prices for two distinct reasons. They may need to exercise what is known as pricing to market (PTM) in the literature by keeping the prices in destination markets stable in order to maintain their market shares, and thus absorb the currency movements in their profit margins. At the same time, an appreciation would tend to lower the domestic currency prices of imported materials, reducing production cost and putting downward pressures on export prices. This second channel would also lower the export prices in domestic currency, although it does not lead to a reduction in exporters’ profit margins.
Given that China’s production relies heavily on imports of primary goods and intermediate inputs, the indirect impact of exchange rate changes on export prices through the influence on domestic costs is explicitly accounted for in our empirical strategy.
To preview the major findings of the study, our estimation suggests that there is incomplete pass-through of exchange rate changes to export prices. At the aggregate level, about half of the exchange rate changes are reflected in domestic price adjustments. The major part of the domestic price adjustment reflects exporters’ PTM behaviour, i.e. they adjust the mark-up in order to stabilise the prices in destination markets. A relatively small percentage of domestic price adjustment is due to the indirect impact of exchange rate movements on production costs.
The results imply that largely reflecting exporters’ PTM behaviour, the price adjustment of exports in real terms has been well short of the nominal exchange-rate changes, which will be one force limiting the effectiveness of the exchange-rate policy in influencing export growth.
The aggregate results mask important cross-sector differences. Among the main exporting industries, the domestic price adjustments of the resource-intensive export industries are mostly driven by indirect effect through domestic costs, and the exporters are able to take a relatively modest cut (in the case of renminbi appreciation) in their mark-up or profit margin.
However, for the machinery and equipment industries, the indirect impact of exchange rate adjustments through domestic costs is very small, and most adjustments are absorbed in the exporters’ profit margins. Comparing across sectors, the machinery and equipment sectors exhibit greater PTM than the resource-intensive sectors, as suggested by the greater average cut in the profit margin of the former in response to exchange rate changes. In addition, for large export sectors (i.e. those with relatively significant market share in the respective sectors globally), the mark-up adjustment is smaller than that of the overall manufacturing sector, suggesting greater pricing power.
The results also provide some indications on the potential for using the renminbi in China’s exports. Since the onset of the global financial crisis, the question of the dollar-dominant international currency system has again become a focus of debate among policymakers and academics. In this context the greater international role of the renminbi, against the backdrop of China’s growing economic presence globally, has been widely discussed. As an initial step, Mainland authorities commenced a trial scheme in July 2009, allowing eligible Mainland enterprises in several cities to settle their trade with trading partners in Hong Kong, Macao, and South East Asia in the renminbi. While in principle, trade invoicing in the renminbi has been allowed for China’s foreign trade since 2005, the actual use of this flexibility has been largely absent in practice as merchants typically choose the same currency for trade invoicing and trade settlement, and the latter were prohibited until recently. Thus the new measure has in effect facilitated the trade to be invoiced in the renminbi as well. The trial scheme is still in its early stage, and it remains to be seen to what extent the flexibility offered will be taken up by merchants in practice. At the same time, Chinese exporters’ pricing behaviour would provide important insights on the potential demand for using the currency for trade invoicing, which would help inform the possible scope of the business and guide further deliberation of the trial scheme.
China Economic Issues – Number 2/09, July 2009
More specifically, we use the estimated aggregate ERPT coefficient to consider the likely scope of currency choice of trade invoicing, based on some cross-country evidence.
International experience suggests that the degree of PTM is negatively related to the degree to which the exporters’ own currency is used in trade transactions. That is, the more a country’s exporters adjust their own prices in response to exchange rate changes, the less the home currency will be used for pricing and settling their exports, with both reflecting a lack of pricing power on the part of the exporters. The estimated PTM coefficient for China (corresponding to the domestic mark-up adjustment in response to a one-percentage-point change in the exchange rate) is close to 0.5. From the cross-country evidence, such a PTM coefficient is on average associated with 20 - 30 per cent of a country’s exports being priced in its own currency, or in the renminbi in China’s case. While the estimated coefficients may vary with model selection and are subject to statistical errors, the methodology provides a useful gauge for the potential market demand for renminbi pricing and settlement in Chinese exports.
The rest of the paper is organised as follows. Section 1 reviews the literature on ERPT to export prices, while Section 2 presents a theoretical model illustrating the PTM behaviour.
Sections 3 and 4 investigate China’s PTM in export prices empirically using aggregate and panel data respectively. The final sections summarise the results and discuss the policy implications of the empirical findings.
II. Literature review
ERPT, PTM and currency invoicing
The impact of exchange-rate movements on trade prices, referred to as ERPT in the literature, has been studied extensively. There are two extreme ERPT cases. At one extreme, changes in the exchange rate would be fully absorbed by adjustments in prices in the exporter’s currency, but will not affect prices in the importer’s currency. Thus, nominal appreciation of the exchange rate will have a limited impact on the export volume, as the real exchange rate does not change despite the movements in the nominal rate. This would be the case if the exporter is a price taker in the destination market such that in the face of home currency appreciation, he/she would cut back domestic currency prices in order to keep the foreign currency price stable. In such a case, exports are effectively priced in the buyer’s currency, known as the local currency pricing (LCP). At the other extreme, the exporter opts to keep the domestic currency price stable and fully pass on the exchange rate changes to prices in the destination market. When the home currency appreciates, the real exchange rate would move by the same extent as the nominal rate, having a much larger impact on real exports. Exports will be priced in the producer’s currency, referred to as the producer currency pricing (PCP).
Between the two extremes, the price adjustments due to exchange-rate changes can be partly borne by the producer and partly by the buyer. Price adjustments made by an exporter can be decomposed into two parts, the first owing to changes in production cost brought by exchange- rate movements, and the second reflecting the exporter’s strategic pricing behaviour (Athukorala and Menon, 1994). The latter is the behaviour known as pricing to market (PTM) following Krugman (1987). Among the factors affecting the extent of PTM, the degree of competition, the exporter’s market share in the destination country and product differentiation have been shown to be the most important. As noted by Knetter (1993), the existence of competitors in a market will impose discipline on an exporter’s pricing. The higher the firm’s market share in the destination market, the lower its incentive to absorb nominal shocks in home currency prices and the more it is likely that the exchange rate changes will be passed on to destination markets. It is often found that the PTM is particularly high for exports to the US, which is believed to be due to the smaller shares of exporters in the large size of the US market place, see, for example, Falk and Falk (2000) and Vigfusson, Sheets and Gagnon (2009).
Greater product differentiation gives the exporter a degree of monopoly and allows the use of the mark-up approach to price determination. The more differentiated products are associated with less home currency denominated price changes in the face of exchange rate changes.
Other factors relevant to PTM include the degree of cross-border production by multinational companies (Gron and Swenson, 1996), and the policy environment in the destination market (Taylor, 2000, Campa and Goldberg, 2006).
It has been argued that the choice of the invoicing currency in trade depends upon a similar set of factors that determine exchange rate pass-through, including most importantly demand and cost conditions (Knetter (1993), Friberg (1998)). In particular, Friberg (1998) establishes that sufficient conditions on demand and cost functions for incomplete ERPT are also sufficient conditions for price setting in importers’ currency. In a more general model, Engle (2006) illustrates the equivalence results for the optimal pass-through under flexible prices and the optimal choice of currency for export pricing. He shows that firms would set prices in their own currencies, i.e. PCP, if the prices would exhibit high exchange rate pass-through if they were set flexibly, and they would choose to set prices in the destination market currencies, i.e.
LCP, if the prices exhibit low exchange rate pass-through. The intuition is that if a producer has sufficient market power, it can decide to have its exports invoiced its own currency and keep its profit margin unchanged, which is the case of zero PTM, but full ERPT to export prices in the buyer’s currency. While the theoretical link is constructed considering the price setting decisions of individual exporters, it can be expected that a similar link exists at an aggregate level. The higher exchange rate pass-through to the destination markets, the more the exporters’ currency would be used as the invoicing and settlement currency.
China Economic Issues – Number 2/09, July 2009 Empirical studies
ERPT on export prices have been estimated mostly for developed economies. The research has been extensive for the US, notably Mann (1986), Knetter (1993) among the most cited1, and also for other OECD economies, e.g. Marazzi et al. (2005), Falk and Falk (2000) for Germany, and Mejean (2004) for six OECD economies. For Asia, most studies on PTM are on Japan, Athukorala and Menon (1994), Sasaki (2002), Takagi and Yoshida (2001), Parsons and Sato (2008) to name a few. Such studies are more limited for other economies in the region, with Lee (1995) for Korea, Parsley (2004) on Hong Kong, and Mallick, Marques (2008) on India, Ghosh and Rajan (2007) for Korea, Singapore and Thailand, and Vigfusson, Sheets and Gagnon (2009) covering Asian Newly Industrialised Economies being notable exceptions. To our knowledge, no research has been carried out on studying China’s PTM in export prices.
There are a number of key findings from the earlier empirical work. Incomplete ERPT to foreign currency prices, i.e. PTM, is widespread among different industries and countries, and differences at the industry level are more important than cross-country differences. Other factors such as the market share and the degree of product differentiation, are also important in affecting ERPT.
III. Theoretical underpinning
The PTM phenomenon can be illustrated by using a simple mark-up model, as shown in, for example, Gaulier (2006). Consider the representative exporting firm of a given industry located in a given country which sells its goods in N overseas markets (j =1…N). Its pricing decision for each destination market j is one among a system of N maximising problems in the following form:
(1) Max Πtj =Max (PXtj −MCtj)Dtj,
where:
z PX is the optimal export price denominated in the producer currency chosen by the tj representative firm, specifically for its sales in the destination market j
z MCtj is the marginal cost for production z Dtj is the demand by the destination market j.
First order conditions of Equation 1 lead to a corresponding set of N optimal prices (j =1…N) given as:
1 See Goldberg and Knetter (1997) for a review on ERPT studies on the US.
(2) PXti =μtjMCtj.
In Equation 2, μtj is the producer’s mark-up in the product in market j. It depends on the elasticity of foreign demand with respect to the price in the local (buyer’s) currency, given as:
(3) = j −1
t j j t
t η
μ η , where ηtj =ηj(PXtj /Stj,Ztj).
Therefore, the optimal price depends on the marginal cost of production and the elasticity of demand with respect to the export price in the buyer’s currency. In a general form, this elasticity is a function of export price in the buyer’s currency (PXtj/Stjwhere S is defined as tj units of the domestic (producer) currency per unit of the foreign (buyer’s) currency such that a rise in Stj denotes depreciation in the domestic currency). Total differentiation of Equation 2 leads to a theoretical relationship that links the export price in the domestic currency to the marginal cost, exchange rate and other factors affecting foreign demand:
(4) j tj
PS Z j t j j t j
j
t d MC d S d Z
PX
dln (1 ) ln ln β ln
ε β ε
β + − ηη
−
= ,
with:
η η
ε η
β ε
S PX j
S j PX
/ /
1+
= − ,
) / ln(
ln
/ j
t j t
j t S
PX ∂ PX S
= ∂ η
εη ,
) ln(
ln
j t
j j t
Z ∂ Z
= ∂ η
ε .
βj measures the sensitivity of the export price in the producer currency to exchange rate movements, i.e. the PTM coefficient specific to each destination market. The coefficient of pass-through to export prices in the foreign currency j is thus equal to the coefficient of pass- through to domestic prices βjminus one.
z If β j=1, exporters absorb all exchange rate changes into their mark-ups, with export prices in the producer currency moving by the same degree as the exchange rate changes.
Thus, exporters practice complete PTM.
z If βj = 0, exporters do not change their mark-ups and export prices in the producer currency, leaving all the price adjustments in foreign currencies. Therefore, there is complete pass-through to foreign prices, i.e. zero PTM.
China Economic Issues – Number 2/09, July 2009
z If 0<βj<1, export prices in the domestic and foreign prices share the adjustment, resulted from the exporters’ partial absorption of the exchange rate changes into their mark-ups (profit margins).
IV. Exchange rate pass-through to China’s export prices
A. Aggregate evidence
Based on the discussion above, we estimate China’s PTM elasticities using both aggregate and disaggregate data. For aggregate data, the empirical form of Equation 4 to estimate the PTM is given as:
(5)
∑ ∑
= Δ − + = Δ −
+
=
Δ T
j
T j
j t j
j t j
t NEER MC
PX
0 0
) ln(
) ln(
)
ln( μ β γ .
Monthly data from January 2005, when China’s trade price data became available, to March 2009 are used in the estimation. PXt in Equations (5) is the unit value index of exports measured in the renminbi.2 The exchange rate (NEERt) is trade-weighted effective exchange rate compiled by the Bank for International Settlements. In line with the terms used in the theoretical discussion, the exchange rate is defined as units of renminbi per foreign currency so that a rise in the index represents renminbi depreciation. Marginal cost (MCt) is approximated by the producer price index (PPI). As the official statistics on the unit value of exports and the PPI are reported on a year-on-year comparison basis, the other variables are transformed into the same form.
Estimation issues
The literature tends to follow one of the two dynamic structures for Equation 5 in order to obtain the long-run estimates for the PTM and ERPT coefficients. The first specification uses a lagged dependent variable with the contemporaneous term of the explanatory variables. In this case, the long-run PTM elasticity is given as β/(1−α) , where α and β are the coefficients on the lagged dependent variable and contemporaneous coefficient on the exchange rate respectively. The alternative specification adopts a distributed lag structure, which includes several lags of the explanatory variables but not the lagged dependent variable.
As such, the long-run PTM coefficients are given as the sum of the coefficients on the
2Following many studies in this area, we use the unit value indices for export prices, given the availability of data.
It is often noted that unit value indices are imperfect proxies for trade prices due to measurement errors (Knetter, 1989, and Takagi and Yoshida, 2001). However, it is found that for countries that have both indices, the correlation of the two series are actually quite high (Bussière and Peltonen, 2008).
contemporaneous and the lagged NEER. The second specification is used as our benchmark model, while the first specification will also be used for robustness checking. A general-to- specific approach is used in determining the number of lags included. Initially, up to six lags of explanatory variables are included in the estimation, and the longest lag that is not significant at the 5 per cent level will be eliminated sequentially until the longest significant lag is found. This searching procedure suggests a structure with up to one lag of the NEER and control variables.
To address the correlation between marginal cost and the NEER, reflecting the impact of exchange-rate changes on input costs, we run an auxiliary regression. In this auxiliary model, the marginal cost is regressed on the NEER, the residuals, which will be referred to as the orthogonalised marginal cost in the subsequent discussions, are used in the place of the marginal cost in the PTM regression. The coefficient using the original marginal-cost series captures the direct impact of exchange rate changes on pricing, i.e. the PTM coefficient, while the coefficient on NEER using the orthogonalised marginal-cost series encompasses both the direct and indirect effects of exchange-rate changes on export prices, including both the PTM effect and the effect on production costs due to exchange-rate movements.
Description of aggregate data
The renminbi has been largely on an appreciation path in recent years, appreciating by 27.1 per cent in effective terms between January 2005 and March 2009. The fastest year-on-year appreciation occurred in late 2007 and early 2008, peaking at 17 per cent in November 2007, mostly reflecting the strengthening of the renminbi against the US dollar. Although the appreciating trend of the renminbi against the US dollar has paused subsequently, the renminbi remains more than 15 per cent appreciated in effective terms from one year ago.
In the US-dollar terms, year-on-year inflation of China’s export price has risen continuously since early 2005 (when the series became available) until the second half of 2008 when external demand collapsed amidst the global recession. In renminbi terms, year-on-year export price inflation mainly went through three periods – (a) a decline from around 7 per cent at the beginning of 2005 to as much as -3 per cent in March 2006; (b) fluctuations around zero between late 2005 and early 2008; and (c) a noticeable disinflation from the second half of 2008 with an average annual fall of 2.8 per cent in the nine months to March 2009 (Chart 1).
Turning to domestic conditions, production costs have also experienced sharp swings. Annual inflation of the PPI, a common indicator of domestic cost, rose sharply from 2007 to early 2008, driven by rising prices of energy, mining products and raw materials. After peaking at around 10 per cent in August 2008, PPI inflation quickly subsided and dropped into negative territory as global commodity prices collapsed (Chart 2).
China Economic Issues – Number 2/09, July 2009
Chart 1. Export price Chart 2. NEER and PPI
-10 -8 -6 -4 -2 0 2 4 6 8 10 12 14
-10 -8 -6 -4 -2 0 2 4 6 8 10 12 14
in US dollar in renminbi
2005
% yoy, 3mma
2006 2007 2008
% yoy, 3mma
-20 -15 -10 -5 0 5 10 15
-20 -15 -10 -5 0 5 10 15
NEER (RHS) PPI (LHS)
2005
% yoy
2006 2007 2008
% yoy
Appreciation
Sources: CEIC and authors’ calculation. Sources: CEIC and authors’ calculation.
Econometric Results
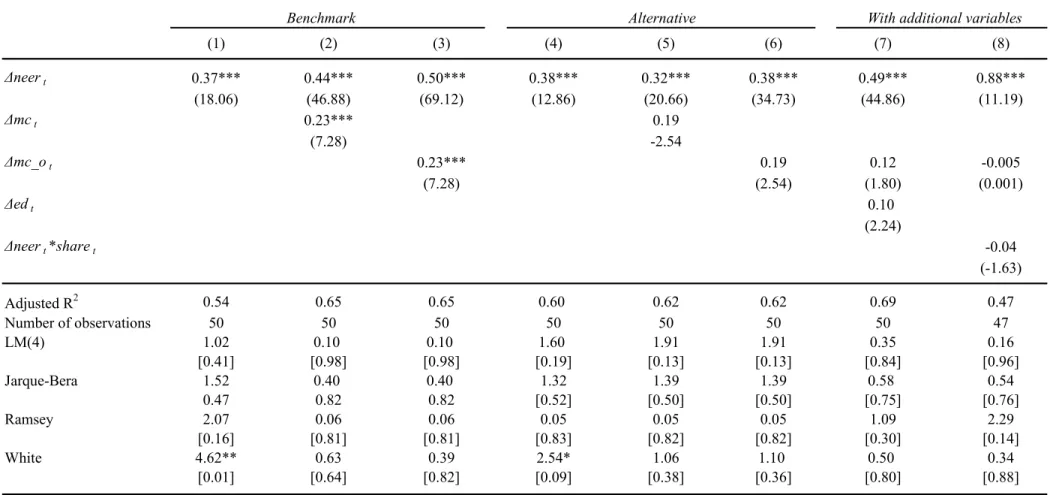
The first three columns of Table 1 present estimates of the PTM elasticity from three versions of the PTM equation: (a) with the NEER alone and no controlling variables, (b) add the control variable of the marginal cost, which is taken as the original PPI series; and (c) use the orthogonalised marginal cost variable. Most of the models pass diagnostic tests, including autoregression, normality, heteroscesdasticity and general specification tests, and thus can be considered to be well specified. For models which fail the White heteroscesdasticity test, the Newey-West estimator is used for estimation and reported standard errors have adjusted for heteroscesdasticity and autocorrelation accordingly.
The estimated direct PTM coefficient, i.e. the gauge for the extent of strategic pricing, at the aggregate level is around 0.44 (Columns 1 - 2). The estimate from the model with orthogonalised marginal cost (Column 3, Table 1) at 0.50 is higher than that with the original producer-price series, reflecting the indirect impact of exchange-rate changes on production cost. Based on this estimation, a 10-per cent appreciation in the NEER will lead to a 5- per cent fall in export prices denominated in domestic prices, while the other 5-per cent adjustment will take place in the foreign-currency price. On average, most of the adjustments will be on the exporters’ profit margins, which would be compressed as the exporters cannot pass on the full impact of the exchange rate to overseas buyers. A modest proportion of the adjustment (around 0.6 percentage points out of the five-percentage-point adjustment) reflects the decline in marginal cost due to the exchange-rate changes. The estimated coefficient for the marginal- cost variable is positive and highly significant.
Robustness check
The results discussed above are based on the distributed lag specification. Columns 4 - 6 of Table 1 report estimate PTM coefficients from an alternative dynamic specification, i.e. that with one lagged dependent variable. From this alternative specification, the PTM coefficients (ranging from 0.32 to 0.38) are slightly lower than the previous set of results. The estimated coefficients for marginal cost in the export price equation, while similar in magnitudes to the benchmark estimates, are only close to be statistically significant at the 10 per cent level.
Columns 7 - 8 of Table 1 present specifications with other control variables included in the benchmark model. External demand (approximated by growth of G3 economies) and China’s share in the world total exports are considered. China’s market-share variable enters the equation as an interactive term with the NEER. This interactive term carries a negative sign, suggesting that the higher China’s share in the world’s exports, the more adjustment in export prices upon exchange rate changes will take place in foreign currency prices. Nonetheless, the coefficient on this variable is only close to being statistically significant at the 10 per cent level.
Global demand conditions are not found to have a significant impact on export price movements.
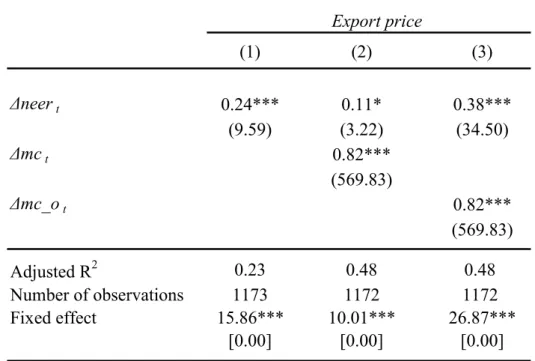
B. Panel evidence
For the panel estimation, we use disaggregate data from the two-digit SITC classification. The panel counterparts of the PTM and ERPT equations are:
(6)
∑ ∑
= Δ − + = Δ −
+
=
Δ T
j
T
j j it j
j t i j
i t
i NEER MC
PX
0 , 0 ,
, ln( ) ln( )
)
ln( μ β γ ,
with i and j representing the sector and month respectively. PXi,t and MCi,t denote industry level export prices and marginal cost (approximated by the industry specific PPI) respectively at the two-digit SITC level. The sector level PPI, which follows a different classification system applied to domestic industries, is matched into the SITC classification for the estimation.
The exchange rate is also industry-specific effective exchange rates for the two-digit SITC.
For calculating these industry-specific effective exchange rates, the top five trading partners’
trade weights are used for each industry. Following Athukorala and Menon (1994), the US dollar is used in our calculation in cases where a currency is not widely used, or is pegged to the US dollar. Full details of the use of the US dollar and other currencies are given in Table 2.
Analogous to the estimation using aggregate data, several specifications are used in the PTM equations. For the PTM equation, they are: (a) with the NEER as the sole explanatory variable;
China Economic Issues – Number 2/09, July 2009
(b) controlling for marginal cost by using the original producer prices at the sectoral level; and (c) similar to (b) but replacing the marginal cost variable by the orthogonalised producer price series.
Differences in the constant for different industries are related to different mark-ups across markets that are not related to prices and costs, thus a fixed effect model is used for the estimation to account for heterogeneity across sectors. The estimation is undertaken for all sectors under the two-digit SITC as well as for sub-sectors.
Description of the data
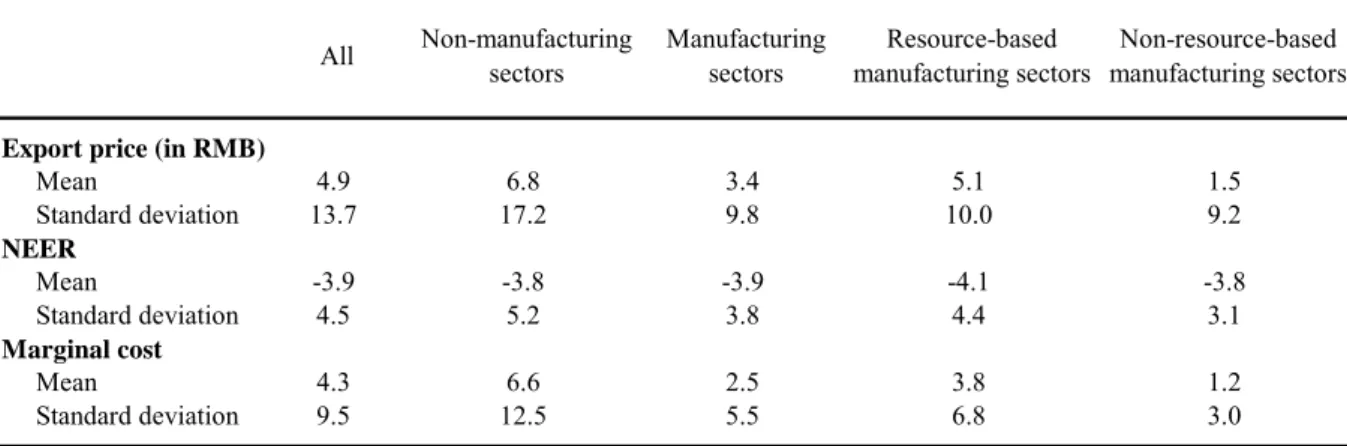
Table 4 shows the descriptive statistics of variables for which sectoral data are available.
Among these variables, export prices show more variations at the sectoral level. While averaging around 5 per cent across all sectors, the non-manufacturing sector (SITC 0-4) has seen higher inflation in export prices than the manufacturing sector (SITC 5-8). Most notably, SITC 3 (petroleum and gas) recorded the highest average year-on-year export price inflation of 12.1 per cent in the last three years. There are also differences within the manufacturing industries. For the more resource-based industries, i.e. SITC 5 (chemicals and related products) and SITC 6 (manufactured goods classified chiefly by material), the average export-price inflation was slightly above the average of all sectors. The less resource-based manufacturing sector, i.e. SITC 7 (machinery and transport equipment) and SITC 8 (miscellaneous manufactured articles, such as furniture, footwear, apparel etc.), have notably smaller increases in export prices, averaging 1.5 per cent over the last few years, under one third of the group average. Some manufacturing industries such as office machines and automatic data- processing machines (SITC 75), and professional apparatus and equipment (SITC 87) recorded declines of 25 per cent year on year in export prices in recent months, much more significant than those of other sectors. Marginal cost shows a similar cross-sectional pattern as export prices, with much higher average year-on-year changes for the non-manufacturing sector than the manufacturing sector.
There are two cases in exchange rate changes at the sectoral level. Not surprisingly, for sectors where the US dollar is the dominant currency for invoicing, the movement of the sectoral NEER largely resembles that of the RMB/USD exchange rate. By contrast, for sectors with more diverse invoicing currencies, the NEER changes are more similar to the NEER at the aggregate level. Nonetheless, the average annual appreciation of the NEER is similar across sectors.
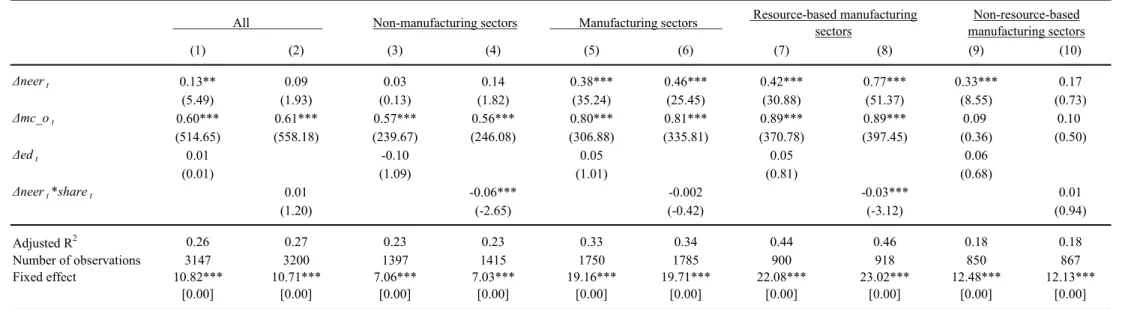
Econometric Results
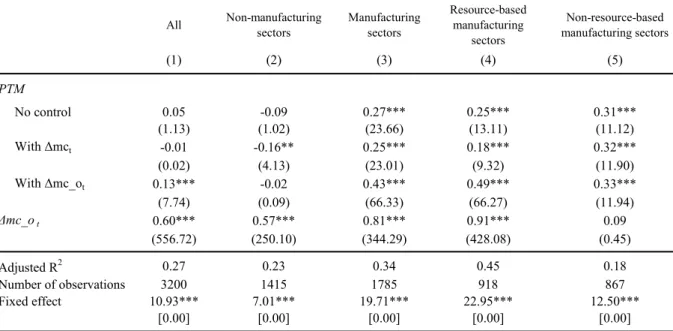
Table 5 reports the estimates using the distributed lag structure for the overall panel and different industrial groups. The fixed effect test results in the bottom two rows of the table uniformly support the specification. Estimation is first undertaken using all the nine sectors
(Column 1). The PTM coefficient is only significant in the case where the orthogonalised marginal-cost variable is used, and, at 0.13, is under one third of the size estimated from the aggregate data. Compared with the aggregate data, the panel data give all sectors equal weights in the estimation, which would exaggerate the impact of the smaller exporting sectors.
Thus, we proceed to undertake the estimation for the sub-samples of the non-manufacturing (SITC 0-4) and manufacturing sectors (SITC 5-8). For the non-manufacturing sector the results are similar to that for the overall panel, the PTM coefficient carries the negative sign in all the three specifications, and is insignificant in two out of the three cases (Column 2).
For the manufacturing sector, the PTM coefficient is highly significant in all the three specifications (Column 3). In particular, the model with the orthogonalised producer price series suggests that a 10 per cent renminbi appreciation will lead to a 4.3 per cent fall in the export price denominated in the renminbi, leaving the rest of the adjustment (5.7 per cent) to take place in the foreign currency denominated export prices. We further examine the PTM behaviour in different types of manufacturing activities, dividing them into more resource- based and heavy industries (SITC 5 and 6), and less resource-based manufacturing industries (SITC 7 and 8). It is found that the price adjustment in the domestic currency, which is the total effect of exchange rate changes, is higher for the more resource-based industries than for less resource based ones, suggesting greater adjustment should take place in the foreign currency-denominated export prices in the latter in response to exchange rate changes (Columns 4-5). In the model with orthogonalised marginal cost, 67 per cent of the price adjustment will be reflected in foreign currency prices for the less resource-based industries, compared with 51 per cent for the resource-based manufacturing sector. However, the price adjustment in the domestic currency is mostly due to changes in marginal cost for the resource- based manufacturing sector, while that for the non-resource-based manufacturing sector principally reflects strategic pricing.
Comparisons of the coefficients on the NEER in the specifications with the original and orthogonalised marginal-cost series, a distinct result is that among the different industries, costs of resource-intensive sectors (SITC 5 and 6) are more affected by exchange-rate movements, while their profit margins are less affected (Column 4). For these sectors, the total effect is more domestic price adjustment and less foreign price adjustment, but this is mostly driven by cost changes as a result of exchange rate movements rather than PTM considerations.
This is in contrast to sectors that are less resource-intensive sectors (Column 5). For these sectors, a 10-percentage-point exchange rate appreciation will lead to about a three-percentage- point decline in domestic prices, almost all of which would fall on the profit margins of exporters. The estimates suggest that for the sectors which are traditionally considered to be dominated by processing trade, namely the machinery and equipments (SITC 7 and 8), domestic price changes out of the cost saving consideration from exchange rate movements are actually not that big. This may indeed reflect that the declining importance of the traditional assembly operation in these sectors (Cui and Syed, 2007).
China Economic Issues – Number 2/09, July 2009 Robustness check
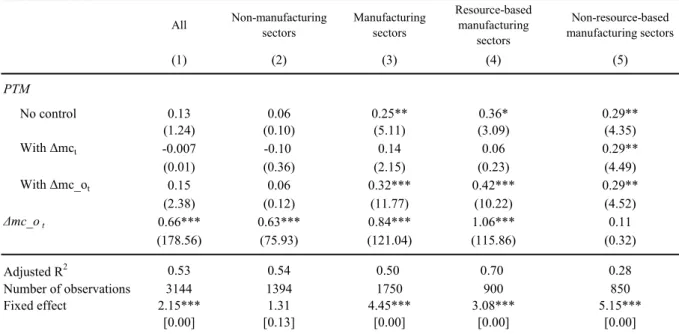
We undertake a range of estimations to check the robustness of the results reported above.
Similar to the aggregate estimation, we also estimate the panel regressions using an alternative dynamic specification, i.e. with the lagged dependent variable. This specification is estimated with the fixed-effect estimator and the Arellano-Bond GMM estimator (1991) which corrects for the correlation between the lagged dependent and explanatory variables. The results are reported in Tables 6 - 7. In general, these alternative estimation procedures give similar results as our benchmark models. The pooled PTM coefficient for the nine sectors and for the non- manufacturing sector is not significant. Nonetheless, this specification appears to have reduced the estimated PTM coefficient such that it becomes insignificant in the specification with the original marginal cost series, except for the non-resource-based manufacturing sector. When the orthogonalised marginal cost is used, the coefficients on the NEER are significant and in the similar range of the estimates from the specification with distributed lags.
Also for the panel estimation, we focus on the large export sectors, taken as those with a share over one per cent in China’s total exports. Overall, there are 23 such sectors. The majority of the big sectors are under SITC 7 and 8, but 6 and 3 are from the resource-based manufacturing sector and non-manufacturing sector respectively. Panel estimation on this group shows that the results are similar to those for the manufacturing sector as a whole due to the dominance of manufacturing sector in this group (Table 8). Nonetheless, the estimated PTM elasticities are low compared with those from the estimation for the manufacturing sector, suggesting that on average, larger exporting sectors have been able to pass on more exchange rate changes to the destination markets, possibly reflecting greater pricing power.
Analogous to the aggregate estimation, additional control variables are considered, including variables corresponding to the external demand and China’s market share in the respective sectors (Table 9). In the equations where these additional variables are included, the estimated PTM elasticities are in the similar range as the benchmark models. Again, external demand does not feature significantly in affecting export prices. Also interestingly, the market share seems to matter for the pricing mechanism of the non-manufacturing sector and the resource- based manufacturing sector, with the results suggesting that in resource-intensive sectors such as energy, metal and construction materials, large producers have a certain amount of pricing power.
V. PTM and currency invoicing: a discussion
Following the theoretical work of Engle (2006), in practice there should be a positive link between ERPT to export prices, and the degree to which exporter’s currency is used for trade
invoicing. To assess this equivalence empirically and find the possible mapping of the pass-through coefficient and the currency choice of exporters, we plot the estimated PTM coefficients and the share of exports in exporters’ currency for a range of countries (Chart 4). The data come from several recent studies in two streams of literatures: PTM and currency choice in trade invoicing. This is the first attempt to our knowledge to consider empirical association of the two theoretically-linked issues in a cross-country sample.
The cross-country data indeed confirm that for a range of countries, the degree of PTM is inversely related to the share of exporters’
currency used in exports (Chart 4). That is, the more the exporter behaves like a price taker in the international market and adjusts the domestic prices in response to exchange-
rate changes, the less likely he/she would denominate the exports in her own currency. Instead, the importer’s currency or a vehicle currency may be used.
We then compare the estimated PTM for China with the available cross-country experience.
This is particularly useful in China’s case as until very recently the trade settlement choice were limited to a non-local currency, being either the trading partner’s currency or a vehicle currency. While the use of the renminbi in trade settlement has recently been allowed, the scope of the business is limited to the cities and enterprises selected under the trial scheme.
Indeed, even if the scheme is broadened to cover all of China’s foreign trade, the actual usage could be limited in the near term given the time needed for international merchants to switch currencies due to what is termed as the network effect in invoicing practices (Goldberg and Tille, 2008). Using the PTM estimates, it is possible to have some insights on the potential use of renminbi in Chinese exports. Although a more comprehensive discussion about the currency invoicing is beyond the scope of the current study, our results could shed light on the on-going debate about the process towards a greater international role of the renminbi.
For China, the point estimate of the PTM coefficient at 0.44 from the aggregate benchmark model is similar to that estimated for Japanese and Czech exports. A simple cross-section regression would imply that a PTM coefficient of this magnitude would on average be associated with around 20-30 per cent of exports being priced in exporter’s currency. Given that it takes time for merchants to change their invoicing practice, the above range (of around
Chart 4. Export-price pass-through and share of exports invoiced in exporter’s
currency
Japan Germany
US
Thailand France
Italy UK
Czech
Australia Malaysia
China (est) 0
20 40 60 80 100 120
0 0.1 0.2 0.3 0.4 0.5 0.6 0.7 0.8
Estimated PTM coefficient Share of exports invoiced in exporter's currency (%)
Sources: Various country and cross-country studies including Vigfusson, Sheets and Gagnon (2009), Bussiere and Peltonen (2008), Duasa (2008), Goldberg and Tille (2008), and authors’ calculation. The shares of home currency invoicing as compiled by Goldberg and Tille (2008) refer to
“extra euro-area” trade for France and Germany. These are converted to the shares in total trade assuming that intra euro-area trade is denominated in euro. The results are similar if the “extra euro-area” trade shares are used for all euro-area countries.
China Economic Issues – Number 2/09, July 2009
one third of the exporter’s currency) may be taken as an upper bound of the use of the renminbi in China’s exports in the near term.
VI. Conclusion
This paper undertakes the first empirical study to estimate China’s PTM elasticities based on both aggregate and panel data. China’s data conform to the established regularity worldwide that ERPT to export prices in foreign currencies is incomplete, and PTM behaviour in pricing is prevalent. The results show that at the aggregate level, about half of the exchange rate changes are reflected in domestic price adjustments. The major part of the domestic price adjustment reflects exporters’ PTM behaviour, while a relatively small percentage of domestic price adjustment is due to the indirect impact of exchange-rate movements on production costs.
Within the manufacturing sector, the resource-based industries adjust export prices in domestic currencies by a greater extent in response to exchange-rate changes, mostly owing to indirect impact of the exchange rate movements on production costs, rather than the direct impact on profit margins. While the changes in domestic currency export prices in response to exchange rate movements are smaller for the less resource-based manufacturing sector, the adjustment almost entirely reflects strategic pricing, and thus has a greater impact on exporters’
profitability.
Among a wide range of issues these findings can have implications on, we focus our discussions on trade invoicing within the context of the widening external use of renminbi. As PTM and currency invoicing are determined by a similar set of factors driving price elasticity of foreign demand, the degree of PTM is intimately related to the fraction of trade invoicing in the home currency. In China’s case, studying PTM could give an indicative size of demand for the renminbi in trade invoicing, should exporters have the freedom to choose. International comparisons show our estimates of China’s PTM coefficient could be translated to 20 - 30 per cent of exports to be invoiced in the renminbi in the scenario of fully liberalised currency use for trade. Given that in China, the use of the renminbi for trade settlement is still at an early and experimental stage, and in any case it takes time for merchants to switch currencies, the above range can be taken as an upper bound of the use of renminbi in China’s exports in the near term.
Whilst contributing to the understanding of China’s external adjustment and the potential demand for the renminbi for trade settlement, this study also indicates abundant future research areas to further our understanding on these issues. We highlight two such areas. Firstly, there is a lack of knowledge on China’s current invoicing practice. While the US dollar is known to be a dominant invoicing in China as for many other developing economies, the extent of its dominance, and the use of other currencies such as the euro are not known. Secondly, further study is needed in investigating the impact of processing trade on the pricing behaviour, given
that such trade accounts for almost half of China’s total exports. Both these areas will enhance our understanding on considerations Chinese exporters take in deciding currency invoicing, which affect the demand for the renminbi invoicing should this avenue be fully open for international trade.
About the Author
Li Cui is a Division Head, Chang Shu a Senior Manager and Jian Chang ex-Manager in the External Department of the Hong Kong Monetary Authority. The authors are grateful to Christina Li for research assistance. The authors are responsible for the views expressed in this article and any errors.
About the Series
China Economic Issues provide a concise analysis of current economic and financial issues in China.
The series is edited by the External Department of the Hong Kong Monetary Authority.
China Economic Issues – Number 2/09, July 2009 References
Arellano, Manuel, and Stephen Bond (1991), “Some tests of specification for panel data:
Monte Carlo evidence and an application to employment equations,” Review of Economic Studies, 58(2), 277-97.
Bussière, Matthieu and Tuomas Peltonen (2008), “Exchange rate pass-through in the global economy: the role of emerging market economies,” European Central Bank Working Paper Series, 951.
Campa, Jose Manuel and Linda S. Goldberg (2006), “Pass through of exchange rates: what has changed and why?”, NBER Working Paper, 12547.
Cui, Li and Murtaza Syed (2007), “The Shifting Structure of China’s Trade and Production,”
IMF working paper 07/214.
Duasa, Jarita (2008), “Impact of exchange rate shock on prices of imports and exports,” MPRA Paper, 11624.
Falk, Martin and Rahel Falk (2000), “Pricing to market of German exporters: evidence from panel data”, Empirica, 27, 21-46.
Friberg, Richard (1998), “In which currency should exporters set their prices?”, Journal of International Economics, 45, 59-76.
Gaulier, Guillaume et al. (2006), “Structural determinants of the exchange-rate pass-through”, CEPII Working Paper, 2006-03.
Ghosh, Amit and Ramkishen S. Rajan (2007), “A comparative analysis of export price pass- through in three open Asian economies: Korea, Singapore and Thailand”, Global Economic Review, 36(3), 287-299.
Goldberg, Linda and Cedric Tille (2008), “Vehicle currency use in international trade,”
Journal of International Economics, 76(1), 77-92.
Goldberg, Pinelopi K. and Michael M. Knetter (1997), “Goods prices and exchange rates: what have we learned?”, Journal of Economic Literature, 35, 1243-72.
Gopintah, Gita, Oleg Itskhoki and Roberto Rigobon (2007), “Currency choice and exchange rate pass-through,” NBER Working Paper, 13432.
Gron, Anne and Deborah L. Swenson (1996), “Incomplete exchange-rate pass-through and imperfect competition: the effect of local production”, American Economic Review, 86(2), 71-6.
Knetter, Michael M. (1989), “Price discrimination by U.S. and German exporters,” American Economic Review, 79(March), 198-210.
Knetter, Michael M. (1993), “International comparisons of pricing-to-market behaviour”, American Economic Review, 83(3), 473-86.
Krugman, Paul (1987), “Pricing to market when the exchange rate changes”, in Real- Financial Linkages among Open Economies, ed. by Sven W. Arndt and J. David Richardson (Cambridge, Massachusetts, MIT Press).
Lee, Jaewoo (1995), “Pricing-to-market in Korean manufacturing exports”, International Economic Journal, 9(4), 1-12.
Mallick, Sushanta and Helena Marques (2008), “Sectoral exchange rate pass-through: a tale of two policy regimes in India”, IMF Staff Paper, 55(1), 83-108.
Mann, Catherine (1986), “Prices, profit margins and exchange rates”, Federal Reserve Bulletin, 72, 366-79.
Marazzi, Mario et al. (2005), “Exchange rate pass-through to US import prices: some new evidence”, Board of Governors of the Federal Reserve System International Finance Discussion Paper, 833.
Mejean, Isabelle (2004), “Exchange rate movements and export prices: an empirical analysis, MIMEO.
Parsley, David C. (2004), “Pricing in international markets: a 'small-country' benchmark”, Review of International Economics, 12(3), 509-24.
Parsons, Craig R. and Kiyotaka Sato (2008), “New estimates of exchange rate pass-through in Japanese exports”, International Journal of Finance and Economics, 13, 174-83.
Sasaki, Yuri Nagataki (2002), “Pricing-to-market behavour: Japanese exports to the US, Asia and the EU”, Review of International Economics, 10(1), 140-50.
Takagi, Shinji and Yushi Yoshida (2001), “Exchange rate movements and tradable goods prices in East Asia: an analysis based on Japanese customs data, 1988-1999”, IMF Staff Paper, 48(2), 266-89.
Taylor, John B. (2000), “Low inflation, pass-through, and the pricing power of firms”, European Economic Review, 44(7), 1389-1408.
China Economic Issues – Number 2/09, July 2009
Vigfusson, Robert J., Nathan Sheets and Joseph Gagnon (2009). ‘Exchange rate pass-through to export prices: assessing some cross-country evidence.’ Review of International Economics, 17(1), 17-33.
Table 1. Estimation with aggregate data: benchmark and alternative models
(1) (2) (3) (4) (5) (6) (7) (8)
Δneert 0.37*** 0.44*** 0.50*** 0.38*** 0.32*** 0.38*** 0.49*** 0.88***
(18.06) (46.88) (69.12) (12.86) (20.66) (34.73) (44.86) (11.19)
Δmct 0.23*** 0.19
(7.28) -2.54
Δmc_ot 0.23*** 0.19 0.12 -0.005
(7.28) (2.54) (1.80) (0.001)
Δedt 0.10
(2.24)
Δneert*sharet -0.04
(-1.63)
Adjusted R2 0.54 0.65 0.65 0.60 0.62 0.62 0.69 0.47
Number of observations 50 50 50 50 50 50 50 47
LM(4) 1.02 0.10 0.10 1.60 1.91 1.91 0.35 0.16
[0.41] [0.98] [0.98] [0.19] [0.13] [0.13] [0.84] [0.96]
Jarque-Bera 1.52 0.40 0.40 1.32 1.39 1.39 0.58 0.54
0.47 0.82 0.82 [0.52] [0.50] [0.50] [0.75] [0.76]
Ramsey 2.07 0.06 0.06 0.05 0.05 0.05 1.09 2.29
[0.16] [0.81] [0.81] [0.83] [0.82] [0.82] [0.30] [0.14]
White 4.62** 0.63 0.39 2.54* 1.06 1.10 0.50 0.34
[0.01] [0.64] [0.82] [0.09] [0.38] [0.36] [0.80] [0.88]
Benchmark Alternative With additional variables
Notes:
1. The coefficients on the variables, with the exception of the interactive term, are given as long-run elasticities, and figures in ( ) are F-statistics indicating their statistical significance. For the interactive term, the coefficient on the contemporaneous term and its t-statistic are given.
2. Figures in [ ] are p-values for the diagnostic tests.
3. ***, ** and * indicate that the coefficients or statistics are significant at the 1%, 5% and 10% level respectively.
Table 2. Currencies used for calculating sector specific NEER
National currency Euro
Australia Angola Myanmar Belgium
Canada Argentina Nepal France
Denmark Bangladesh Oman Germany
Japan Belarus Pakistan Italy
Korea Brazil Papua New Guinea Netherlands
New Zealand Chile Peru Spain
Norway Cuba Philippines
Poland Gabon Saudi Arabia
Russian Germany South Africa
Singapore Hong Kong Taiwan
Sweden India Thailand
Switzerland Indonesia Turkey
Thailand Iran United Arab Emirates
Turkey Israel United States
United Kingdom Kuwait Uruguay Lao Uzbekistan Liberia Vietnam
Macao Zambia
Malaysia Zimbabwe Mongolia
Morocco
US dollar
Table 3. One-digit SITC
SITC section Descriptions
0 Food and live animals 1 Beverages and tobacco
2 Crude materials, inedible, except fuels 3 Mineral fuels, lubricants and related materials 4 Animal and vegetable oils, fats and waxes 5 Chemicals and related products, n.e.s.
6 Manufactured goods classified chiefly by material 7 Machinery and transport equipment
8 Miscellaneous manufactured articles
9 Commodities and transactions not classified elsewhere in the SITC Non-manufacturing
sectors
Resource-based manufacturing sectors Non-resource-based manufacturing sectors Manufacturing
sectors
Table 4. Descriptive statistics for panel data
Export price (in RMB)
Mean 4.9 6.8 3.4 5.1 1.5
Standard deviation 13.7 17.2 9.8 10.0 9.2
NEER
Mean -3.9 -3.8 -3.9 -4.1 -3.8
Standard deviation 4.5 5.2 3.8 4.4 3.1
Marginal cost
Mean 4.3 6.6 2.5 3.8 1.2
Standard deviation 9.5 12.5 5.5 6.8 3.0
Non-resource-based manufacturing sectors Non-manufacturing
sectors
All Manufacturing
sectors
Resource-based manufacturing sectors
Table 5. Estimation with panel data: benchmark models
(1) (2) (3) (4) (5)
PTM
No control 0.05 -0.09 0.27*** 0.25*** 0.31***
(1.13) (1.02) (23.66) (13.11) (11.12)
With Δmct -0.01 -0.16** 0.25*** 0.18*** 0.32***
(0.02) (4.13) (23.01) (9.32) (11.90)
With Δmc_ot 0.13*** -0.02 0.43*** 0.49*** 0.33***
(7.74) (0.09) (66.33) (66.27) (11.94)
Δmc_ot 0.60*** 0.57*** 0.81*** 0.91*** 0.09
(556.72) (250.10) (344.29) (428.08) (0.45)
Adjusted R2 0.27 0.23 0.34 0.45 0.18
Number of observations 3200 1415 1785 918 867
Fixed effect 10.93*** 7.01*** 19.71*** 22.95*** 12.50***
[0.00] [0.00] [0.00] [0.00] [0.00]
All Non-manufacturing sectors
Manufacturing sectors
Resource-based manufacturing
sectors
Non-resource-based manufacturing sectors
Notes:
1. The coefficients on the variables are long-run PTM elasticities, and figures in ( ) are F-statistics indicating their statistical significance.
2. Figures in [ ] are p-values for the diagnostic tests
3. ***, ** and * indicate that the coefficients or statistics are significant at the 1%, 5% and 10% level, respectively.
4. The equation information, including adjusted R2, number of observations and tests for fixed effects, is for the benchmark specifications with Δmc_ot .
China Economic Issues – Number 2/09, July 2009
Table 6. Estimation with panel data:
alternative models using the fixed effects estimator
(1) (2) (3) (4) (5)
PTM
No control 0.13 0.06 0.25** 0.36* 0.29**
(1.24) (0.10) (5.11) (3.09) (4.35)
With Δmct -0.007 -0.10 0.14 0.06 0.29**
(0.01) (0.36) (2.15) (0.23) (4.49)
With Δmc_ot 0.15 0.06 0.32*** 0.42*** 0.29**
(2.38) (0.12) (11.77) (10.22) (4.52)
Δmc_ot 0.66*** 0.63*** 0.84*** 1.06*** 0.11
(178.56) (75.93) (121.04) (115.86) (0.32)
Adjusted R2 0.53 0.54 0.50 0.70 0.28
Number of observations 3144 1394 1750 900 850
Fixed effect 2.15*** 1.31 4.45*** 3.08*** 5.15***
[0.00] [0.13] [0.00] [0.00] [0.00]
All Non-manufacturing sectors
Manufacturing sectors
Resource-based manufacturing
sectors
Non-resource-based manufacturing sectors
Notes:
1. The coefficients on the variables are long-run PTM elasticities, and figures in ( ) are F-statistics indicating their statistical significance.
2. Figures in [ ] are p-values for the diagnostic tests
3. ***, ** and * indicate that the coefficients or statistics are significant at the 1%, 5% and 10% level, respectively.
4. The equation information, including adjusted R2, number of observations and tests for fixed effects, is for the benchmark specifications with Δmc_ot.
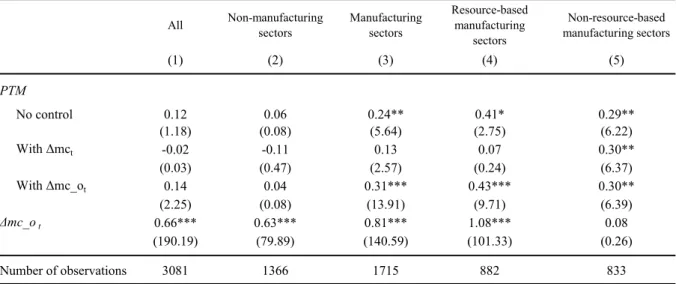
Table 7. Estimation with panel data:
alternative models using the GMM estimator
(1) (2) (3) (4) (5)
PTM
No control 0.12 0.06 0.24** 0.41* 0.29**
(1.18) (0.08) (5.64) (2.75) (6.22)
With Δmct -0.02 -0.11 0.13 0.07 0.30**
(0.03) (0.47) (2.57) (0.24) (6.37)
With Δmc_ot 0.14 0.04 0.31*** 0.43*** 0.30**
(2.25) (0.08) (13.91) (9.71) (6.39)
Δmc_ot 0.66*** 0.63*** 0.81*** 1.08*** 0.08
(190.19) (79.89) (140.59) (101.33) (0.26)
Number of observations 3081 1366 1715 882 833
Resource-based manufacturing
sectors
Non-resource-based manufacturing sectors All Non-manufacturing
sectors
Manufacturing sectors
Notes:
1. The coefficients on the variables are long-run PTM elasticities, and figures in ( ) are F-statistics indicating their statistical significance.
2. Figures in [ ] are p-values for the diagnostic tests
3. ***, ** and * indicate that the coefficients or statistics are significant at the 1%, 5% and 10% level, respectively.
4. The number of observations is for the benchmark specifications with Δmc_ot.