Optimizing distribution of Rating Scale Category in Rasch Model
Han-Dau Yau, Graduate Institute of Sports Training Science, National Taiwan Sport
University, Taiwan
Wei-Che Yao, Department of Statistics, National Taipei University, Taiwan
Presented at the 76th Annual and the 17th
I
nternational
M
eeting of the
P
sychometric
S
ociety, The Hong Kong Institute of Education, Hong
Kong, July 19 –22, 2011
Please address correspondence concerning this manuscript to:
Han-Dau Yau
Graduate Institute of Sports Training Science, College of Sports and Athletics
National Taiwan Sport University
250, Wen Hua 1st Rd., Kueishan, Taoyuan County, Taiwan.
E-mail: [email protected]; [email protected]
Grant funding information:
The Research Project was supported by grants from the
National Science Council (NSC 99-2410-H-179-009), Taiwan. The presentation was
supported by grants from the National Science Council
Optimizing distribution of Rating Scale Category in Rasch Model
Han-Dau Yau, & Wei-Che Yao*
Graduate Institute of Sports Training Science, College of Sports and Athletics, National
Taiwan Sport University;
* Department of Statistics, National Taipei Universtiy.
Abstract
In tradition, testing of sports skills used to set categories by subjective method. Yau (2010) developed a new objective method of category setting, but did not point out what kind of
distribution theory was used accurately. The purpose of the study was to optimize distribution of rating scale category in Rasch model. The studied objects are normal distribution, logistic distribution, binomial distribution, and uniform distribution. The method was to use SAS and Minitab to produce random data, and then use Winsteps to estimate data categories. Experiment design was two-way design (sample × test length), and we simulated them five times for each cell. The results were: 1. Normal distribution was the ideal distribution when sample size was over 3000 in response data. 2. Logistic distribution was the better distribution when sample size was less than 1500 in response data. The conclusion of the study was that optimizing distribution of rating scale category in Rasch model was related to sample size.
Introduction
After Rasch measurement was recommended to construct the sport skills tests. The original design of tests was based on subjective experience, and we found that the category setting of scale, the response information of subjects lacked for sport skills tests. It showed a problem of disorder category. Therefore, Yau (2010) had developed a setting approach of objective and reasonable for category, but he did not clarify which distribution theory was studied. In this study, it was a simulation study of the category setting of scale in sport skills tests, with the most suitable theoretical distribution to category of Rasch rating scale model.
This study extended to develop the approach of categories setting in sport skill testing: an example of Multiple-Attempt Single-Item tests (Yau, 2010). In the development of test practice, the ability of item difficulty can not often fit subjects. In particular, Rasch rating scale model of test construction usually met the occurrence of the phenomenon of disorder categories. The focus of this review should modify the standard nuclear program, but how those standards should be divided between the scopes of the class will have a reasonable estimate. Therefore, this study attempts to explore the best of category of Rasch rating scale based on probability distribution theory.
The study of category disorder were original from the result of Rasch model estimation, the published academic paper which began Linacre (1991) the "Step Disordering and Rasch Thurstone Thresholds," Linacre concluded:“Rasch-Thurstone-type Thresholds provide the best estimate of the transitions between categories of the rating scale. Step disorder is of no concern, provided that the structure of the scale is conceptually sound.“This article discussed the disorder of rating scale for categories that problem returned to the "Rasch-Thurstone-type threshold" theory. When the person’s ability reached a higher level estimates, should person crossed the higher threshold. If you reached a higher threshold then it had been lower than the threshold level. Overview this paper, it did not analyze the categories of threshold issues from the actual response estimate, only on theoretical sources described. The original rating scale model was expanded from dichotomous Rasch model, and dichotomous Rasch model does not have disorder the problem, which only related to the level of item difficulty.
We review former papers about the disorder categories researched below:
showed that frequencies of the category is too small to make probability low, which can not show the highest probability at some capacity steps; in the skills tests of sports, the problem is inappropriate setting of range category, which the item difficulty and subject ability is not fit. When adjusting the range of category, which distribution theory should be based on need to clarify further research.
2. For the discussion of the reliability and validity of Rasch measurement: first of all, Stone and Wright (1994) found person separation was best with the categories grouped into 3 levels from the original five category scale. Second Bond and Fox (2007) description "guidelines for collapsing categories ", that proposed: " The rating scale diagnostics help us in determining the best categorization , knowledge of Rasch reliability and validity indices tell us how the measure is functioning as a whole. (p 231)" In other words, Bond and Fox thought the best categorization improved test reliability and validity. In recent years, some of the disorder categories researches had confirmed the affect of reliability and validity. For example: Tennant (2004) reported a recent paper for threshold disorder in health care, which caused the impact on the scale validity in functional independence measure.
3. Solution to the disorder categories; on disorder treatment, Andrich (1996) suggested that categories 2 and 3 should be combined and categories 4 and 5 likewise. Perhaps this disorder problem could be solved, but in fact, it would abandon a category. Yau, Chi, Zhou and Yao (2008) revised the standing long jump observation checklist. This study used the method of collapsed category to treat the disorder categories problem. Although, the revision of checklist fit theory, but it reduced some categories and the power of discrimination and validity simultaneously in the standing long jump observation checklist. In addition, Pesudovs, Gothwal, Wright, and Lamoureux (2010) found the problem in disorder category by combining treatment from the national eye institute visual function questionnaire :“Because category 3 is a neutral category, it did not seem logical to combine it with an adjacentcategory.”Another solution is made by Siegert, Jackson, Tennant, and Turner-Stokes (2010). They proposed the five steps of Rasch analysis. The main method was “stepwise deletion ofthe worstfitting item”. There is another new procedure for dealing with disorder categories. Moreover, Van Lente, Karabatsos, and Uekawa (2010) review traditional procedure that “the particular
recategorization of the rating scale that eliminates inconsistencies. However, there is no clear consensus as to which method is best.”Theycreated a new approach (2010) “This study introduces a sample-free method of rating scale optimization, based on the bootstrap, which addresses the issues just mentioned. The bootstrap is a general statistical procedure that simulates the population distribution by resampling from the original (sample) data set with replacement.”Finally, Linacre (2010) advocated “This paper suggests that transition
threshold value was the cause of short of clearly defined categories, which subjects were unable to distinguish. The solution method was to combine category, or delete the item of threshold disorder. If we combine category, it had to fit the logic reaction, as well. But both methods were to reduce category or delete item. The methods were regarded as a temporary way, and not the fundamental way to improve disorder categories. Finally Linacre (2010) pointed it promoted the measurement analysis, and clearly intended letter category which guided the future improvement threshold disorder for a good strategy. The ideas and this study were consistent with the development of category setting methods in sport skill testing. 4. Optimizing Rating Scale Category: Linacre (2001) pointed out“When the thresholds are
Rasch-Andrich thresholds or step calibrations, then disordering occurs when some categories never become modal, i.e., they are not observed frequently enough. This implies that they correspond to intervals on the latent variable narrower than about 1 logit in terms of
Rasch-Thurstone thresholds.”The study pointed out that category disorder was caused by the lack of observations frequency, and he proposed a disorder phenomenon when the threshold interval was less than 1.0 logit value. The contribution of this study: it presented objective criteria to judge poor category. Then, Linacre (2002) researched the appropriate range of category. Linacre made a number of guidelines:“Preliminary Guideline:Allitems oriented with latent variable. Guideline 1: At least 10 observations of each category. Guideline 2: Regular observation distribution. Guideline 3: Average measures advance monotonically with category. Guideline 4: OUTFIT mean-squares less than 2.0. Guideline 5: Step calibrations advance. Guideline 6: Ratings imply measures, and measures imply ratings. Guideline 7: Step difficulties advance by at least 1.4 logits. Guideline 8: Step difficulties advance by less than 5.0 logits.”The guidelines forthe appropriate category from the actual study was quite good. When the step difficulty was less than 1.4 logit, the category generated disorder. For example: Yau et al. (2008) researched the standing long jump observation checklist.
5. The study of disorder categories in sports psychology survey. In self-efficacy scale, Zhu, Updyke and Lewandowski (1997) used Rasch analysis to study the optimal categorization of a self-efficacy scale and had some results:“(1) It was found that, instead of the five-category construct designed, the best order of category meanings of the scale in respondents'
perceptions was a three-category construct. (2) Post-hoc Rasch analysis of optimal
categorization of an ordered-response scale in determining the optimal categorization of an ordered-response scale.”This study also used the combined category ofmethods.The categories were reduced from five to three categories, and the fitness of category was
the original five-category construct, which had a disordered internal construct, a collapsed three-category construct (i.e., Very Often/Often, Sometimes/Rarely, and Never) was found to have the optimalcategorization.”Zhu (2002) found “scalewas modified from its original five-category structure ("Very often" = 1, "Often" = 2, "Sometimes" = 3, "Rarely" = 4, and "Never" = 5) to a three-category structure ("Very Often" = 1, "Sometimes" = 2, and "Never" = 3). ……These results verified thatthe characteristics ofthe optimalcategorization identified by the Rasch post-hoc analysis can be maintained after the original scale was modified based on such an analysis.”Myers, Feltz, and Wolfe (2008): used confirmatory studied for the
category effectiveness of Rating Scale in coaching efficacy scale. They discussed the
structure of optimal categorization, and concluded two approaches:“1.Exploratory study was to identify an effective categorizations structure through exploratory post hoc methods. 2. Confirmatory study was to confirm the effectiveness of this categorizations structure in a subsequent study.”These were the study of psychological feeling, which category setting belonged to semantic field and was irrelevant to division areas of specific in sport skill testing, and the reasonable category setting of subjects was different.
6. The study of step disorder in sports testing. Chou and Yau (2006) An evaluation of the assessing the development level of the Standing Long Jump Observation Checklist (SLJOC). The average measure of the category 2 of the item 3 was -2.57. This disorder in the average measures of categories might imply the disorder in the category definitions. Chou and Yau focused on evaluation, so only showed the disorder phenomenon and attributed to the problem of category definition, but did not try to find the solution to the problem. Yau et al. (2008) revision of the assessing the developmental level of the SLJOC, aimed at disorder when estimation, it used method of category combination to combine the second category and the third category in the second item, and the first category and the second category in both the third and the sixth items. The revised estimation got a better data-model fit. The solution to the problem in Yau et al. research is the method of combination category tactic from Bond and Fox (2007). On the other view, this kind of combination category tactic was a worse way to solve the problem. If we combined the categories constantly, it would make the discrimination reducing, which disobeyed the goal of category setting. Besides, in Chen (2008) a construction of forehand driving test for first level athletes in Table Tennis, this research was to find the proper category setting by testing and revising three times, but lack of the support of theory and concrete data it reluctantly showed there was not a disorder problem referring to the estimation from the software so we could use Rasch model to analyze data. Obviously we have to the right method of category setting that could solve problem thoroughly. Then Yau (2010) developed a reasonable categories setting approach in sport skill testing, but that could not know which distribution theory was better to use. Proper category distribution theory is the key to complete measurement successfully. So that building theory distribution of rating scale category in Rasch model is the remedy for solving disorder problem.
setting method of sports skill testing. When we use the Rasch model to construct testing, there is no practical category setting method about distribution ratio of rating scale category. If the estimation brings category disorder, we only have unwise method to apply. So it is the fundamental and better way to discuss the category distribution theory of testing construction that it could build reasonable theory distribution. Therefore the purpose of this study is to simulate the best theory distribution of rating scale category in Rasch model.
Methods
Objects of study
Normal distribution, binomial distribution and logistic distribution are the relative theory distribution of rating scale category in Rasch model. The subjects of this study were above distribution and uniform distribution of proper category which was researched from Linacre (2002).
Focused on logistic distribution firstly, Rasch (1960) supervised the process of over-time reading forstudent,and found the common measurementofstudents’reading promotion measurement that it could be the tool to estimate reading ability accurately. This research started to use Poisson model to solve the problem of number of errors read and defined each ability and difficulty, (a person p of ability Bp, a text t of difficulty Dt), which nature
log was used and cumulate function was logistic distribution. Secondly, dichotomous model was distributed by Bernoulli distribution and the rating scale was ordinal category which was distributed by Binomial distribution. So we brought Binomial distribution into the subject of distribution theory study. For normal distribution, the practical data were distributed by normal distribution because one of the characteristics for mother group was distributed by normal distribution. Normal distribution was approximate to both binomial distribution and Poisson distribution (Ho & Yau, 1997). Besides, most of statistic problems were usually solved by normal distribution, so normal distribution was the subject of this study. Finally, for proper category range from Linacre (2002), Guideline 2 showed regular observation distribution:
“Irregularity in observation frequency across categories may signalaberrantcategory usage.A uniform distribution ofobservations across categories is optimalforstep calibration.”
Therefore, uniform distribution was concerned in this study.
Procedures
Data
We used the normal, binomial, and ranuni functions from SAS to produce random data which were distributed by normal distribution, binomial distribution, and uniform distribution, and saved them as SAS permanent file (extend file named sas7bdat). Then we used logistic function from Minitab14 to produce random data which were distributed by logistic distribution and saved it as a Minitab14 file and transferred it to Excel file directly.
Rasch Analysis
This study used Winsteps to read SAS permanent file and Excel file to build Winsteps program and data file, then we could estimate parameter by Winsteps which evaluated the data-model fit in simulated data.
Design
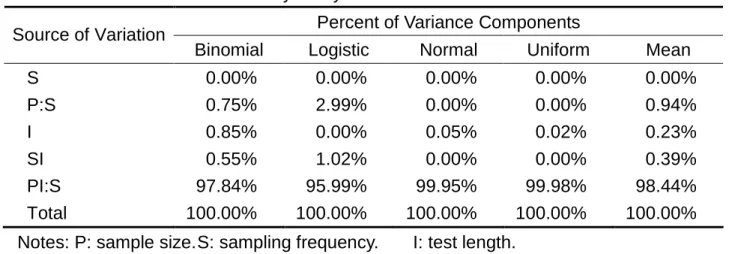
There were four factors in the simulation study: distribution theory(DT), sampling frequency(SF), sample size(SP), and test length(TL). Distribution theory was decided by Rasch score measurement model, and the design of the study could be the best judgment by generalizability theory, which the proper level of other 3 factors should be decided first. At the pilot study, we defined 5 times random sampling (S), which drew 30 samples (P) each time, and the test length was ten items (I). The analysis model of generalizability theory was ( P : S ) × I that meant P nested within S, and (P:S) crossed with I. The table 1 was result of G-Study.
Table 1 Results of Generalizability Study
Percent of Variance Components Source of Variation
Binomial Logistic Normal Uniform Mean
S 0.00% 0.00% 0.00% 0.00% 0.00% P:S 0.75% 2.99% 0.00% 0.00% 0.94% I 0.85% 0.00% 0.05% 0.02% 0.23% SI 0.55% 1.02% 0.00% 0.00% 0.39% PI:S 97.84% 95.99% 99.95% 99.98% 98.44% Total 100.00% 100.00% 100.00% 100.00% 100.00% Notes: P: sample size.S: sampling frequency. I: test length.
Based on the results of generalization study, the average source of variation of sample size occupied second large percentage because we set large sample (N=1000), median sample (N=300) and small sample (N=30) for each distribution that we concerned. The
average SV of testing length occupied forth large percentage, so we defined testing length into short form (I=10) and long form (I=50). The average SV of sampling frequency approached zero so we did random sampling five times. The whole study samples: each combination simulation did random sampling five times, which produced 120 types of simulation data. The simulation data were sixed-categories data named from 0 to 5, and we compared the accuracy of parameter estimations, category threshold, and which category to score. The comparison showed the accuracy of parameter estimations, how many times and which category threshold disorder was produced, and which statistical distribution the data were distributed by. Besides the judgments suggested by Linacre (2002), this study brought up judgment indexes.
Analysis
This study evaluated the fit of random data that produced by different distribution theories by Rasch analysis and quality of categories by Winsteps software. From the estimation, we could obtain the measurement values of item, subject, and category, and estimated standard error, INFIT and OUTFIT, which explained the information of test (Reliability). The data (item, subject) model fit could prove the validly of test. The most important thing is to evaluate the random data that produced by each theoretical distributions, and the information for
categorical frequency, percentage, step and threshold. We use the reasonable category standard (Linacre, 2002) to be the judgment on evaluating Rasch rating scale model.
Results
The result of the study was to analyze the data-model fit first and estimation accuracy. Then we analyzed the counts of ideal step difficulty, counts of category observation and disordering of step calibration in category estimation. Finally we used the above results to be comprehensive discussion.
Category Fit Statistics
Firstly we analyzed the data-model fit by Rasch measurement. When data fit the Rasch model, measurement was with validity and further inference was meaningful. Linacre (2002) Guideline 4: OUTFIT mean-squares less than 2.0. This judgment suggested the lowest
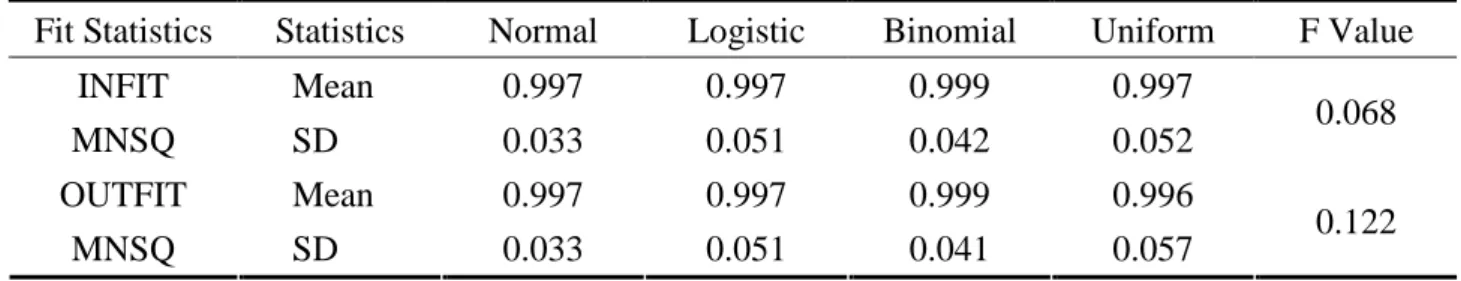
uniform distribution, the INFIT mean square is 0.997, the standard deviation is 0.052. (2) For normal distribution, the OUTFIT mean square is 0.997, the standard deviation is 0.033. For logistic distribution, the OUTFIT mean square is 0.997, the standard deviation is 0.051. For binomial distribution, the OUTFIT mean square is 0.999, the standard deviation is 0.041. For uniform distribution, the OUTFIT mean square is 0.996, the standard deviation is 0.057. (3) Comparison of category fit for 4 distribution theories, the F value of INFIT mean square was 0.068 and the F value of OUTFIT mean square was 0.122 by ANOVA, and both of them did not reach significant level. Therefore the expectation of INFIT and the mean of OUTFIT
approached to 1,and fitGuideline 4 “the mean square offitstatistics ofOUTFIT was less than 2.0.(Linacre,2002)”Itmeantestimated category of 4 distribution theories fit Rasch model, and the fit of category estimation was well and had measurement validity that it could be valid inference.
Table 2 Fit Statistics of category in simulation data
Fit Statistics Statistics Normal Logistic Binomial Uniform F Value Mean 0.997 0.997 0.999 0.997 INFIT MNSQ SD 0.033 0.051 0.042 0.052 0.068 Mean 0.997 0.997 0.999 0.996 OUTFIT MNSQ SD 0.033 0.051 0.041 0.057 0.122 * p < .05
Estimated standard error of categories
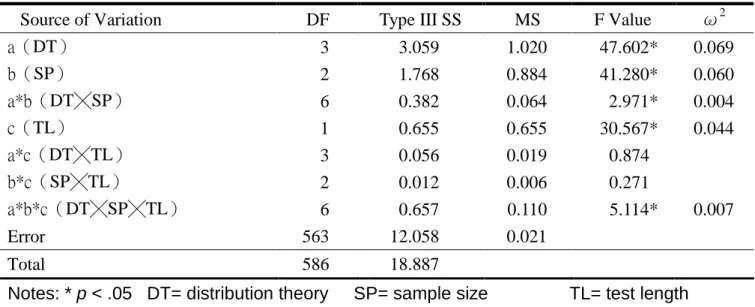
We could know the accuracy of measurement estimation by category estimation standard error, and the following was the result of category estimation standard error by Rasch rating scale model (table 3 ) : (1) the interactions of three-factored ANOVA ,“DT╳SP╳TL”,“DT╳SP” and the mean effect“DT”,“SP”,and “TL”reached significantlevel(p < .05).
(2) The ω square ofdistribution theory was 0.069,and the ω square ofsample size was 0.060,the ω square oftestlength was 0.044,the ω square ofDT╳ SP was 0.004,and the ω square of DT╳ SP╳TL was 0.007.Keppel(1991)pointed “in the behaviorscience field,itwas large when the ω square was 0.15,and medium whenω square was 0.06,and smallwhen the ω square was 0.01.”Therefore for effect size, distribution theory and sample size belonged to medium effectsize,and testlength belonged to smalleffectsize.“DT╳ SP”and “DT╳
SP╳TL”allbelonged to smalleffectsize.
(3) For the post hoc comparison ofsource ofvariation ofmedium effectsize,by Scheffe’ test“distribution theory”we found: (A) The estimated standard error of category estimation under Normal was 0.243 which was larger than 0.113 under Binomial, 0.081 under Uniform and 0.050 under Logistic. (B) The estimated standard error of category estimation under Binomial which was larger than 0.050 under Logistic. Therefore the estimated standard error of category estimation under Normal was larger than the others obviously, and it was the smallest under Logistic, That meant the accuracy of category estimation was worse under Normal but better under Logistic.
test was: (A) Under small sample size the standard error of category estimation was 0.192 which was bigger than 0.106 under median sample size. (B) Under median sample size the standard error of category estimation was 0.106 which was bigger than 0.063 under large sample size. Therefore the standard error of category estimation was affected by sample size. The bigger the sample size was, the smaller the standard error of category estimation was.
(5) The result of“testlength”of effect size small in post hoc comparison by Scheffe’test was: the standard error of category estimation under short form was 0.153 which was bigger than 0.086 under long form, and it showed that the standard error of category estimation was affected by test length. When test length increased, the standard error of category estimation became smaller.
(6) The effect size of“DT ╳SP”and “DT ╳SP TL”╳ were tiny, so it was meaningless to discuss further even with test significant.
Table 3 Summary of 3W ANOVA for estimated standard error in simulation data
Source of Variation DF Type III SS MS F Value ω2
a(DT) 3 3.059 1.020 47.602* 0.069 b(SP) 2 1.768 0.884 41.280* 0.060 a*b(DT╳SP) 6 0.382 0.064 2.971* 0.004 c(TL) 1 0.655 0.655 30.567* 0.044 a*c(DT╳TL) 3 0.056 0.019 0.874 b*c(SP╳TL) 2 0.012 0.006 0.271 a*b*c(DT╳SP╳TL) 6 0.657 0.110 5.114* 0.007 Error 563 12.058 0.021 Total 586 18.887
Notes: * p < .05 DT= distribution theory SP= sample size TL= test length
Step difficulties
Based on propercategory criterion by Linacre (2002):“Guideline 7:Step difficulties advance by atleast1.4 logits.”According to theproper criterion, we had to test the step difficulty of simulation data produced from 4 kinds of distribution theories whether the step difficulty was atthe range from 1.4 to 5.0 logitby one sample ttest,μ=1.4.(table 4)
Table 4 Summary of one sample t-test(μ=1.4)forestimated step difficulty
Distribution N Mean S D S Err t Value
Normal 107 2.455 0.458 0.044 23.808*
Logistic 120 1.060 0.546 0.050 -6.808*
Binomial 120 0.874 0.230 0.021 -24.938*
Uniform 120 0.026 0.134 0.012 -111.739*
* p < .05
which is bigger than 1.4 obviously, and the mean of Logistic, Binomial, and Uniform are 1.06, 0.87,and 0.03 which are all smaller than 1.4, normal distribution fit these two criterions only. Then we checked whether each observation value fit these two criterions or not. For the evaluation of the optimizing step difficulty, we obtained such a result for the frequency and percentage of optimizing step difficulty in simulation data. (table 5)
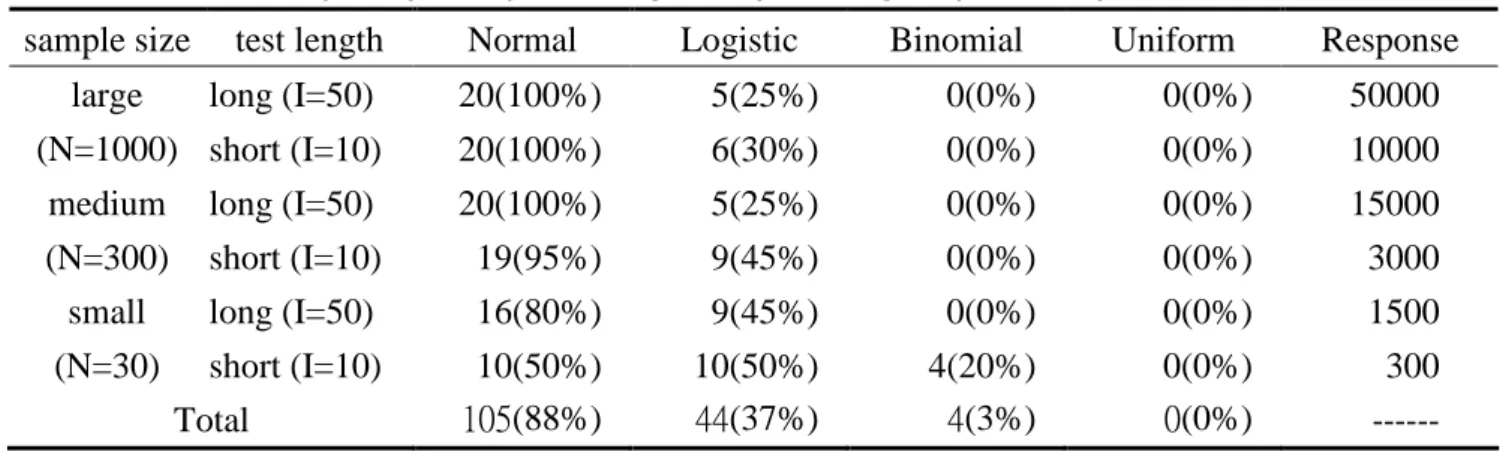
Table 5 The frequency and percentage of optimizing step difficulty in simulation data sample size test length Normal Logistic Binomial Uniform Response
long (I=50) 20(100%) 5(25%) 0(0%) 0(0%) 50000 large (N=1000) short (I=10) 20(100%) 6(30%) 0(0%) 0(0%) 10000 long (I=50) 20(100%) 5(25%) 0(0%) 0(0%) 15000 medium (N=300) short (I=10) 19(95%) 9(45%) 0(0%) 0(0%) 3000 long (I=50) 16(80%) 9(45%) 0(0%) 0(0%) 1500 small (N=30) short (I=10) 10(50%) 10(50%) 4(20%) 0(0%) 300 Total 105(88%) 44(37%) 4(3%) 0(0%) ---Comprehensively, the step difficulty of Normal distribution simulation data fit model best. Decreasingly, there were 105, 44, 4, 0 observations in optimizing step difficulty for Normal, Logistic, Binomial, Uniform whose percentages were 88%, 37%, 3%, 0%. By there results we found: (1) Normal distribution was in best optimizing step difficulty when large or median sample sizes, but it became worse when small sample size. (2) Logistic distribution differed from Normal distribution, which optimizing step difficulty became increasing when small sample size. (3) The optimizing step difficulty of binomial distribution reached 20% only when small sample size and short form. (4) There was no optimizing step difficulty for uniform distribution, which this distribution did not fit Rasch measurement model.
Category Frequencies
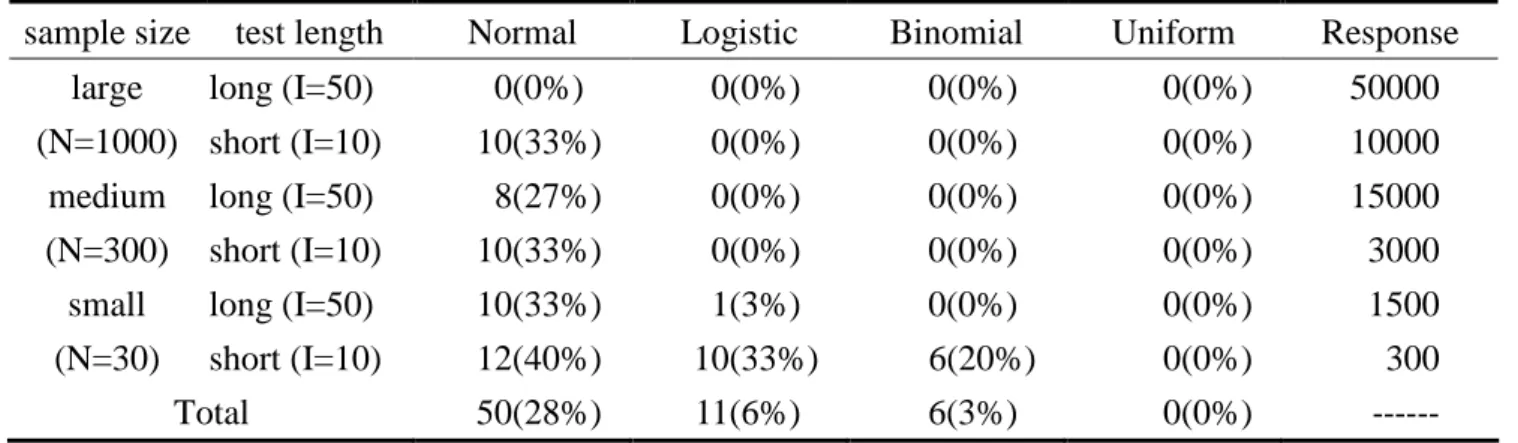
Table 6 Summary of the number of categories for less than 10
sample size test length Normal Logistic Binomial Uniform Response long (I=50) 0(0%) 0(0%) 0(0%) 0(0%) 50000 large (N=1000) short (I=10) 10(33%) 0(0%) 0(0%) 0(0%) 10000 long (I=50) 8(27%) 0(0%) 0(0%) 0(0%) 15000 medium (N=300) short (I=10) 10(33%) 0(0%) 0(0%) 0(0%) 3000 long (I=50) 10(33%) 1(3%) 0(0%) 0(0%) 1500 small (N=30) short (I=10) 12(40%) 10(33%) 6(20%) 0(0%) 300 Total 50(28%) 11(6%) 6(3%) 0(0%) ---For distribution theory: (1) ---For Normal, there were 50 categories (28%) whose amount of data was less than 10, which only large sample size and long form fit the guideline 1 called by Linacre. (2) For Logistic, there were 11 categories (6%) whose amount of data was less than 10, which happened to small sample size. (3) For Binomial, there were 6 categories (3%) whose amount of data was less than 10, which happened to small sample size and short form. (4) For Uniform, there was no category whose amount of data was less than 10. Therefore, For Normal, there were over one-forth categories dissatisfying Linacre guideline 1, which was the worst situation. For Logistic and Binomial, they dissatisfied Linacre guideline 1 only when small sample size, which were better than Normal. Only for Uniform, it satisfied Linacre guideline 1 totally.
Table 7 Summary of the frequency and percentage for missing category
sample size test length Normal Logistic Binomial Uniform Response long (I=50) 0(0%) 0(0%) 0(0%) 0(0%) 50000 large (N=1000) short (I=10) 0(0%) 0(0%) 0(0%) 0(0%) 10000 long (I=50) 0(0%) 0(0%) 0(0%) 0(0%) 15000 medium (N=300) short (I=10) 0(0%) 0(0%) 0(0%) 0(0%) 3000 long (I=50) 3(10%) 0(0%) 0(0%) 0(0%) 1500 small (N=30) short (I=10) 10(33%) 0(0%) 0(0%) 0(0%) 300 Total 13(7%) 0(0%) 0(0%) 0(0%) ---Then, we analyzed the amount of estimation category missing for each distribution theory, and the following was the result (table 7): (1) For Normal, there were 3 categories missing (10%) at small sample size and long form, and 10 categories missing (33%) at small sample size and short form. (2) For Logistic, Binomial and Uniform, there was no category missing. Therefore based on sample size, when amount of response was 1500, normal distribution had category missing and decreasing, which was a defect, but the others had no category missing.
The frequency of steps calibration disorder
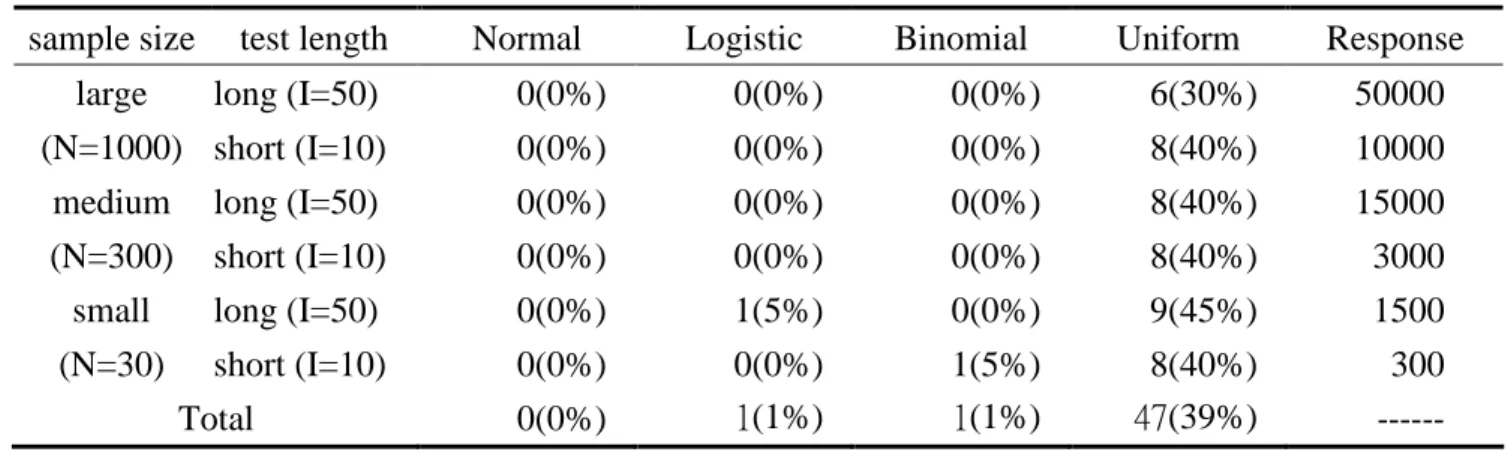
calibration disorder of simulation data for 4 distribution theories. The results were in table 8: (1) Step calibration disorder did not happen to normal distribution, but both logistic and binomial distributions had 1 step calibration disorder only, and uniform distributions had 47 step calibration disorder. (2) Step calibration disorder was happened to logistic and binomial distributions under small sample size (amount of responses was under 3000). (3) For uniform distribution, step calibration disorder was happened under both sample size and test length combination, which the percentage of disorder accounts were from 30% to 45%. Therefore, for the “step calibration disorder”ofdata estimation,normaldistribution fit Rasch model. And for both logistic and binomial distributions, step calibration disorder was happened only under small sample size, but uniform distribution did not fit Rasch model.
Table 8 Summary of the frequency and percentage for steps calibration disorder
sample size test length Normal Logistic Binomial Uniform Response long (I=50) 0(0%) 0(0%) 0(0%) 6(30%) 50000 large (N=1000) short (I=10) 0(0%) 0(0%) 0(0%) 8(40%) 10000 long (I=50) 0(0%) 0(0%) 0(0%) 8(40%) 15000 medium (N=300) short (I=10) 0(0%) 0(0%) 0(0%) 8(40%) 3000 long (I=50) 0(0%) 1(5%) 0(0%) 9(45%) 1500 small (N=30) short (I=10) 0(0%) 0(0%) 1(5%) 8(40%) 300 Total 0(0%) 1(1%) 1(1%) 47(39%)
---Discussion
This study simulated data produced by normal distribution, logistic distribution, binomial distribution and uniform distribution, and evaluated the best theoretical distribution of Rasch rating scale model category judged from the proper category criterion, Linacre (2002).
First, the result of category fit statistics: categories all fit Rasch model for 4 distribution theories, and the fit of category estimation was well, which had measurement validity inference. Secondly, we compared the category estimation standard error for each distribution theory and results showed: (1) The accuracy of category estimation was worse under normal distribution, but better under logistic distribution. (2) Sample size affected the standard error of category estimation. The bigger the sample size is, the smaller the standard error of category estimation is. (3) Test length affected the standard error of category estimation, as well. The longer the test length is, the smaller the standard error of category estimation is.
The third comparison was for the step difficulty of simulated data estimation for each distribution theory, and the result showed: Normal distribution was under best ideal step difficulty when large and median sample size, but opposite for logistic distribution, the phenomenon of optimizing step difficulty decreased when small sample size. Both binomial and uniform distribution did not fit Rasch measurement model.
The forth analysis was for the amount of missing, and the result showed: Category
distribution theories.
The fifth analysis was for the step calibration disorder, and the results showed that normal distribution fit Rasch model, and the step calibration disorder was happened to both logistic and binomial distributions under small sample size, but uniform distribution did not fit Rasch model.
The results were: (1) Normal distribution was the ideal distribution when sample size was over 3000 in response data. (2) Logistic distribution was the better distribution when sample size was less than 1500 in response data. The conclusion of the study was that optimizing distribution of rating scale category in Rasch model was related to sample size.
This study (NSC 99 - 2410 - H - 179 - 009) was sponsored by The National Security Council, R.O.C. (Taiwan).
References
Andrich, D. (1996). Category Ordering and their Utility. Rasch Measurement Transactions, 9(4), 464-465.
Bond, T. G., & Fox, C. M. (2007). Applying The Rasch Model: Fundamental Measurement in the Human Sciences(2nd). Mahwah, NJ: Lawrence Erlbaum Associates.
Chen, W. C. (2008). A construction of forehand driving test for first level athletes in Table Tennis. Unpublished doctoral dissertation, National Taiwan Sport University(Taoyuan), Graduate Institute of Sports Training Science, Taoyuan.
Chou, S. I. & Yau, H. D. (2006). An Evaluation of the Assessing the Development Level of the Standing Long Jump Observation Checklist. Paper presented at the 2nd Pacific Rim Objective
Measurement Symposium, PROMS HK 2006, Hong Kong Institute of Education, Hong Kong. 27-29, June.
Ho, R. G., & Yau, H. D. (1997). The relationship between Binomial, Normal and Poisson distribution in the psychomotor test. Psychological Testing, 44(1), 95-102.
Keppel, G.. (1991). Design and analysis:A researcher’shandbook(3rd ed.). Englewood Cliffs, NJ: Prentice Hall.
Linacre, J. M. (1991). Step Disordering and Rasch Thurstone Thresholds. Rasch Measurement Transactions, 5(3), 171.
Linacre J .M. (2001). Category, Step and Threshold: Definitions & Disordering. Rasch Measurement Transactions, 15(1), 794.
Linacre, J. M. (2002). Understanding Rasch Measurement: Optimizing Rating Scale Category Effectiveness. The Journal of Applied Measurement, 3(1), 85-106.
Linacre, J. M. (2010). Transitional Categories and Usefully Disordered Thresholds. Online Educational Research Journal, 1. Retrieved March 28, 2011, from http://
www.oerj.org/View?action=viewPDF&paper=2
300-311.
Pesudovs, K., Gothwal, V. K., Wright, T., & Lamoureux, E. L. (2010). Remediating serious flaws in the National Eye Institute Visual Function Questionnaire. Journal Cataract Refract Surg, 36, 718–732. Rasch, G. (1960/80). Probabilistic models for some intelligence and attainment tests. (Copenhagen,
Danish Institute for Educational Research). Expanded edition (1980) with foreword and afterword by B.D. Wright, (1980). Chicago: The University of Chicago Press.
Siegert, R. J., Jackson, D. M., Tennant, A., & Turner-Stokes, L. (2010). Factor analysis and Rasch analysis of the Zarit Burden Interview for acquired brain injury carer research. Journal Rehabilitation Medicine, 42, 302–309.
Shaw, F., Wright, B., & Linacre, J. M. (1992). Disordered Steps? Rasch Measurement Transactions, 6(2), 225.
Stone, M. H., & Wright, B. D. (1994). Maximizing rating scale information. Rasch Measurement Transactions, 8, 386.
Tennant, A. (2004). Disordered Thresholds: An example from the Functional Independence Measure, Rasch Measurement Transactions, 17(4), 945-948.
Van Lente, E., Karabatsos, G., & Uekawa, K. (2010). A bootstrap approach to rating scale optimization. In W.P.F. Fisher & M. Wilson, (Eds.), Access to the Foundations of Measurement: Professional Identity in the Career of Benjamin D. Wright (forthcoming). Retrieved April 1, 2011, from http://www.ucc.ie/en/npec/Staff/ericvanlente/
Yau, H. D. (2010). A study of reasonable categories setting approach in sport skill testing: An example of Multiple-Attempt Single-Item tests. Research Project Report of National Science Council (NSC 98 - 2410 - H - 179 - 004).
Yau, H. D., Chi, S. C., Chou, S. I., & Yao, W. C. (2008). A revision of the assessing developmental level of the standing long jump. Journal of National Taiwan Sports University, 19(1), 35-48. (NSC 95-2413-H-179 -011 )
Zhu, W., Updyke, W. F., & Lewandowski, C. (1997). Post-Hoc Rasch analysis of optimal categorization of an ordered-response scale. Journal of Outcome Measurement, 1(4), 286-304.
Zhu, W., & Kang, S. J. (1998). Cross-cultural stability of the optimal categorization of a self-efficacy scale: A Rasch analysis. Measurement in Physical Education and Exercise Science, 2, 225-241. Zhu, W., Timm, G., & Ainsworth, B. (2001). Rasch calibration and optimal categorization of an
instrumentmeasuring women’sexerciseperseveranceand barriers.Research Quarterly for Exercise and Sport, 72, 104-116.