• 沒有找到結果。

Falsely Low Hemoglobin A1c Values in Diabetic Patients Receiving Peginterferon-alpha and Ribavirin for Chronic Hepatitis C

N/A
N/A
Protected

Academic year: 2021

Share "Falsely Low Hemoglobin A1c Values in Diabetic Patients Receiving Peginterferon-alpha and Ribavirin for Chronic Hepatitis C"

Copied!
7
0
0

加載中.... (立即查看全文)

全文

(1)

Falsely Low Hemoglobin A1c Values in Diabetic Patients Receiving Peginterferon-alpha and

Ribavirin for Chronic Hepatitis C

Yen-Kuang Tai

1

, Chiu-Ling Huang

1

, Chih-Ming Chien

1

, Ching-Yang Tsai

2

, and Hoi-Wan Lo

2

1

Division of Endocrinology and Metabolism, Department of Internal Medicine;

2

Division of Gastroenterology, Department of Internal Medicine, Yuan's General Hospital, Kaohsiung, Taiwan

Abstract

Hemoglobin A1c (A1C) values are usually lower during hemolysis because of the shortened red cell survival. Ribavirin (RBV) used in combination with peginterferon-alpha (peg-IFN) for chronic hepatitis C virus (HCV) infection causes reversible hemolytic anemia. This study was aimed to examine the effect of RBV treatment on A1C values in diabetic patients. A retrospective analysis identified 27 type 2 diabetic patients receiving peg-IFN and RBV for HCV. Each subject had at least three measures of hemoglobin (Hb), A1C, fasting plasma glucose, GPT and total bilirubin: before, during and after HCV therapy. During therapy, Hb levels decreased from 14.0 g/dL at baseline to a nadir of 10.2 g/dL (p < 0.001). A1C values decreased from a pre-treatment level of 7.1% to the lowest on-treatment level of 6.1% [mean paired difference: -1.0%; 95%

confidence interval (CI) -1.93 to -0.11; p = 0.023]. In contrast, matched fasting plasma glucose levels did not change significantly (mean paired difference: -4.4 mg/dL; 95% CI -26.9 to 18.2; p = 0.89). In addition, GPT decreased from a pre-treatment level of 129 U/L to an on-treatment level of 64 U/L (p < 0.001);

simultaneously measured total bilirubin increased from 0.82 mg/dL to 1.08 mg/dL (p = 0.016) supporting the occurrence of hemolysis. In conclusion, HCV therapy with peg-IFN plus RBV caused a significant fall in A1C values without a change to fasting plasma glucose levels in diabetic patients. The mean reductions of A1C values by 1.0% might be mostly caused by RBV-induced hemolysis. Falsely low A1C values may lead the clinicians to relax glycemic control inappropriately. Therefore, A1C should not be used to guide diabetes therapy during HCV treatment with RBV. (J Intern Med Taiwan 2011; 22: 431-437)

Key words: Hemoglobin A1c, Diabetes mellitus, Chronic hepatitis C, Ribavirin, Hemolytic anemia

Introduction

In patients with diabetes mellitus (DM), hemoglobin A1c (A1C) test is routinely used to estimate glycemic control over the previous 2-3

months. Recently, A1C is further recommended as one of diagnostic criteria of DM

1,2

. However, there are clearly limitations in the measurement of A1C.

Interfering factor, such as hemolytic anemia, may cause unexpectedly low A1C value because of the

Reprint requests and correspondence:Dr. Yen-Kuang Tai

Address:Division of Endocrinology and Metabolism, Department of Internal Medicine, Yuan’s General Hospital, 162, Cheng-gong 1st Road, Kaohsiung 80211, Taiwan

(2)

shorter exposure of hemoglobin (Hb) to plasma glucose

3

.

In addition to chronic hepatitis B virus infection, Taiwan is also a hyperendemic area of chronic hepatitis C virus (HCV) infection

4

. According to a large-scale survey, the prevalence of HCV infection was 4.4% in Taiwan

5

. There is growing evidence suggesting the mutual link between type 2 DM and HCV infection. The prevalence of DM had been reported in 18%

to 36% of patients with HCV infection, which was significantly higher than that in the general population

6-9

. However, the impact of HCV therapy on the measurement of A1C has rarely been investigated. Oral ribavirin (RBV) plus peginterferon-alpha (peg-IFN) is the current standard therapy for chronic HCV infection.

Ribavirin alone has been shown to induce a dose-dependent, reversible hemolytic anemia

10,11

. This anemia would be more pronounced with combination of IFN and RBV, because the myelosuppressive effect of IFN inhibits the bone marrow to compensate for RBV-induced hemolysis

12

. In addition, the reimbursement criteria for HCV therapy has been loosened since November 2009 in Taiwan. There are more patients eligible for free treatment of HCV. In selected cases, the treatment duration can be extended up to 48 weeks. Diabetic patients on peg-IFN plus RBV therapy would be more commonly encountered in our daily clinical practice. It is unknown as to what extent RBV-induced hemolysis affects the A1C values in Taiwanese patients with diabetes. Hence, we try to conduct this study and investigate the reality of A1C values in diabetic patients under the treatment for HCV.

Materials and Methods

We retrospectively reviewed the medical records of 256 subjects receiving peg-IFN and RBV for HCV between January 2007 and February

2010. This study was approved by the Institutional Review Board of Yuan's General Hospital. A diagnosis of diabetes was confirmed based on the American Diabetes Association (ADA) criteria

1

. Subjects were included in this analysis if HCV therapy lasted for a minimum of 12 weeks and included oral RBV given in combination with peg-IFN. In addition, subjects should have at least three measures of A1C, fasting plasma glucose, Hb, GPT and total bilirubin: before, during and after HCV therapy.

The A1C values were chosen at the following time points: the most recent one prior to HCV therapy (pre-treatment), at least 12 weeks after initiating therapy (on-treatment), and a minimum of 12 weeks after the end of therapy (post-treatment).

When more than one A1C value was identified between week 12 and the end of treatment, the lowest one was selected for analysis. To assess the matched mean glucose level to each A1C value, the fasting plasma glucose levels measured within 12 weeks before the pre-treatment and post-treatment A1C tests were collected; the fasting plasma glucose levels measured between 2 weeks before and after the on-treatment A1C test were obtained.

In addition, Hb, GPT and total bilirubin values were collected at the same time interval. Similarly, the lowest Hb value during HCV treatment was selected for analysis. Simultaneously measured GPT and total bilirubin were chosen on the same day with Hb measurement. Demographic data, baseline weight, anti-diabetic regimens, dose of peg-IFN and RBV, and duration of HCV therapy were also recorded.

Fasting plasma glucose, serum GPT and

total bilirubin were measured using an automatic

biochemistry analyzer (Beckman Coulter AU

2700; Mishima, Japan). Complete blood cell count

was measured using Beckman Coulter LH 750

(Miami, FL, U.S.A). A1C value was determined

by ion-exchange high-performance liquid

chromatography (HPLC) using HLC-723 G8 (Tosoh

(3)

corp., Tokyo, Japan).

Changes in A1C, fasting plasma glucose, Hb, GPT and total bilirubin levels were analysed using repeated-measures analysis of variance (ANOVA).

A comparison of these variables between two time points was tested for significance using paired t-test with Bonferroni adjustment for multiple testing.

A correlation between changes in A1C and Hb levels or baseline characteristics were measured using Pearson correlation test. All analyses were performed using SPSS for Windows (SPSS Inc., Version 14.0, Chicago, IL, USA).

Results

A total of 27 subjects with type 2 diabetes were included for this analysis. The baseline characteristics and therapeutic regimen for HCV are displayed in Table 1.

Following HCV therapy, the on-treatment Hb nadir occurred at a median of 16 weeks; the lowest on-treatment A1C values were obtained at a median of 19 weeks. As shown in Table 2, anemia defined as Hb < 10 g/dL occurred in one third of subjects;

low A1C value defined as less than 5% was noted in

Table 1. Baseline characteristics and therapeutic regimen for HCV

Variables N = 27

Age, years (mean ± SD) 56.6 ± 9.3

Sex, male [n (%)] 14 (51.9)

Weight, kg

*

[median (range)] 70 (44-99)

Diabetes treatment [n (%)]

Diet 5 (18.5)

OAD 21 (77.8)

Insulin 1 (3.7)

Dose of peginterferon [n (%)]

2a (180 mcg/wk) 8 (29.6)

2b (80 mcg/wk) 19 (70.4)

Daily ribavirin dose, mg/d

*

[median (range)] 800 (800-1200)

Daily weight-based ribavirin dose, mg/kg/d

*

[median (range)] 14 (9.4-22.7)

Duration of HCV treatment, weeks

*

[median (range)] 24 (14-48)

HCV, hepatitis C virus; SD, standard deviation; OAD, oral antidiabetic drug.

*

Variables are not normally distributed and are displayed at median (minimum- maximum) values.

Table 2. Changes in Hb and A1C after HCV therapy (N = 27)

Variables n (%)

Maximum Hb decline ≧ 3 g/dL 20 (74.1)

On-Rx Hb nadir < 10 g/dL 9 (33.3)

Maximum A1C decline ≧ 2 % 5 (18.5)

On-Rx A1C nadir < 5% 4 (14.8)

Pre-Rx A1C < 6.5% 10 (37.0)

On-Rx A1C nadir < 6.5% 18 (66.7)

Hb, hemoglobin; A1C, hemoglobin A1c; HCV, hepatitis C virus; Rx, treatment.

(4)

four subjects.

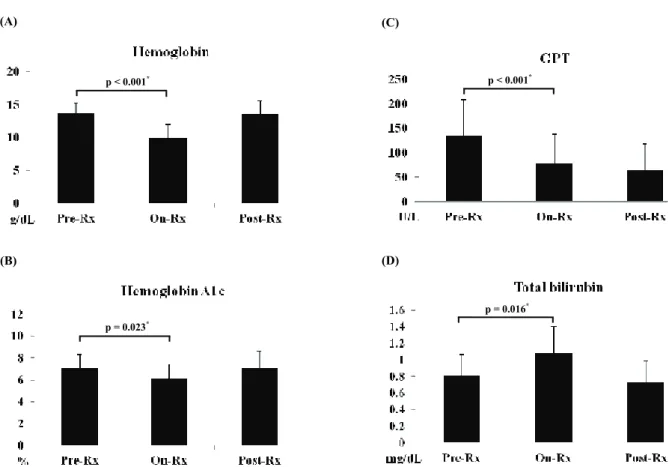
During peg-IFN plus RBV therapy, mean Hb levels decreased from 14.0 g/dL at baseline to a nadir of 10.2 g/dL [95% confidence interval (CI) -5.06 to -2.56; p < 0.001] (Fig.1A). A1C values decreased from a pre-treatment level of 7.1%

to the lowest on-treatment level of 6.1% with a mean difference of -1.0% (95% CI -1.93 to -0.11;

p = 0.023) (Fig. 1B). In contrast, matched fasting plasma glucose levels did not change significantly following HCV therapy with a mean difference of -4.4 mg/dL (95% CI -26.9 to 18.2; p = 0.89) (Figure 2). In addition, GPT decreased from a mean pre-treatment level of 129 U/L to an on-treatment level of 64 U/L (p < 0.001); mean total bilirubin increased from 0.82 mg/dL to 1.08 mg/dL (p = 0.016) (Fig.1C and 1D).

Following HCV therapy, the change in A1C values was not correlated either to the decline in Hb levels (r = 0.249, p = 0.210) or other baseline variables, such as pretreatment A1C (r = 0.304, p = 0.123) and Hb levels (r = -0.084, p = 0.679), weight (r

= -0.044, p = 0.851), daily RBV dose (r = -0.124, p = 0.537), and duration of therapy (r = 0.106, p = 0.599).

Fig 1. Hemoglobin (A), hemoglobin A1c (B), GPT (C) and total bilirubin (D) before, during, and after hepatitis C therapy.

Rx, treatment. p < 0.001 in panel A, C and D; p = 0.007 in panel B with repeated-measures ANOVA. Comparisons by paired t-test (*) with Bonferroni adjustment for multiple testing.

18 (A)

p < 0.001*

Fig 2. Fasting plasma glucose before, during, and after hepatitis C therapy. Rx, treatment. p = 0.866 with repeated-measures ANOVA. A comparison by paired t-test (*) with Bonferroni adjustment for multiple testing.

22 p = 0.89*

19 (B)

p = 0.023*

20 (C)

p < 0.001*

21 (D)

p = 0.016*

19 (B)

p = 0.023*

19 (B)

p = 0.023*

(5)

Discussion

The A1C test is subject to certain limitations.

Any condition that shortens erythrocyte survival or decreases mean erythrocyte age will falsely lower A1C test results regardless of the assay method used

3

. A 1982 study by Panzer et al. found a strong linear correlation between A1C values and red blood cell survival (r

2

= 0.88, p < 0.001) in non-diabetic patients with autoimmune-induced hemolytic anemia. They established the usefulness of A1C as a screening test for hemolysis in patients without diabetes

13

. Thereafter, discordant results between A1C and blood glucose levels have been reported in diabetic patients with hemolysis of various etiologies, such as malaria

14

, autoimmune hemolytic anemia

15

and hereditary spherocytosis

16,17

. More recently, Gross et al. reported a 59-year-old man with diabetes whose A1C became falsely low following HCV treatment with RBV and peg-IFN.

After medication was discontinued, the patient’s A1C returned to its baseline value

18

.

Anemia is extremely common among patients receiving peg-IFN plus RBV for HCV.

Treatment-associated anemia is mainly attributed to RBV-induced hemolysis

9

. RBV is concentrated within erythrocytes and results in a relative deficiency of adenosine triphosphate (ATP) and hence increases susceptibility to oxidative damage and extravascular hemolysis. During HCV therapy, our study demonstrated a maximal decline in Hb of 3.8 g/dL, which was similar to previous report (3.7 g/dL)

19

. Our retrospective study led us to adopt total bilirubin level as an indicator of hemolysis. In order to exclude hepatitis-related hyperbilirubinemia, we used simultaneously measured GPT levels as a control for comparison. A significant increase in total bilirubin accompanied by a decrease in GPT was seen at the time point of Hb nadir. After the end of HCV therapy, total bilirubin returned to its baseline level, which was in agreement with the

occurrence of reversible hemolysis.

In our study, the A1C following HCV therapy declined significantly and then returned to its baseline value. In contrast, the fasting plasma glucose levels did not change throughout the whole study period. Hence, the A1C decline might be explained by concurrent RBV-induced hemolysis. Greenberg et al. had conducted a similar retrospective analysis in diabetic subjects receiving IFN plus RBV therapy for a median of 47 weeks

20

. The weight-based RBV dose in their study was 13.2 mg/kg/d, which was similar to ours (13.8 mg/

kg/d). Their study revealed a significant decline in A1C values of 2.0%, but matched random glucose levels decreased significantly by a mean of 38.4 mg/dL after HCV therapy. They concluded that RBV-induced hemolysis contributed to the A1C change by 0.93%, which result was similar to ours with a change of 1.0%.

This study had important clinical implications.

In real-world practice, a clinician may ignore the co-morbidity of his patients treated by another clinician. For example, a diabetologist may not recognize that his diabetic patient is receiving HCV therapy from a hepatologist. Hence, the clinician would not notice the possible interaction between the two conditions. Furthermore, perhaps more important, most clinicians may not realize the impact of HCV therapy on A1C. However, with few glucose data available in clinical practice, clinicians usually made decision or adjusted diabetes therapy based on A1C value. In our study, four subjects had the lowest A1C values less than 5%. If the clinicians were not aware of the influence of HCV therapy on A1C, the unusually low A1C values might lead most clinicians to reduce anti-diabetic medication.

In such situation, frequent measurements of blood

glucose is the preferred tool to evaluate overall

glycemic control. Though other alternative method

such as fructosamine level could be used instead,

inadequate evidence of predicting the risk for

(6)

diabetic complication and shorter lifespan have limited its use

21

.

In conclusion, HCV therapy with peg-IFN plus RBV caused a significant fall in A1C values without a change to fasting glucose levels in patients with diabetes. The mean reductions in A1C values of 1.0% might be mostly caused by RBV-induced hemolysis. Falsely low A1C values would lead to inappropriate relaxation of glycemic control. Therefore, A1C should not be used to guide diabetes therapy during HCV treatment with RBV. At the present time, regular capillary glucose measurements remain the best alternative assessment of glycemic control in this patient group.

References

1. American Diabetes Association. Standards of medical care in diabetes-2011. Diabetes Care 2011; 34: S11-61.

2. International Expert Committee. International expert committee report on the role of the A1C assay in the diagnosis of diabetes. Diabetes Care 2009; 32: 1327-34.

3. National Glycohemoglobin Standardization Program (NGSP). Factors that interfere with HbA1c test results. http://

www.ngsp.org/factors.asp (accessed in August 2011) 4. Sievert W, Altraif I, Razavi HA, et al. A systematic review of

hepatitis C virus epidemiology in Asia, Australia and Egypt.

Liver Int 2011; 31: 61-80.

5. Chen CH, Yang PM, Huang GT, et al. Estimation of seroprevalence of hepatitis B virus and hepatitis C virus in Taiwan from a large-scale survey of free hepatitis screening participants. J Formos Med Assoc 2007; 106: 148-55.

6. Caronia S, Taylor K, Pagliaro L, et al. Further evidence for an association between non-insulin-dependent diabetes mellitus and chronic hepatitis C virus infection. Hepatology 1999; 30: 1059-63.

7. Chen LK, Hwang SJ, Tsai ST, et al. Glucose intolerance in Chinese patients with chronic hepatitis C. World J Gastroenterol 2003; 9: 505-8.

8. Huang JF, Dai CY, Hwang SJ, et al. Hepatitis C viremia increases the association with type 2 diabetes mellitus in a hepatitis B and C endemic area: an epidemiological link with virological implication. Am J Gastroenterol 2007; 102:

1237-43.

9. Hung CH, Wang JH, Hu TH, et al. Insulin resistance is associated with hepatocellular carcinoma in chronic hepatitis C infection. World J Gastroenterol 2010; 16: 2265-71.

10. Dusheiko G, Main J, Thomas H, et al. Ribavirin treatment for patients with chronic hepatitis C: results of a placebo- controlled study. J Hepatol 1996; 25: 591-8.

11. De Franceschi L, Fattovich G, Turrini F, et al. Hemolytic anemia induced by ribavirin therapy in patients with chronic hepatitis C virus infection: role of membrane oxidative damage. Hepatology 2000; 31: 997-1004.

12. Poynard T, Marcellin P, Lee SS, et al. Randomized trial of interferon alpha2b plus ribavirin for 48 weeks or for 24 weeks vs interferon alpha2B plus placebo for 48 weeks for treatment of chronic infection with hepatitis C virus;

International hepatitis International Therapy Group (IHIT).

Lancet 1998; 352: 1426-32.

13. Panzer S, Kronik G, Lechner K, et al. Glycosylated hemoglobins (GHb): An index of red cell survival. Blood 1982; 59: 1348-50.

14. Eberentz-Lhomme C, Ducrocq R, Intrator S, et al. Haemo- globinopathies, malaria, and other interferences with HBA1 assessment. Diabetes Metab 1984;10: 304-10.

15. Wiener K. A falling HbA1c is not necessarily an indicator of improveing diabetes control. Ann Clin Biochem 2001; 38:

406-7.

16. Liew CF, Cheah JS. Hereditary spherocytosis, a pitfall in the assessment of glycemic control. Singapore Med J 2003; 44:

94-7.

17. Arnold JG, McGowan HJ. Delay in diagnosis of diabetes mellitus due to inaccurate use of hemoglobin A1C levels. J Am Board Fam Med 2007; 20: 93-6.

18. Gross BN, Cross LB, Foard JC, et al. Falsely low hemoglobin A1C levels in a patient receiving ribavirin and peginterferon alfa-2b for hepatitis C. Pharmacotherapy 2009;

29: 121-3.

19. Fried MW, Shiffman ML, Reddy KR, et al. Peginterferon- alfa-2a plus ribavirin for chronic hepatitis C virus infection.

N Engl J Med 2002; 347: 975-82.

20. Greenberg PD, Rosman AS, Eldeiry LS, et al. Decline in hemoglobin A1c values in diabetic patients receiving interferon-alpha and ribavirin for chronic hepatitis C. J Viral Hepat 2006; 13: 613-7.

21. Lindsey CC, Carter AW, Mangum S, et al. A prospective,

randomized, multicentered controlled trial to compare the

annual glycemic and quality outcomes of patients with

diabetes mellitus monitored with weekly fructosamine

testing vs usual care. Diabetes Technol Ther 2004; 6: 370-7.

(7)

以長效型干擾素( peginterferon-alpha)及 雷巴威林( ribavirin)治療慢性 C 型肝炎造成

糖尿病患假性偏低的糖化血色素值

戴研光

1

  黃秋玲

1

  簡誌銘

1

  蔡青陽

2

  羅海韻

2

阮綜合醫療社團法人阮綜合醫院 

1

新陳代謝暨內分泌科 

2

消化系內科

摘要

由於紅血球的生命周期變短,溶血性貧血會造成假性偏低的糖化血色素值。目前,長效 型干擾素( peginterferon-alpha)加上抗病毒藥雷巴威林(Ribavirin)是慢性 C 型肝炎的標準治 療,其中的雷巴威林會引起可逆性的溶血性貧血。本研究目的在評估雷巴威林的治療對糖尿 病患糖化血色素值的影響程度。我們採回溯性方法找出 27位接受過長效型干擾素及雷巴威林

治療至少 12週以上的糖尿病患作為研究對象。每位病患必需於治療前,治療中及治療後各有

至少一次的糖化血色素,空腹血糖,血色素,肝功能( GPT)及總膽紅素值。在接受 C 肝治療 期間,平均血色素從治療前的 14.0 g/dL 下降至最低點的10.2 g/dL(p < 0.001)。平均糖化血色 素值從治療前的 7.1% 降低至治療中的6.1%(p = 0.023);反之,對應的空腹血糖值則無顯著的 改變 (p = 0.89)。此外,肝功能(GPT)從治療前的129 U/L 改善至64 U/L(p < 0.001);同時間 的總膽紅素則從 0.82 mg/dL 上升至1.08 mg/dL(p = 0.016),這個結果支持溶血性貧血的診斷。

本研究顯示以長效型干擾素及雷巴威林治療慢性 C 型肝炎並未影響糖尿病患的空腹血糖值,

卻造成糖化血色素值顯著的下降了 1.0%,這可能與雷巴威林治療引起的溶血性貧血有關。假

性偏低的糖化血色素值可能導致臨床醫師鬆懈了對血糖的控制,因此建議,在糖尿病患接受

雷巴威林治療慢性 C 型肝炎期間,不應以糖化血色素值來指引糖尿病的治療。

數據

Table 2. Changes in Hb and A1C after HCV therapy (N = 27)
Fig 1. Hemoglobin (A), hemoglobin A1c (B), GPT (C) and total bilirubin (D) before, during, and after hepatitis C therapy

參考文獻

相關文件

Material and Methods: The databases Scopus, embase, ebsco and PubMed were reviewed from January/2003 to October/2010 with the following keywords: laser therapy, low-level

Diabetic uremic patients undergoing hemodialysis exhibited a higher risk for dental decay and xerostomia Ogunbodede, et al.732005Cross-sectional1 and 265/5425 to

Here we describe a case of mucormycosis of maxillary antrum extending to ethmoidal and frontal sinus and also causing necrosis of left maxilla in an uncontrolled diabetic individual

used a technique with a 1.5–2 cm linear incision of mucosa parallel to the vermillion border and lateral to midline, and the incidence of long-term paraesthesia in 75 patients

pylori in pathogenesis of oral mucosal lesions or ulcerations is still unclear, it seems that patients with oral lesions as leukoplakia and oral lichen planus, and concurrent

The noncalcifying and LC-rich CEOTs occurred only in Asian patients, had a predilection for the anterior and premolar region of the maxilla, had none of calcification foci in the

Efficacy of low-level laser therapy compared to steroid therapy in the treatment of oral lichen planus: A

Radiomorphometric indices can be used to deter- mine the existence of a porous structure in the man- dible on panoramic images of patients who have scleroderma and may have a high