Southwestern Taiwan
Sen Jan1*, Hwung-Hweng Hwung1, Shenn-Yu Chao2 and Jin-Li Yu1
(Manuscript received 3 April 1999, in final form 6 October 1999)
885
A portable electromagnetic current meter was used to measure cur-rents in a coastal lagoon southwest of Taiwan. Shipboard measurements were made at ebb and flood stages during neap and spring tides. To retain as much synopticity as possible, each round of measurement covering most of the lagoon was minimized to less than two hours. Observations revealed a stagnation area for tidal currents inside the lagoon. Tidal streams enter-ing and leaventer-ing the two inlets converge and diverge at this location. Cur-rent speeds in the two inlets range from 30 to 50 cm/s during neap tide and up to 60 cm/s during spring tide. A vertically averaged two-dimensional numerical model was used to simulate tidal currents and possible modula-tions by winds and river runoff. Model results indicate tidal dominance over other forcing. The width difference between northern and southern entrances determines the strength difference between two tidal streams entering and leaving the lagoon. The strength difference then determines the location of the flow stagnation area. The effect of northerly wind stress pushes the flow stagnant area southward during flood but northward dur-ing ebb. The effect of large river runoff (200 m3/s) also modulates the
stag-nation location, which is moved northward during flooding but is hardly displaced during ebbs. The observational and numerical results also sug-gest that the flow stagnation may hinder transport of waterborne materials between northern and southern reaches.
(Key words: Coastal lagoon, Current, Convergence, Divergence)
1. INTRODUCTION
Coastal lagoons are shallow bodies of coastal water shielded from the sea by barriers,
1
Tainan Hydraulics Laboratory, National Cheng Kung University, Taiwan, ROC
2
Horn Point Laboratory, University of Maryland, USA
*
Now at National Center for Ocean Research, Taiwan, ROCABSTRACT
TAO, Vol. 10, No. 4, December 1999
886
except for a few restricted inlets (Phleger, 1969). In normal semi-enclosed basins, tidal flush-ing is expected to be vigorous (see, for example, Lee et al., 1999). For lagoons, tidal flushflush-ing is much reduced by barriers, and freshwater runoff from land can be retained for longer peri-ods. In consequence, lagoons are often highly productive systems for fisheries and aquacul-ture but in the meantime are most susceptible to anthropogenic changes. Understanding the characteristics of lagoons is an important first step in sustaining these coastal ecosystems. Since lagoons vary greatly in size and geometry, each lagoon presents a unique environment which requires a separate study (Postma, 1994). In this light, the only coastal lagoon on the coast of Taiwan needs to be documented.
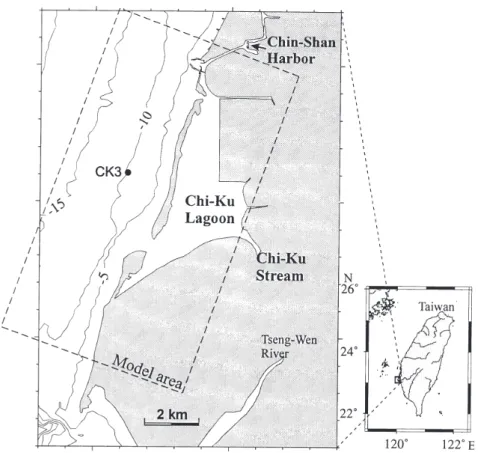
The Chi-Ku lagoon, located on the southwest coast of Taiwan (Fig. 1), is a triangle-shaped shallow water region separated from the sea by a series of shore-parallel barriers. There are two entrances between the barriers. The lagoon is of the restricted type, according to the de-gree of water exchange with the adjacent sea (Kjerfve, 1986). The seaward boundary of the lagoon is about 8.4 km long and the longest distance from the barriers to the landward bound-ary is about 2.8 km, creating an area of about 10 km2. Mean water depths inside the lagoon
Fig. 1. A map showing the location of the Chi-Ku lagoon and isobaths(in meters) in the sea adjacent to the lagoon. The dashed rectangle delineates the model domain.
range from 1 m to 3 m.
Sea-level variations have been measured by Tainan Hydraulics Laboratory (THL) at a tide gauge station in Chin-Shan Harbor (Fig. 1) for more than two years. The harmonic analy-sis indicates the dominance of semidiurnal tides in this area. Amplitudes of major constituents (M2, S2, O1 and K1) are 0.47 m, 0.1 m, 0.18 m and 0.2 m, respectively. The mean tidal range is 1.3 m (Jan and Chiang, 1997). Current measurements at an offshore station CK3 (Fig. 1) indicated that the nearshore flow is dominated by alongshore tidal currents, flowing north-northeastward during flood and south-southwestward during ebb. Tidal current speeds nearshore range from 40 to 80 cm/s. The subtidal mean flow is about 7 cm/s flowing in the NNE direc-tion during June and July, and about 5-10 cm/s flowing in the SSW direcdirec-tion during the north-east monsoon season (THL, 1997). Winds over Chi-Ku area are dominated by the NE mon-soon with mean speeds up to 8-10 m/s from late September to early April. From June to August, the prevailing winds are southwesterly with mean speeds less than 8 m/s (THL, 1997). Drainage from Chi-Ku Stream is typically 5 m3/s but occasionally increases to more than 100
m3/s after heavy rainfall (data provided by Water Resources Planning Commission, Taiwan).
Sediment grain size distribution indicates that the bottom is muddy in the center of north-ern reaches of the lagoon but sandy in areas near tidal entrances. Conceivably, muddiness is normally associated with flow stagnation.
Observed flow fields in the lagoon are reported below. In addition, a vertically averaged two-dimensional model is used to simulate tidal currents and possible modulations by winds and river discharge from Chi-Ku Stream.
2. OBSERVATIONS
On March 18 and 24 of 1997, quick shipboard current measurements of basin-wide flow fields at 1 m below the water surface were conducted using a portable electromagnetic current meter (Alec, ACM-200PC). The current meter measures speeds up to 3 m/s with a precision of 1% of full scale and a resolution of 1 cm/s. The boat was positioned using the Global Position-ing System (GPS) to conduct current measurements. Each survey was carried out in less than two hours to retain quasi-synopticity of flow fields. The two dates correspond to neap and spring periods, respectively. Dominant flood and ebb tidal flow patterns were determined for both periods. During the two measurement periods, winds recorded at Chi-Ku weather station were weaker than 5 m/s.
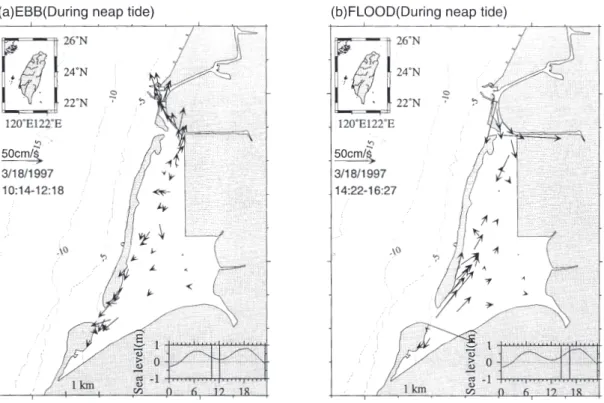
Figure 2 illustrates near-surface currents during ebb and flood tides of a neap period from the first observation. The relative sea-level variations recorded at Chin-Shan Harbor (see Fig. 1) are inserted in the bottom-left corner of each panel in Fig. 2. During the ebb from local time 10:14 to 12:08 [Fig. 2(a)], velocity vectors indicate outgoing tidal streams through both inlets. The currents are likely to diverge from the area near the center of northern half of the lagoon. During the flood stage from 14:22 to 16:27 [Fig. 2(b)], currents are reversed; incoming tidal streams from the two entrances converge at a point which roughly coincides with the diver-gent point during the ebb tide. Currents are nearly stagnant in the convergence/divergence (C/ D) region. The flow speed near two entrances is about 30-50 cm/s in the two tidal phases.
TAO, Vol. 10, No. 4, December 1999
888
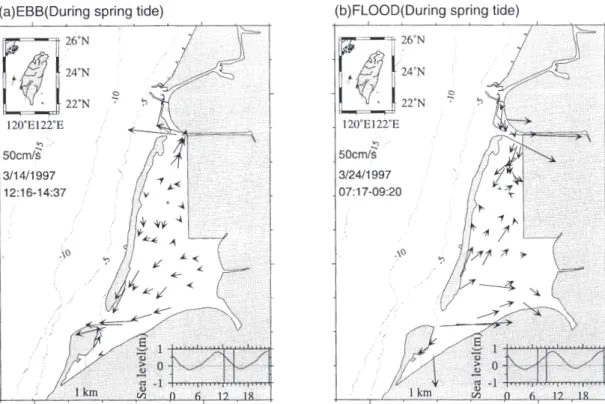
Figure 3 shows observed flow fields during the ebb and flood stages of a spring tide (March 24 of 1997). Tidal circulation patterns in Fig. 3(a) and Fig. 3(b) are similar to, but stronger than, those of the same tidal phase in Fig. 2. Tidal streams near inlets can be greater than 50 cm/s.
From the observations, two distinct tidal current patterns are identified, alternating in a semi-diurnal period. Prevailing flood and ebb flows converge and diverge in a flow stagnation area centered in northern reaches of the lagoon. Tidal current speeds are enhanced in the spring tide, but weakened in the neap tide. The two entrances among shore-parallel sand barriers facilitate water exchanges between lagoon and seawater. Effects of the Chi-Ku Stream runoff and surface wind stress seem minor in comparison with tidal forcing during the two measure-ment periods.
3. MODEL FORMULATION
The numerical model described by Blumberg and Mellor (1987) is adopted below to simu-late currents inside the lagoon. The lagoon basin is sufficiently shallow, justifying the use of a
Fig. 2. Observed surface current vectors at (a) ebb and (b) flood stages during neap tide. Observations were made at 1 m below the surface. The sea level variation shown in the lower right area of each panel was recorded at Chin-Shan harbor and the two vertical lines represent start and end times of the measurement.
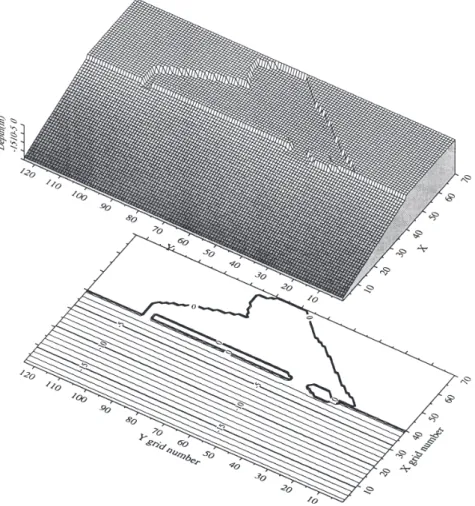
vertically averaged version of this model. The computation domain is bounded by the dashed rectangle in Fig. 1. There are 70 and 124 grids in the landward (x-) and alongshore (y-) direc-tions, respectively. The horizontal grid spacing is 100 m. The sea adjacent to the lagoon is open in the alongshore and seaward directions. Two entrances of 300 m and 600 m wide connect the lagoon and the sea. Unless otherwise stated, the southern entrance is wider. Fig. 4 shows a perspective view of the model basin. To simplify, the lagoon basin is assumed to be flat, having a uniform mean depth of 3 m. Moving seaward, the water depth increases with a constant slope of 1/260.
The model ocean is homogeneous and initially quiescent, and is subsequently driven by tides. Wind forcing and river inflow can also be imposed. Since the major tidal constituent is semidiurnal, sea levels on the southern and northern open boundaries oscillate sinusoidally with a period of 12.42 hours and an amplitude of 0.65 m. The tidal phase difference between southern and northern boundaries is 10 minutes. The sea level on the seaward open boundary is linearly interpolated using values at two end points. Velocities on open boundaries are ex-trapolated from interior values at grid points adjacent to open boundaries. The coefficient of
Fig. 3. Observed surface current vectors at (a) ebb and (b) flood stages during spring tide. The sea level variation shown in the lower right area of each panel was recorded at Chin-Shan harbor and the two vertical lines repre-sent start and end time of the measurement.
TAO, Vol. 10, No. 4, December 1999
890
horizontal eddy viscosity is 5 m2/s. Bottom stress is quadratic with a non-dimensional drag
coefficient of 0.001. To avoid initialization shock, sea-level oscillations are ramped up to the given conditions within the first day of simulation. The model approaches a cyclical equilib-rium after about three days of integration. Model results for the fifth day are discussed below.
4. NUMERICAL RESULTS
Table 1 lists selected experiments to be discussed below. A reference solution is first established in case A, in which only tidal forcing is imposed. Model sensitivity to the relative width of two entrances is examined in case B, in which the widths of southern and northern entrances are interchanged. The cross-section area of the southern entrance relative to that of northern entrance is referred to as S/N ratio in Table 1 and thereafter. In case W, the reference
Fig. 4. A perspective view of the bottom topography and isobaths in the model basin.
solution in case A is further perturbed by a constant northerly wind stress of 1 dyne/cm2
typi-cally encountered in March. Case R is similar to case A except a volumetric influx of 200 m3/
s is imposed at the mouth of Chi-Ku Stream.
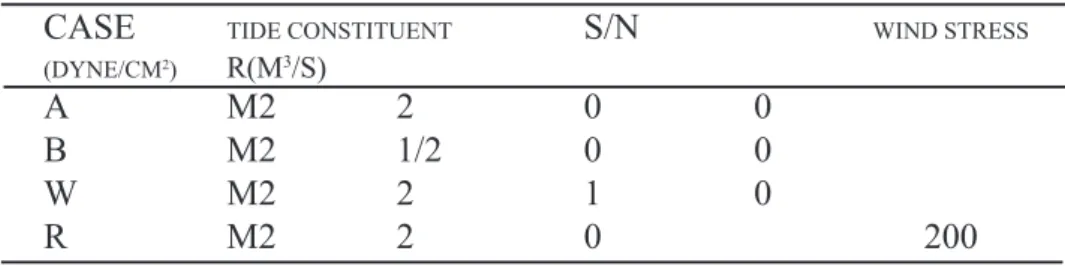
Table 1. Essential parameters used in the numerical experiments, in which S and N represents the cross-sectional area of the southern and northern en-trances, respectively; R means the runoff from the Chi-Ku stream.
CASE
TIDE CONSTITUENTS/N
WIND STRESS(DYNE/CM2) R(M3/S)
A
M2
2
0
0
B
M2
1/2
0
0
W
M2
2
1
0
R
M2
2
0
200
4.1 Control runFigure 5, from case A, shows vertically averaged velocities and sea surface contours at the 14th hour (flood) and 20th hour (ebb) of the fifth day. The modeled circulation patterns are in good agreement with observations (Figs. 2 and 3). The C/D area preferably occurs in the northern half of the lagoon at the flood and ebb phases. Maximum flow speeds at two en-trances range from 30 cm/s to 60 cm/s, in keeping with observations. The modeled sea surface indicates that the convergence and divergence areas are, respectively, low and high water level centers inside the lagoon. Apparently, flood currents entering two inlets meet at the conver-gence area, where the water level is relatively low. After high slack water, two tidal streams leaving the lagoon preferentially lower water level around the divergence area, creating the high anomaly.
4.2 Effects of S/N ratio
As widths of two entrances are interchanged, the modeled velocities and sea-surface el-evations at flood and ebb phases of case B are shown in Fig. 6. In comparison with model results of case A, the C/D area is moved southward to near the middle part of the lagoon. The sensitivity of C/D location to S/N ratio is understandable, as the dominant entrance tends to push the C/D area to the far side. Conceivably, the C/D area will be further displaced to the south as the S/N ratio continues to decrease. This type of exercise would be too quantitative to be pursued further here.
4.3 Modulation by northerly wind stress
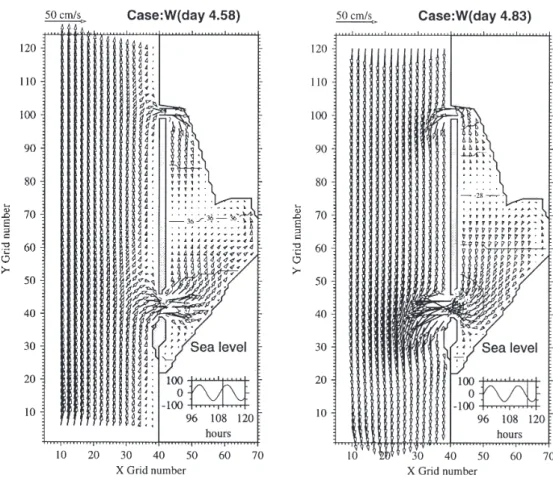
Typical wind speeds during NE monsoon range from 8 to 10 m/s over this area. There-fore, a northerly wind stress of 1 dyne/cm2 is applied to case W in conjunction with tidal
TAO, Vol. 10, No. 4, December 1999
892
panel) and ebb (right panel). Wind modulation is predictable. Through downwind accelera-tion, the northerly wind enhances the incoming tidal stream from the northern entrance but retards the incoming stream from the southern entrance. Consequently, the stagnation area is pushed southward during flooding [Fig. 7(a)]. For the ebbing tidal streams, the northerly wind decelerates the northern branch but accelerates the southern branch, resulting in a northward displacement of the stagnation area [Fig. 7(b)].
4.4 Runoff from Chi-Ku Stream
A larger-than-normal volumetric influx of 200 m3/s from Chi-Ku Stream is added in case
R in addition to tidal forcing. Figure 8 shows vertically averaged velocity vectors and sea surface elevations at flood (left panel) and ebb (right panel) stages. The runoff perturbs the C/ D location. At flood, the incoming tidal stream from southern entrance is reinforced by the
Fig. 5. Vertically averaged velocities and sea surface elevation contours(in cm) for Case A at the 14th hour(left panel) and the 20th hour(right panel) of the
fifth day. Sea level variations at southern boundary are plotted at lower right area in each panel.
runoff, pushing the stagnation area northward [Fig. 8(a)]. At ebb, Fig. 8(b), displacement of the stagnation location by Chi-Ku runoff seems minor.
Incoming (outgoing) volumetric fluxes averaged over a flood (ebb) period are estimated as 460 m3/s and 250 m3/s through the southern and the northern entrances, respectively. The
cross-section areas of the two entrances are about 1800 m2 and 900 m2, leading to mean speeds
of 25.5 cm/s and 27.7 cm/s in the southern and the northern entrances, respectively. In this light, typical runoff from Chi-Ku Stream (5 m3/s) can be neglected relative to tidal streams.
After typhoons, Chi-Ku Stream runoff can increase to more than 100 m3/s, presenting a sizable
disturbance to tidal streams. However, effects of typhoon-induced river impulse are expected to be short-lived.
For suspended contaminants entering the lagoon from Chi-Ku Stream, the flow stagna-tion area presents a barrier against seaward transport. Figure 8 suggests that most of these effluents would leave the lagoon through the southern entrance.
Fig. 6. Vertically averaged velocities and sea surface elevation contours(in cm) for Case B at the 14th hour(left panel) and the 20th hour(right panel) of the
TAO, Vol. 10, No. 4, December 1999
894
5. SUMMARY
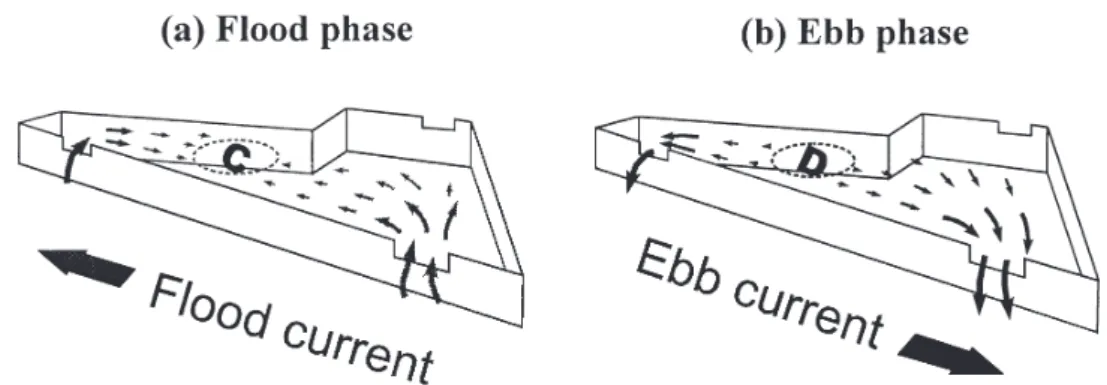
Circulations in the Chi-Ku lagoon are examined both observationally and numerically. Observations indicate two distinct flow patterns alternating regularly with changing tides. The lagoon exchanges waters with the adjacent sea through two entrances primarily at the semi-diurnal frequency. Figures 9(a) and 9(b) illustrate incoming and ebbing tidal streams, respec-tively. The two tidal streams converge and diverge in a flow stagnation area centered in the northern half of the basin. Speeds of these tidal streams are modulated by a spring-neap cycle, but the flow patterns remain similar. Results from a vertically averaged two-dimensional model indicate tidal dominance over other forcing. Further, the flow stagnation area is identified as a region of relatively high and low water levels at ebb and flood stages, respectively. The flow stagnation may hinder transport of waterborne materials between northern and southern reaches of the lagoon.
Fig. 7. Vertically averaged velocities and sea surface elevation contours(in cm) for Case W at the 14th hour(left panel) and the 20th hour(right panel) of
The width difference between northern and southern entrances determines the strength difference between two tidal streams entering and leaving the lagoon. The strength difference, in turn, determines the location of C/D area. Our observations are inadequate for distinguish-ing the role of wind stress and Chi-Ku runoff from tidal forcdistinguish-ing. However, the numerical modeling results point out their importance particularly in the NE monsoon season or after excessive precipitation. Downwind acceleration under a northerly wind stress pushes the C/D area southward during flood but northward during ebb. The effect of large river runoff (200 m3/s) also modulates the C/D location, which is moved northward during flood but is hardly
displaced during ebb.
The lagoon is a highly productive area for fishing and oyster culture in southwestern Taiwan. Increased human activity and the possible establishment of a coastal industrial park in the future may perturb the productivity. Proper management of the lagoon environment de-pends on a better understanding of its circulations, which is still woefully inadequate in terms of both observations and numerical modeling. In this light, the present work draws attention to
Fig. 8. Vertically averaged velocities and sea surface elevation contours(in cm) for Case R at the 14th hour(left panel) and the 20th hour(right panel) of the
TAO, Vol. 10, No. 4, December 1999
896
this challenge and makes a modest start.
Acknowledgements Ms. W.-L. Chang, Mr. W.-C. Hwang and Mr. K.-M. Jeng assisted the
field work. The Tuntex Oil Co., Ltd. and Yieh Loong Group sponsored part of the field obser-vations. Comments from three anonymous reviewers were useful for improving the manu-script. This is National Center for Ocean Research (NCOR) contribution number 16.
REFERENCES
Blumberg, A. F., and G. L. Mellor, 1987: A description of a three-dimensional coastal ocean circulation model. In: N. Heaps (Ed.), Three-Dimensional Coastal Ocean Models, Vol. 4, pp. 208, AGU, Washington, D.C.
Jan, S., and W.-S. Chiang, 1997: Differences of oceanic conditions between north and south sides of a sudden deflected coast west of Taiwan, Proc. 19th Conf. On Ocean Engineer-ing in Republic of China, 461-468(in Chinese with English abstract)
Kjerfve, B., 1986, Comparative oceanography of coastal lagoons. In: D. A. Wolfe (Ed.), Es-tuarine Variability, pp. 63-81, Academic Press, New York
Lee, H. J., S. Y. Chao, and K. L. Fan, 1999: Flood-ebb asymmetry of tidally induced recircu-lation eddies in a semi-enclosed basin: Nan Wan Bay, Continental Shelf Research, 19, 871-890.
Phleger, F. B., 1969: Some general features of coastal lagoons. In: A. Ayala-CastaÒeres (Ed.), Lagunas Costeras, un Simposio, pp. 5-26, Universidad Nacional AutÛnoma de MÈxico, MÈxico, DF
Postma, H., 1994: Future of research in coastal lagoons. In: B. Kjerfve (Ed.), Coastal lagoon processes, pp. 553-561, Elsevier Oceanography Series 60, Elsevier Science B.V., Amsterdam
Tainan Hydraulics Laboratory, 1997: Field investigation and model test for the BNan in-dustrial district, Part I: Field investigation, Bulletin No. 197
Fig. 9. A schematic showing lagoon circulations at (a) flood and (b) ebb stages. Convergence and divergence areas are marked by “C” and “D”, respec-tively.