國立臺灣大學生物資源暨農學院農業化學系 碩士論文
Department of Agricultural Chemistry College of Bio-Resources and Agriculture
National Taiwan University Master Thesis
鎵對阿拉伯芥生理以及分子層面上的影響
Physiological and Molecular Response of Arabidopsis thaliana to Gallium Exposure
張馨方
Hsin-Fang Chang
指導教授:王尚禮 博士
Advisor: Shan-Li Wang, Ph.D.
中華民國
105
年5
月國立臺灣大學碩士學位論文 口試委員會審定書
婆家對阿拉伯芥的生理及分子層面之影響
Physiological and molecular response of Arabidopsis thaliana to gallium exposure
本論文係、張馨方( R03623003 )在國立臺灣大學農業化 學系完成之碩士學位論文,於民國 105 年 05 月 30 日承下列
考試委員審查通過及口試及格,特此言登明
口試委員:
互布特
掌關被 當7私仇
L益主之
多從《(
4 向社
Abstract
Gallium (Ga) is a semimetallic element that has been progressively used in making electronics. The environmental contamination of gallium chemicals raises potential impacts on the ecology and human health. The information regarding how gallium interacts with plants is relatively insufficient in literatures. In this study, we demonstrate both the physiological and molecular basis of Ga exposure in the model plant Arabidopsis thaliana. Seedlings exposure to 6-150 µM Ga(NO3)3 had no effect on plant biomass and only slight reduction (15%) on root elongation. However, at 250 and 500 µM of Ga, the fresh weight and the root length were significantly reduced by nearly 30% and 60%, respectively. Malondialdehyde (MDA) production, a measure of lipid peroxidation, was unaffected under 6-500 µM Ga(NO3)3 exposure but increased by 2.5-fold at 750 µM, suggesting that Ga stress has potential to cause oxidative damage in plants. No significant accumulation of Ga was detected in plants grown below 150 µM Ga(NO3)3. In addition, the Ga concentration in the root (1000 mg kg-1 DW) was higher than in the shoot (200 mg kg-1 DW) under 500 µM Ga(NO3)3, indicating the immobilization or limited translocation of Ga in plants. With analysis of Ca, Mg, K, Na, P, N, Fe, Mn and Zn contents, we found that only Fe accumulation was reduced under Ga treatments. It implies that Ga perturbs Fe homeostasis in plants. By monitoring the expression of Fe deficiency related genes, we found that Ga might interfere the upstream molecule(s) of Fe homeostasis to reduce the activity of Fe deficiency signaling regulatory networks. Furthermore, we demonstrate that supplying exogenous citrate significantly increased Ga tolerance in Arabidopsis, which might be a potential way to remediate Ga-contaminated soil in the future.
Keywords: Gallium; Arabidopsis thaliana; Stress response; Nutrient uptake; Gene expression
Content
Abstract ... I Content ... III List of Figures ... V List of Tables ... VII
Chapter 1: Introduction ... 1
1.1 Gallium ... 1
1.1.1 Physicochemical properties and applications of gallium ... 1
1.1.2 Environmental significance of Ga ... 3
1.1.2.1 Nature sources: rocks and minerals ... 3
1.1.2.2 Anthropogenic sources ... 3
1.1.2.3 Ga distribution in environments ... 4
1.1.3 Environmental standards for Ga ... 5
1.1.4 Toxic effects ... 5
1.1.4.1 Exposure data in experimental animals ... 5
1.1.4.2 Health risks of Ga ... 6
1.1.4.3 Studies of carcinogenic potential in humans ... 7
1.1.4.4 Effects of Ga on microbe and plant growth ... 7
1.1.5 Goal and Objectives ... 9
Chapter 2: Materials and Methods ... 11
2.1 Chemicals ... 11
2.2 Plant materials and stress conditions ... 11
2.3 Modeling of metal speciation ... 12
2.4 Plant root length and biomass ... 12
2.5 Lipid peroxidation estimation ... 14
2.6 Quantitation of glutathione (GSH) ... 15
2.7 Metal uptake measurement ... 16
2.8 RNA isolation and quantitative real-time RT-PCR ... 17
2.9 Ga K-edge X-ray absorption near edge structure (XANES) analysis ... 21
2.9.1 Ga model compounds preparation ... 21
2.9.2 Data acquisition and treatment ... 23
2.10 Statistical Analysis ... 23
Chapter 3: Results ... 25
3.2 Physiological and Molecular Responses of Ga Toxicity ... 27
3.2.1 Ga exposure conditions and phenotypic characterization of Ga-treated Arabidopsis ... 27
3.2.2 Effect of Gaon membrane integrity ... 30
3.2.3 Impacts of Ga on the homeostasis of mineral elements in Arabidopsis ... 37
3.2.4 Ga might compete with Fe transportation ... 41
3.2.5 Ga suppression the expression of Fe uptake related genes ... 47
3.2.6 Ga induces the expression of Zn transporters ... 49
3.2.7 Ga inhibits Fe deficiency signaling and uptake response ... 51
3.2.8 Chemical forms of Ga in plants ... 54
3.3 Physiological and Molecular Aspects of Ga Resistance ... 59
3.3.1 Ga Exclusion via Root Carboxylate Exudation ... 59
Chapter 4: Discussion ... 67
Chapter 5: Conclusions ... 74
References ... 76
List of Figures
Figure 1. Ga exposure conditions and phenotypic characterization of Ga-treated
Arabidopsis plants. ... 28 Figure 2. KNO3, which used as a control for the effect of nitrate had no effect on
Arabidopsis growth. ... 29 Figure 3. Lipid peroxidation of Arabidopsis treated with to 250 or 500 µM of Ga(NO3)3.
... 31 Figure 4. GSH levels in roots and shoots of Arabidopsis treated with 250 or 500 µM of
Ga(NO3)3. ... 34 Figure 5. Characterization of GSH/PCs-Deficient lines (cad1-3, cad2-1) in Ga
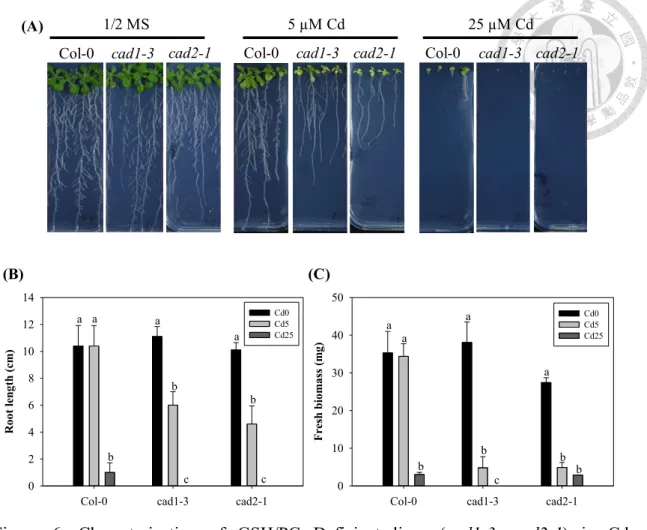
detoxification. ... 35 Figure 6. Characterization of GSH/PCs-Deficient lines (cad1-3, cad2-1) in Cd
detoxification. ... 36 Figure 7. Ga accumulation in roots and stem of Arabidopsis treated with 250 or 500 µM of Ga(NO3)3. ... 38 Figure 8. Impacts of Ga on macro-mineral elements homeostasis in Arabidopsis.
Seven-day-old seedlings grown in ½ MS medium were treated for 8 d. ... 39 Figure 9. Impacts of Ga on micro-mineral elements homeostasis in Arabidopsis.
Seven-day-old seedlings grown in ½ MS medium were treated for 8 d. ... 40 Figure 10. Effect of Fe content on Ga toxicity. ... 42 Figure 11. Ga accumulation in ½ MS with controlled basal Fe content in the presence of Ga (Fe5, 5µM Fe; Fe0, 0µM Fe) Seven-day-old seedlings grown in ½ MS medium were treated for 8 d. ... 43 Figure 12. The irt1 mutant is not associated with Ga transport in plants. ... 44 Figure 13. Ga accumulation in WS (wild type) and irt1 (mutant) under 250 or 500 µM
Ga treatments. Seven-day-old seedlings grown in ½ MS medium were treated for 8 d. ... 46 Figure 14. Temporal gene expression patterns for IRT1 and FRO2 in Arabidopsis treated with Ga. ... 48 Figure 15. Temporal gene expression patterns for ZIP4 and ZIP9 in Arabidopsis treated
with Ga. ... 50 Figure 16. Current knowledge of gene regulatory network in Fe homeostasis in
Arabidopsis. ... 52 Figure 17. Gene expression patterns for subgroup IVc bHLH genes (ILR3, bHLH14),
subgroup Ib bHLH genes (bHLH100, bHLH101), Fe homeostasis genes (PYE and OPT) and Fe uptake genes (FIT, IRT1 and FRO2) of Arabidopsis grown on
Ferrozine) Fe supply for 3 days. ... 53 Figure 18. Ga K-edge XANES spectra of reference compounds. ... 56 Figure 19. Three-component fits of Ga K-edge XANES spectra of Arabidopsis treated
with 250 or 500 µM of Ga(NO3)3. ... 57 Figure 20. Temporal gene expression patterns for AtMATE, AtALMT1 and AtFRD3 in A.
thaliana treated with Ga. ... 61 Figure 21. Supplying citrate affects Ga tolerance in Arabidopsis. ... 63 Figure 22. Ga accumulation in the presence of citrate. ... 65 Figure 23. Expression patterns for AtMATE and AtALMT1 in Arabidopsis grown with
citrate. ... 66 Figure 24. Model illustrates possible mechanisms of Ga toxicity and Ga resistance in
plants. ... 75
List of Tables
Table 1. Composition of MS medium ... 13 Table 2a. The Accession Numbers of Fe deficiency-responsive genes in roots and their
primers used in qPCR ... 19 Table 2b. The Accession Numbers of Fe deficiency-responsive genes in roots and their
primers used in qPCR. ... 20 Table 3. Ga reference compounds ... 22 Table 4. Percentage distribution of Ga components between dissolved, sorbed and
precipitated phases. ... 26 Table 5. Percentage distribution among dissolved and adsorbed species ... 26 Table 6. LCF results for the XANES spectrum of Ga in plant ... 58 Table 7. Formation constants between some commonly exuded organic anions (L) with
various cations (M). Except for protons, the values are for a ratios L:M of 1:1 derived in zero ionic strength media at 25oC (Ryan et al., 2001). ... 73
Chapter 1: Introduction 1.1 Gallium
1.1.1 Physicochemical properties and applications of gallium
Gallium (Ga) is located in group 13 (3A) of the periodic table of elements with an atomic number of 31, a relative atomic mass of 69.72, a hardness of 1.5 mohs, and a specific density of 5.904 and 6.905 g cm-3 for the solid and liquid phases, respectively (Jefferson Lab, 2003). Ga exhibits an unusually large temperature range of liquid state compared to most of other elements. It has a low melting point of only 29.7°C (Gallium, 2003). The boiling point of Ga is about 2,400°C and it has a low vapor pressure even at high temperatures (CRC, 2003). Solid gallium has an orthorhombic crystal structure and displays a conchoidal fracture similar to glass.
Natural Ga is composed of two stable isotopes (69Ga, 60.4%; 71Ga; 39.6%).
According to Greber (1989), Ga can form many substances such as bromides, chlorides, hydrides, iodides, nitrides, oxides, selenides, sulphides and tellurides. The valency of Ga is generally +3, but the oxidation states of +1 and +2 may also occur (Kabata-Pendias, 2010). The ability to deprotonate the Ga aqua complexes can be represented in pKa, the first four pKa of the Ga3+ aqua complexes are as below: pKa1 = 3.09, pKa2 = 3.55, pKa3 = 4.4, and pKa4 = 6.05. By increasing pH, the hydrolysis of Ga3+ would be formed as GaOH2+, Ga(OH)2+ and Ga(OH)30 at around pH = 1. After pH is higher than 5–6, the anion Ga(OH)4- would dominate Ga aqueous speciation (Benedicto et al., 2014). An anionic complex [Ga(OH)4(H2O)2]- exists almost exclusively at ambient pH of 7.3 (Harris and Messori, 2002). Although Ga is stable with water, it reacts vigorously with halogens even at low temperatures. Ga rapidly dissolves in either aqua regia or concentrated sodium hydroxide in an aqueous medium, and it also reacts with strong oxidants (Zhao et al., 2012).
Nowadays, Ga is a main material used in the electronic and semiconductor industries. The primary Ga production in 2015 was estimated to be 435 t, which is around four times higher than 2010 (Jaskula, 2010; Jaskula, 2015). This rapid growth is attributed to unusual properties of Ga, which provide higher electron mobility compared to other semiconductor materials, such as silicon (Si). Therefore, Ga has been widely used as power amplifiers for radiofrequency applications, such as smartphones, tablets, and other wireless devices for aerospace and defense applications (Mishra et al. 2002;
Hsu 2008). In the industrial usage, the most common form of Ga is combined with the elements of group XV such as Ga arsenide (GaAs) and Ga nitride (GaN) (Gupta et al., 2007; Chou et al., 2008).
In the medical field, radioactive Ga (67Ga) has been used in nuclear medicine to detect and localize malignant tumor cells (Gasparini et al., 1998; Lee et al., 1998). Some clinical trials have also shown the anticancer activity of Ga (Collery et al., 2002) that GaNO3 exhibited favorable therapeutic efficacy for treating lymphoproliferative disorders and bladder cancer (Warrell et al., 1983; Seidman et al., 1991).
1.1.2 Environmental significance of Ga 1.1.2.1 Nature sources: rocks and minerals
Ga occurs in very small concentrations in ores of other metals (Jaskula, 2015). Ga mainly occurs concentrated in bauxites and hosted by diaspore, various aluminosilicates (such as clays), apatite, nepheline and alunite. Ga also has a chalcophile affinity that it may occur as gallite (CuGaS2), and Ga is frequently substituted for Zn and Cu in sulphides, mainly in sphalerite (ZnS), germanite (Cu26Fe4Ge4S32), and chalcopyrite (CuFeS2) (Font et al., 2007). The average Ga content in soils is estimated as 15.2 mg kg-1 and its abundance varies from about 3 to 70 mg kg-1 (Połedniok, 2008). In general, Ga is usually associated with Al minerals and positively correlates with the clay fraction. The distribution of Ga in soils shows a positive correlate with Fe and Mn oxides (Kabata-Pendias, 2010). Moreover, Ga is known to form stable complexes with organic functional groups (Clause´n et al., 2003, 2005) and interactions with organic matter (SOM) will probably have a significant influence on the speciation of Ga in environmental systems.
1.1.2.2 Anthropogenic sources
Manufacturing processes devoted to the fabrication of Ga-based semiconductor devices generate large volumes of wastes that contain Ga as well as other combined metals (Yang and Chen, 2003). In the traditional industry, Ga is emitted from aluminum-related works (Dutrizac and Chen, 2000; Flamini et al., 2007; Xu et al., 2007), and Ga is also emitted during coal combustion (Fang and Gesser, 1996; Dumortier et al., 2005). The elevated contents of Ga in effluents, sludge, and composts may be a source of environment contamination (Kabata-Pendias, 2010).
1.1.2.3 Ga distribution in environments
The major source of Ga in air is emission of fly-ash, and the near point sources include coal-fired power generating stations and some metal smelting operations, as coal and oil contain Ga in concentrations of 1-35 mg kg-1 and 0.01-1.2 mg kg-1, respectively (Wedepohl, 1995). A Swedish study showed that the Ga concentration in ash from incineration of coal was between 4-7 mg kg-1 (Wedepohl, 1995). Ga exists in fresh and sea water primarily as a hydroxyl gallium, Ga(OH)4-. Its solubility is strongly dependent on the pH-value, which is highly soluble at acid pH-values but low soluble at neutral and basic conditions (Kjølholt et al., 2003).
The deposit of waste materials (from compost, industrials sewage or sludge) containing Ga might cause elevated concentrations of Ga in groundwater and irrigation canals, indicating that under some circumstances significant amounts of Ga can move from soil into local water (Kjølholt et al., 2003). Despite the increment in the use of Ga in the last 10 to 20 years, it is estimated that natural weathering of Ga still accounts for a considerable part of the total Ga emission (Yoshiyuki, 1997). Ga is relatively slight mobile soils, partly due to a low solubility of Ga(OH)3, which is its common compound.
Welch (2004) observed that during the weathering Ga is preferentially mobilized compared to Al and is also mobilized by complexing organic compounds (Kabata-Pendias, 2010). .
Ga arsenide (GaAs) has been studied widely because it is one of the most common materials used in semiconductor industries. A study indicated that the Ga and As concentrations in Formosan squirrels (Callosciurus erythraeus) could be considered as a good indicator especially for atmospheric contamination, and the Ga concentration in squirrels captured in Taiwan (~0.1 µg g-1) were higher than in those captured in
concentrations of Ga and As were shown in animals trapped from the nearest site of the Hsinchu Science Park (HSP) in Taiwan (Suzuki et al., 2007). Besides, in aqueous geochemistry, GaAs would rapidly dissociate in water to form Ga and arsenic oxides, which may further be hydrolyzed (Carter et al., 2003). Therefore, it was also found that the level of Ga in the groundwater in HSP (19.34 µg L-1) was higher than in Hsinchu District (0.02 µg L-1) (Chen, 2006).
1.1.3 Environmental standards for Ga
The Environmental Protection Administration (EPA) of Taiwan is the first agency in the world to control the concentration of Ga in effluent wastewater. The EPA of Taiwan promulgated revisions to the Effluent Standards on 15 December 2010, adding categories and restrictions on Ga, indium, molybdenum, total toxic organics (TTO) and acute toxic unit (TUa) for effluent wastewater from optoelectronics manufacturers and science parks. The threshold limit of Ga is 0.1 mg L-1 (Taiwan EPA, 2012). Details can be found on the EPA website under the section on the latest environmental protection regulations (http://ivy5.epa.gov.tw/epalaw/).
However, the national and international agencies, including World Health Organization (WHO), US Environmental Protection Agency (US EPA), Occupational Safety & Health Administration (OSHA) and European Health Committee (CDSP) have not established the regulations and guidelines for Ga.
1.1.4 Toxic effects
1.1.4.1 Exposure data in experimental animals
Numerous studies have reported the exposure data especially Ga2O3 in experimental animals. Tracheal installation of Ga2O3 aerosols containing 0.125–0.25 mg Ga/L in rats for 0.5–4 h showed that Ga was retained in the alveoli, inducing pulmonary consolidation (Venugopal and Luckey, 1978). Four-week inhalation of Ga2O3 at
concentrations near time-weighted average threshold limit values (TLVs) in rats may also cause progressive lung damage (Webb et al., 1986). Another study conducted a 13-week Ga2O3 exposure in male rats and mice with the concentrations of 0, 0.16, 0.64, 6.4, 32 or 64 mg/m3; the results showed no effect on male rat reproductive parameters, but exposure to Ga2O3 at 64 mg/m3 caused testicular degeneration, increase in cellular debris, and decreases in epididymis and testis weights, while the epididymal sperm motility and concentration were also decreased (Battelle Pacific Northwest Laboratories, 1990a,b).
Significant cytotoxic, inflammatory and fibrogenic responses of lung were found after 6 and 12 months Ga2O3 exposure in rats, indicating persistent impairment of particle clearance and suggested that exposure in the work place should be limited (Wolff et al., 1988).
1.1.4.2 Health risks of Ga
Ga does not accumulate in biological tissue (Sabot and Lauvray, 1994), only less than 1 mg/70 kg body weight of Ga is present in humans (Goering and Fowler, 1991).
However, several toxicities of Ga have been reported. Based on animal models, metallic gallium or gallium salts may cause toxicity through inhalation, swallow, subcutaneous or intravenous routes into the body. They can probably act as an eye, skin and mucous membrane irritant (Rumack, 2010; Stellman, 1998). Many studies indicated that Ga could interfere with cellular immune function and reveal antiproliferative activity. (Chitambar et al., 1989; Kovar et al., 1990; Huang et al., 1994; Drobyski et al., 1996; Kovar et al., 1997). Ga also appears to inhibit DNA synthesis by its action on ribonucleotide reductase (Haq et al., 1995). Other previous reports showed that Ga compounds might cause bone marrow depression, testicular toxicity, and hemorrhagic nephritis in mammals (Webb et al., 1987; Aoki et al., 1990; Omura et al., 1996).
1.1.4.3 Studies of carcinogenic potential in humans
For the studies about the carcinogenic potential in humans, there is relatively little information in the literature regarding of Ga alone, the available data usually shows the toxicity of Ga arsenide or other Ga compounds instead of Ga element. Gallium arsenide has been classified by International Agency for Research in Cancer (IARC) as a Group 1 carcinogen. The similarity of toxicochemical responses observed in subchronic studies with gallium arsenide and gallium oxide adds weight to the finding that the gallium moiety is active, suggesting that a carcinogenic response might be observed with other Ga compounds. The observed findings may also be a result of the combination of the two moieties (IARC, 2003). In addition, genotoxicity or carcinogenicity can be induced by gallium arsenide exposure (Chang et al., 2003), and Toxic Substance Control Act (TSCA) test submissions also indicate that Ga may potentially be carcinogenic. Exposing female rats to particulate concentrations of 0, 0.01, 0.1, and 1.0 mg/cu-1 m-1 for 6 h, 5 days/week for 105 weeks significantly increased the incidence of bronchiolar carcinomas, adrenal gland tumors, and leukemia (NIH/NIEH, 1998).
1.1.4.4 Effects of Ga on microbe and plant growth
The biological role of Ga in the development and functioning of plants has not been specifically defined so far. Little has been published regarding either the necessity or the toxicity of Ga to plants. Some studies have suggested that Ga might probably have a beneficial role in the growth of microorganisms and some fungi, such as Aspergillus (Steinberg, 1938). Another study shows that Ga has antimicrobial effects to inhibit pathogenic bacteria (Pseudomonas aeruginosa) growth and prevent biofilm formation, which make Ga a potentially promising new therapeutic agent against bacterial infections (Kaneko et al., 2007).
Kopittke and Yermiyahu (2007) found that Ga caused negative effects on root elongation and morphology in cowpea. In rice seedlings (Oryza sativa L. cv. XZX45), a linear decreased in relative growth rate, transpiration rate and water use efficiency was observed with increasing Ga concentrations (Yu et al., 2015). Besides, Yu and Zhang (2015) indicated that overaccumulation of Ga in rice (Oryza sativa L. cv. XZX45) provoked the formation of DNA-protein cross-links (DPCs) in roots, which resulted in cell death and growth inhibition of rice seedlings. On the other hand, Ga stimulated growth of rice seedlings (Oryza sativa L. cv. Taikeng 9) when concentration was below 10 mg Ga L-1 (Chien et al., 2015). A previous study also demonstrated that the iron deficiency stress response in cucumber was inhibited by gallium sulfate (Ga2(SO4)3) (Johnson and Barton, 2007).
1.1.5 Goal and Objectives
Given the widespread and increasing use of Ga in making electronics, large amounts of Ga-associated refuse are generated in the semiconductor manufacturing processes that may result in environmental problems. Indeed, Ga contamination has been reported in the Hsinchu Science-Based Industrial Park (HSIP) of Taiwan, in which the concentration of Ga in groundwater was 7.91-41.49 µg/L with an average of 19.34 µg/kg (Chen, 2006). Another study also indicated that the Ga content in Formosan squirrels (Callosciurus erythraeus) captured in Taiwan (~0.1 µg g-1) were higher than in those captured in Japanese sites (~0.01 µg g-1). Unsurprisingly, the animals with high Ga accumulation were trapped from the nearest site of the HSIP (Suzuki et al., 2007).
Ga is not an essential element and has no biological role in living organisms (Al-Aoukaty et al., 1992). Excessive intake of Ga by animals results in the accumulation of Ga in bones and may lead to impairment of kidney functions and failure of nervous system, as well as other acute and/or chronic toxicities (Webb et al., 1987; Aoki et al., 1990; Omura et al., 1996; Tanaka 2004). In an aqueous environment, Ga exists as inorganic ions, which cause immune system diseases and reduces blood leukocyte count in carp (Cyprinus carpio L.) (Burns et al., 1991; Betoulle et al., 2002).
In last decade, the potential threat to the ecology and human health through environmental contaminants in the food chain has been received considerable attention.
Recently, Ga has been reported to cause negative effects on root elongation and morphology in cowpea. In rice seedlings (Oryza sativa L. cv. XZX45), inhibition of relative growth rate, transpiration rate and water use efficiency was also observed under Ga treatments (Yu et al., 2015). However, those previous studies are focused on the phenotypic characteristics, and limited knowledge is available about Ga-induced biochemical mechanism in plants.
In this study, we have utilized Arabidopsis thaliana as the model plant to investigate the impact of Ga (in gallium nitrate, Ga(NO3)3) exposure. Representative parameters such as biomass, root length, lipid peroxidation, glutathione content and elemental contents were measured to investigate the plant’s toxicity response to abiotic stress of Ga. Additionally, the Ga-induced stress-related genes and the possible tolerance genes expression were analyzed using quantitative reverse transcription PCR (qRT-PCR). Results generated from those measurements can provide the information about toxic effects of Ga on plant in physiological and molecular levels and implications for establishing guidelines of Ga in environmental regulation. Furthermore, supplying exogenous citrate was also put into test to evaluate whether this root secreted compound plays a role in Ga tolerance in Arabidopsis.
Chapter 2: Materials and Methods 2.1 Chemicals
Gallium nitrate, sucrose, phytagel, agar, trichloroacetic acid (TCA), 2-thio-barbituric acid (TBA), glycine, cysteine, histidine and glutathione (GSH) were purchased from Sigma-Aldrich. 2-Morpholinoethanesulfonic acid (MES) and malate was purchased from J.T. Baker. Citrate, H2O2 and HNO3 were obtained from Merck. All the chemicals were in research grade.
2.2 Plant materials and stress conditions
Wild type Arabidopsis thaliana (ecotype Columbia) and mutants cad1-3 and cad2-1 were used in this study (Shanmugam et al., 2012). Seeds were surface-sterilized
with 70% ethanol for 2 min, and then treated with 1.2% bleach containing 0.02% SDS for 15 min and rinsed six times with sterilized water, followed by keeping in darkness at 4oC for 3–5 days for stratification. The pretreated seeds were grown on half-strength MS medium (Murashige and Skoog, 1962) (Table 1) in Petri dishes containing 1%
sucrose, 0.5 g/L of MES, and 0.3% phytagel at pH 5.7 for 7 days. Plantlets were then transferred to fresh medium containing Ga(NO3)3 (0, 6, 30, 150, 250, 500 or 750 µM) in a vertical position with 0.7% agar. Plant materials were cultured in the growth condition with light intensity at 70 µmolm-2 sec-1 with a 16-h light⁄ 8-h dark cycle at 22oC.
To prepare Ga-containing media, 1/2 MS medium containing no Ga was prepared and autoclaved (basic medium). An adequate volume of filtered (22 µm syringe filter, Millipore Corp., USA) stock solution of Ga was then added separately to the basic medium to target concentrations. Ga working stock concentration is 130 mg mL-1 (10 mM) Ga(NO3)3 in 0.012 M HCl.
All following experiments and analyses were done on 7-d-old seedlings with 8-d treatments.
2.3 Modeling of metal speciation
Visual MINTEQ software ver. 3.1 (Jon Petter Gustafsson, Sweden 2014) was used to determine the major speciation of Ga in each treatment based on metal concentrations as half-strength MS medium composition. The input parameters used for the simulations are listed in Table 1. The temperature was set to 25oC, ionic strength was calculated and pH was fixed at 5.0.
2.4 Plant root length and biomass
Root measurements were performed using ImageJ 1.37v software, a public domain Java Image processing program (http://rsb.info.nih.gov/ij/).
For biomass quantification, 4 pools of 5 roots or leaves of Arabidopsis seedlings were harvested and weighed. Data presented are displayed as the mean fresh weight of each seedling. These samples were used for macro- and microelement content measurement, and the procedures are as described below.
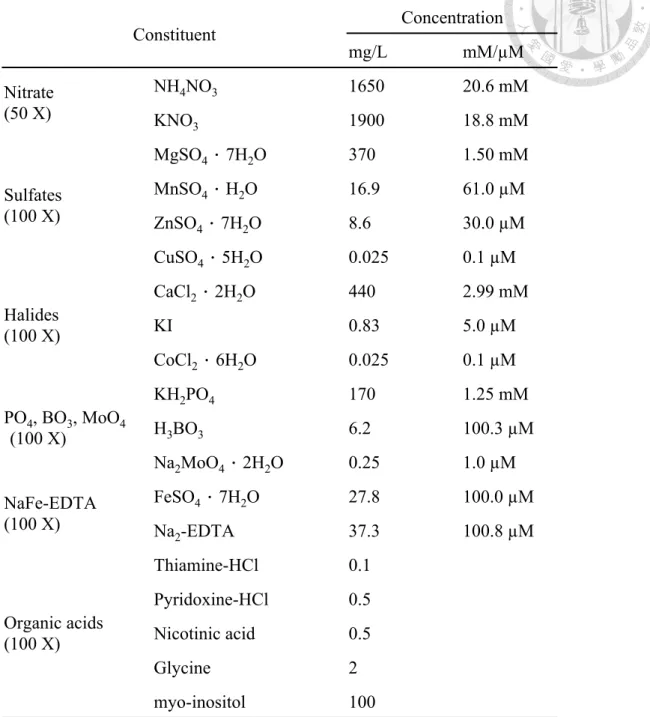
Table 1. Composition of MS medium
Constituent Concentration
mg/L mM/µM
Nitrate (50 X)
NH4NO3 1650 20.6 mM
KNO3 1900 18.8 mM
Sulfates (100 X)
MgSO4 7H2O 370 1.50 mM
MnSO4 H2O 16.9 61.0 µM
ZnSO4 7H2O 8.6 30.0 µM
CuSO4 5H2O 0.025 0.1 µM
Halides (100 X)
CaCl2 2H2O 440 2.99 mM
KI 0.83 5.0 µM
CoCl2 6H2O 0.025 0.1 µM
PO4, BO3, MoO4
(100 X)
KH2PO4 170 1.25 mM
H3BO3 6.2 100.3 µM
Na2MoO4 2H2O 0.25 1.0 µM NaFe-EDTA
(100 X)
FeSO4 7H2O 27.8 100.0 µM
Na2-EDTA 37.3 100.8 µM
Organic acids (100 X)
Thiamine-HCl 0.1 Pyridoxine-HCl 0.5 Nicotinic acid 0.5
Glycine 2
myo-inositol 100
2.5 Lipid peroxidation estimation
Lipid peroxidation in tissues was determined as a function of malondialdehyde (MDA) content, following the method described by Heath and Packer (1968) with slight modifications. Leaves and roots (80-100 mg) were homogenized in liquid nitrogen, followed by adding 1 mL of 0.1% TCA (work on ice), and then centrifuged at 13,000 rpm for 10 min at 4oC. After that 1 mL of 20% trichloroacetic acid (TCA) containing 0.5% 2-thio-barbituric acid (TBA) was added. The mixture was heated at 80°C for 30 min and then the homogenate was centrifuged at 13,000 rpm for 5 min at 4oC. After centrifugation, 200 µL of supernatant was transferred to a 96-well plate for analysis.
The absorbance at 532 nm was subsequent to subtraction of non-specific absorbance at 600 nm. The malondialdehyde (MDA) concentration in the plant sample is calculated using its extinction coefficient ε (= 155 mM-1 cm-1) as follows:
nmol MDA / g FW = ∆" $%&&'$(')×+.-×(/)×1222 3×4×5
Where:
∆Acorrected = A532 – A600 corrected with ∆A of the blank b = light path length (0.56 cm for 200 µL)
ε = millimolar extinction coefficient (155 mM-1 cm-1)
3.5 (dilution factor from 400 µL extract + 1 mL TBA/TCA solution) x (mL) 0.1% TCA used for extraction (1 mL)
y (g) FW used for extraction
1000 = conversion factor (nmol to µmol)
2.6 Quantitation of glutathione (GSH) (Arisi et al., 1997)
Total thiols were first labeled with monobromobimane and then determined by reverse-phase HPLC (Newton et al. 1981; Kosower and Kosower 1987) according to the method described by Strohm et al. (1995) with slight modification.
Root and shoot tissues (approx. 100 mg fresh weight) were separated with scissors and immediately frozen in liquid nitrogen. Then the samples were extracted with 0.1 M Tris-HCl containing 10 mM MgCl2 and 1 mM EDTA (pH=7.5) (sample/extraction (1/10, v/v)) on ice for 5 min. After centrifugation at 13,200 rpm for 30 min at 4°C, 400 µL of supernatant was mixed with 600 µL of 0.2 M 2-(N-cyclohexylamino) ethanesulfonic acid (Ches, pH 9.3) and 100 µL of 40 mM NaBH4 (for the reduction of thiols), then the mixture was kept on ice for 20 min. After cooling, 330 µL of the mixture and 15 µL of 15 mM monobromobimane (dissolved in acetonitrile) were mixed and the derivatization was allowed to proceed for 15 min at room temperature in darkness. The reaction was stopped by addition of 250 µL of 5% acetic acid. Samples were centrifuged at 13,200 rpm for 10 min at 4 °C and the supernatant was injected into a Waters (St Quentin en Yvelines, France) HPLC system. Separation of derivatized thiols was carried out on an XDB-C18 column (150 × 4.6 mm i.d; C18 Spheri 5; Agilent technology, Stevens Creek Blvd. Santa Clara, United States).
Compounds were eluted using a linear gradient comprising buffer A (10%
methanol containing 0.25% acetic acid, pH 4.3) and buffer B (90% methanol containing 0.25% acetic acid, pH 4.3). The gradient program was (1) 100% A within 13 min; (2) 90% A:10% B for 1 min; (3) 40% A:60% B for1 min (4) 10% A:90% B for1 min; (5) 90% A:10% B for1 min at a flow rate of 1.0 ml/min.
Monobromobimane derivatives were detected fluorometrically (excitation 380 nm;
emission 480 nm). By comparison to the mixed standards (treated by the same process
as the samples), three peaks at approximately 4, 5.4 and 7 min were identified as cysteine, c-EC and GSH (target compound), respectively. Within the range of the data shown, peak area was proportional to thiol concentration.
2.7 Metal uptake measurement
For metal uptake measurement, roots and shoots were harvested separately. Tissues were washed in 3 successive baths of water or 10 mM CaCl2, dried at 70oC for 3 d and weighed. De-ionized water with a resistance of 18.2 MΩ·cm (at 25°C) made by the Milli-Q water purification system (Millipore Co., MA, USA) was used for all experiments.
Oven-dried (70oC) shoot and root tissues were digested in 2 mL of 65% HNO3 and 0.5 mL H2O2 (both Suprapur). The mineralization process was conducted in Teflon vessels by the MarsXpress microwave digestion system (CEM, Matthews, NC, USA).
Tomato leaves (SRM- 1573a) from the National Institute of Standards and Technology (Gaithersburg, MD, USA), which contained known nutrient element concentrations, were used as a standard.
The digestion procedure in a microwave oven following the program: (1) room temperature to 195◦C for 15 min; (2) 195◦C hold for 15 min. After cooling the vessels to room temperature, sample and blank digests were diluted to 10 mL with H2O and filtered by use of a 0.45-µm-membrane filter. The element contents in digested samples were analyzed by using inductively coupled plasma-optical emission spectrometry (ICP-AES; Perkin Elmer OPTIMA 5300). The calibration solutions were prepared by adequate dilution of multi-element stock standard solutions (ICP Multi Element Standard Certipur VIII; Merck). Matrix-induced background interference was corrected by use of
reagent blank subtraction. Each elemental concentration in the sample was determined by triplicate measurements.
2.8 RNA isolation and quantitative real-time RT-PCR
For real-time quantitative reverse transcription-PCR (qRT-PCR), 7-day-old Arabidopsis seedlings grown in 1/2MS medium were transferred to other MS medium supplemented with 0 (control), 250 or 500 µM Ga-treated phytagel for 1, 3, 5 or 7 days treatment. For harvesting, seedlings were wiped gently with paper towels, and root and shoot samples were separated with scissors and immediately frozen in liquid nitrogen.
Sample preparation for real-time RT-PCR experiments using the exogenous citrate effect was similar to the procedures mentioned above except for the following modifications: Transferred 7-day-old Arabidopsis seedlings to 0 (control) and 250 or 500 µM Ga-treated medium without and with exogenously supplied citrate for 3 d.
Total RNA was extracted from individual samples using a Total RNA Isolation Kit (Plant) according to the manufacturer’s instructions (GeneDireX, http://www.genedirex.com/). First-strand cDNA was synthesized in a reaction cocktail containing 1 µg of gDNA wipeout-treated total RNA, 4 µL of 5x Quantiscript RT buffer (also contains RNase inhibitor), 1 µL of RT Rrimer Mix (includes Mg and dNTPs), and 1 µL of Reverse-transcriptase master mix (QIAGEN, https://www.qiagen.com/tw/) in a total volume of 20 µL. The reaction was carried out at 42°C for 15 min, followed by heating at 95°C for 3 min.
Primer sequences are given in Table 2a-b. Sequence data from this article can be found in the GenBank/EMBL data libraries under accession numbers At4g19690 (IRT1), At1g01580 (FRO2), At1g10970 (ZIP4), At4g33020 (ZIP9), At1g51340 (MATE), At1g08430 (ALMT1), At3g08040 (FRD3) and At5g25760 (UBC21).
Quantitative real-time RT-PCR was performed using an ABI 7500 real-time PCR system and SYBR Green kit (Applied Biosystems, http://www.appliedbiosystems.com/).
Each real-time RT-PCR reaction contained 20 ng of first-strand cDNAs, 0.15 µM primers and 7.5 µL of 2x SYBR Green Master Mix in a final volume of 15 µL.
The real-time PCR process comprised an initial denaturation at 95°C for 10 min, followed by 40 cycles of 94°C for 15 s and 60°C for 1 min, and a final dissociation stage of 95°C for 15 s, 60°C for 1 min and 95°C for 15 s. The data were analyzed using the ABI 7500 System SDS software (Applied Biosystems).
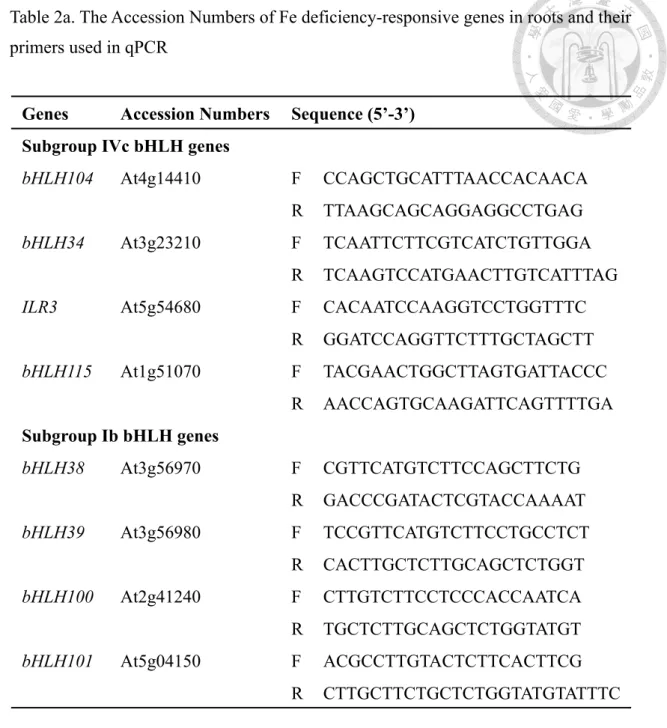
Table 2a. The Accession Numbers of Fe deficiency-responsive genes in roots and their primers used in qPCR
Genes Accession Numbers Sequence (5’-3’) Subgroup IVc bHLH genes
bHLH104 At4g14410 F CCAGCTGCATTTAACCACAACA R TTAAGCAGCAGGAGGCCTGAG bHLH34 At3g23210 F TCAATTCTTCGTCATCTGTTGGA
R TCAAGTCCATGAACTTGTCATTTAG ILR3 At5g54680 F CACAATCCAAGGTCCTGGTTTC
R GGATCCAGGTTCTTTGCTAGCTT bHLH115 At1g51070 F TACGAACTGGCTTAGTGATTACCC
R AACCAGTGCAAGATTCAGTTTTGA Subgroup Ib bHLH genes
bHLH38 At3g56970 F CGTTCATGTCTTCCAGCTTCTG R GACCCGATACTCGTACCAAAAT bHLH39 At3g56980 F TCCGTTCATGTCTTCCTGCCTCT
R CACTTGCTCTTGCAGCTCTGGT bHLH100 At2g41240 F CTTGTCTTCCTCCCACCAATCA
R TGCTCTTGCAGCTCTGGTATGT bHLH101 At5g04150 F ACGCCTTGTACTCTTCACTTCG
R CTTGCTTCTGCTCTGGTATGTATTTC
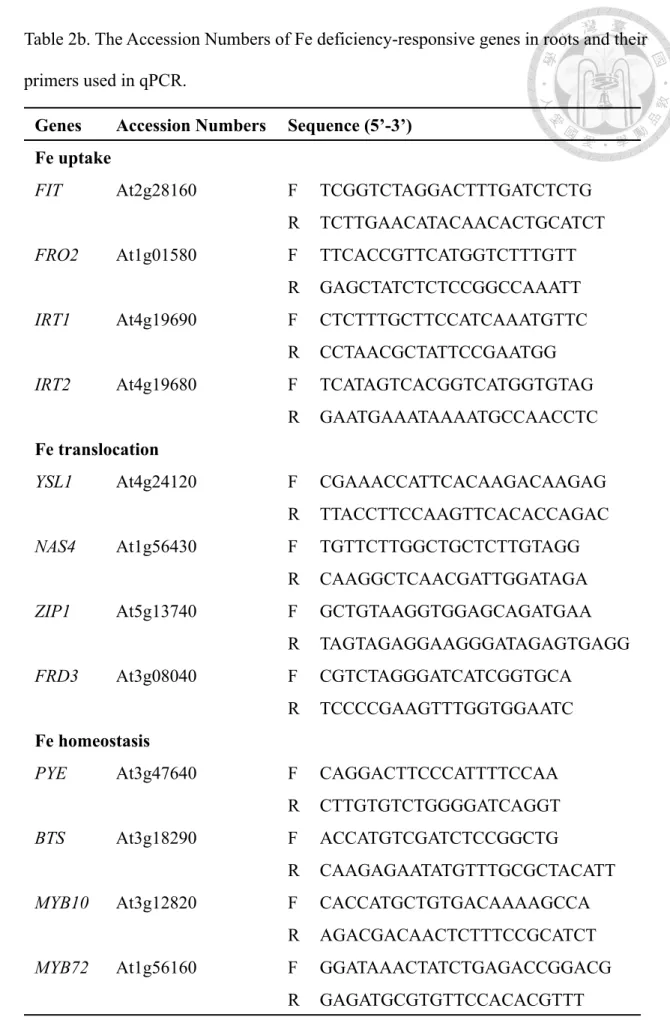
Table 2b. The Accession Numbers of Fe deficiency-responsive genes in roots and their primers used in qPCR.
Genes Accession Numbers Sequence (5’-3’)
Fe uptake
FIT At2g28160 F TCGGTCTAGGACTTTGATCTCTG
R TCTTGAACATACAACACTGCATCT
FRO2 At1g01580 F TTCACCGTTCATGGTCTTTGTT
R GAGCTATCTCTCCGGCCAAATT
IRT1 At4g19690 F CTCTTTGCTTCCATCAAATGTTC
R CCTAACGCTATTCCGAATGG
IRT2 At4g19680 F TCATAGTCACGGTCATGGTGTAG
R GAATGAAATAAAATGCCAACCTC
Fe translocation
YSL1 At4g24120 F CGAAACCATTCACAAGACAAGAG
R TTACCTTCCAAGTTCACACCAGAC
NAS4 At1g56430 F TGTTCTTGGCTGCTCTTGTAGG
R CAAGGCTCAACGATTGGATAGA
ZIP1 At5g13740 F GCTGTAAGGTGGAGCAGATGAA
R TAGTAGAGGAAGGGATAGAGTGAGG
FRD3 At3g08040 F CGTCTAGGGATCATCGGTGCA
R TCCCCGAAGTTTGGTGGAATC
Fe homeostasis
PYE At3g47640 F CAGGACTTCCCATTTTCCAA
R CTTGTGTCTGGGGATCAGGT
BTS At3g18290 F ACCATGTCGATCTCCGGCTG
R CAAGAGAATATGTTTGCGCTACATT
MYB10 At3g12820 F CACCATGCTGTGACAAAAGCCA
R AGACGACAACTCTTTCCGCATCT
MYB72 At1g56160 F GGATAAACTATCTGAGACCGGACG
R GAGATGCGTGTTCCACACGTTT
2.9 Ga K-edge X-ray absorption near edge structure (XANES) analysis 2.9.1 Ga model compounds preparation
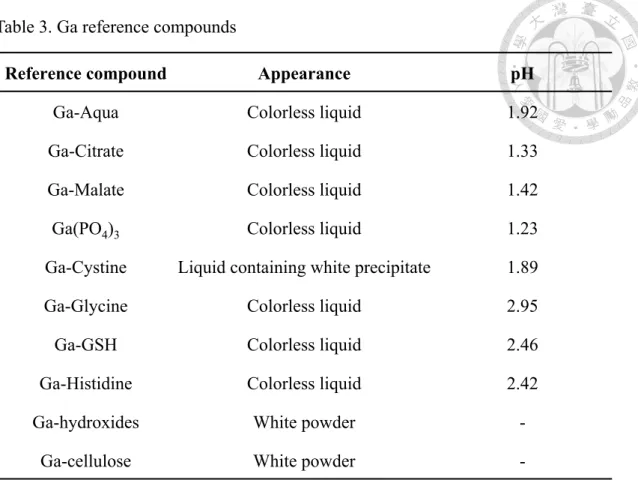
Various organic and mineral Ga model compounds were synthesized for comparison with plant samples (fingerprint approach). Optimal experimental conditions (pH and concentrations) were calculated using MINTEQ to ensure the presence of the required Ga-complex and to avoid precipitation.
The description of the applied compounds is presented in Table 3. The chemicals used for the preparation of the reference compounds were purchased from Sigma-Aldrich. For the preparation of liquid reference compounds, Ga(NO3)3 solution (20 mM) and solutions of ligands (200 mM) (i.e., a metal/ligand (M/L) ratio of 1/10) were used. A so-called Ga aqua complex was also analyzed by XANES, it was the Ga(NO3)3 solution with concentration of 20 mM. The applied ligands were as follows:
cysteine (Cys), glycine (Gly), glutathione (GSH), histidine (His) citrate (Cit), malate (Mal) and H3PO4. These reference compounds were prepared by the mixing of 5 mL of the Ga(NO3)3 solution with the corresponding ligand. The pH of the solutions was determined using a standard laboratory pH meter, the measured values are presented in Table 3.
Gallium hydroxides (Ga(OH)3 (am) and GaOOH (s)) were prepared by synthesis as solid compound via adding ammonia solution of pH=8.5 to Ga(NO3)3 solution.
Ga-cellulose complexes were prepared by mixing Ga(NO3)3 solution (20 or 200 mM) and cellulose solution (with the same M/L ratios of 1/10), followed by stirring the gel for 3 h at fixed pH 5.0 by addition of NaOH or HNO3. In above-mentioned chemical reactions, a precipitated solid material containing Ga was formed and collected by centrifuge, and the pellets were frozen and freeze-dried at −80°C (Isaure et al., 2006).
Table 3. Ga reference compounds
Reference compound Appearance pH
Ga-Aqua Colorless liquid 1.92
Ga-Citrate Colorless liquid 1.33
Ga-Malate Colorless liquid 1.42
Ga(PO4)3 Colorless liquid 1.23
Ga-Cystine Liquid containing white precipitate 1.89
Ga-Glycine Colorless liquid 2.95
Ga-GSH Colorless liquid 2.46
Ga-Histidine Colorless liquid 2.42
Ga-hydroxides White powder -
Ga-cellulose White powder -
2.9.2 Data acquisition and treatment
The measurement of Ga K-edge XANES was performed at the Beamline X17C in the National Synchrotron Radiation Research Center at Hsinchu, Taiwan. The beamline optics include a vertically collimating pre-mirror, a fixed-exit double crystal Si(1 1 1) monochromator and a toroidal focusing mirror. At least two fluorescence spectra were collected for each sample using a Lytle detector. Spectral processing and analysis were conducted using Athena (Ravel and Newville, 2005) following the procedure suggested by Kelly et al. (Kelly et al., 2008). Briefly, all spectra were calibrated to the absorption edge of metallic Ga at 10367 eV (i.e., E0). The spectra for each sample were then averaged, followed by background removal and normalization. Linear combination fitting (LCF) was used to determine the combinations of standard spectra giving the best fit to the sample spectra (Kelly et al., 2008). The standard compounds used in this work were Ga(NO3)3 (aq), Ga- cysteine (aq), Ga- glycine(aq), Ga- histidine (aq), Ga-citrate (aq), Ga-malate(aq), Ga(PO4)3 (aq) and the Gallium hydroxides (Ga(OH)3 (am) and GaOOH (s)).
The Ga K-edge XANES of these reference compounds were collected using the same procedure for the samples and subsequently used to fit the sample spectra. The LCF was conducted using Athena (Ravel and Newville, 2005), and no energy shifts were permitted in the LCF algorithm. The goodness of a fit was evaluated using the R factor, defined as(data-fit)2/ (data)2 (see Athena Users’ Manual for details), where the sums are over the data points in the fitting region (i.e., −30 to 40 eV relative to E0).
2.10 Statistical Analysis
At harvest, replicate shoot and root tissues were separated and analyzed in quadruplicate for the various assays described above. Standard error of the mean were calculated and represented in all figures. Elemental content is expressed on a dry weight basis. One-way ANOVA followed by Student-Newman-Keuls multiple comparison test
(p < 0.05) was used to determine all differences of statistical significance among treatments and denoted by different letters.
Chapter 3: Results
3.1 Thermodynamic calculation of the species distribution
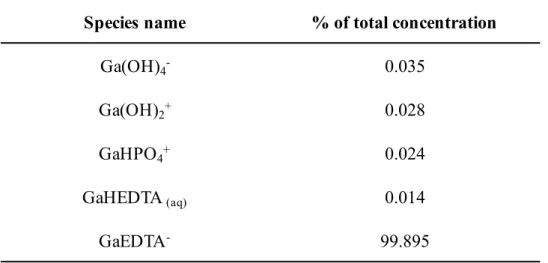
The thermodynamic determination of the species distribution in the samples was done using Visual MINTEQ and the therein provided stability constants (log K) of the complexes (Gustafson, 2010). The percentage distribution of Ga components between dissolved, sorbed and precipitated phases is shown in Table 4. The percentage distribution among dissolved and adsorbed species is in Table 5.
Ga was predicted to be present primarily precipitated as Ga(OH)3(s) whereas the amount of dissolved species was found insignificant (0.0012%). The main ionic species would mainly be [GaEDTA]- in the dissolved fraction. These results were not fully consistent with the experimentally found Ga distribution. Only about one-third of the precipitated Ga was detected in the half-strength MS solution (without adding agar) based on the metal concentrations determined by ICP-AES. The results obtained from MINTEQ are calculated based on theoretical predictions. It is known that the time parameters are excluded in the primitive concept of thermodynamics, for a dynamical system far from equilibrium, it is necessary to deal with empirical probabilities defined through time averages, and the main problem is how to formulate an appropriate statistical thermodynamics (Carati, 2005). In my system, Ga precipitation might probably happen, but how long will it take for precipitation is difficult to predict at present. Here, it was assumed that the bioavailability of Ga present in the medium was equal to the concentrations which we supplied in our system. However, the Ga concentration in the agar-contained medium did not correspond to the results which were calculated by Visual MINTEQ software or determined by ICP-AES.
Table 4. Percentage distribution of Ga components between dissolved, sorbed and precipitated phases.
Table 5. Percentage distribution among dissolved and adsorbed species Component Dissolved (%) Sorbed (%) Precipitated (%)
Ga 0.012 0 99.988
Species name % of total concentration
Ga(OH)4- 0.035
Ga(OH)2+ 0.028
GaHPO4+ 0.024
GaHEDTA(aq) 0.014
GaEDTA- 99.895
3.2 Physiological and Molecular Responses of Ga Toxicity
3.2.1 Ga exposure conditions and phenotypic characterization of Ga-treated Arabidopsis
To find the concentrations that cause toxicity to Arabidopsis, a wide range of Ga(NO3)3 concentrations ranging from 0 to 750 µM was tested in the present study. The growth of Arabidopsis in the presence of 0 to 750 µM of Ga(NO3)3 is shown in Fig. 1.
The root growth was slightly repressed under 6, 30 and 150 µM of Ga(NO3)3 (Fig. 1B and C). The inhibition of root growth was enhanced with the increase of Ga in medium.
In the 250 and 500 µM Ga(NO3)3 treatments, the average root lengths were reduced by nearly 30% and 60%, respectively. Consistent with the root phenotype, treatments with 250 and 500 µM of Ga(NO3)3 significantly reduced the fresh weight of shoots. But in the low concentrations (6, 30 and 150 µM) of Ga(NO3)3, there was no significant difference (p < 0.05) in the shoot biomass (Fig. 1D). Morphologically, at concentrations of 750 µM Ga(NO3)3, Arabidopsis root growth were stunted and failed to penetrate the medium. KNO3 (used as a control for the effect of nitrate) had no effect on Arabidopsis growth (Fig. 2), indicating that the Ga3+ was responsible for the growth inhibitory activity of Ga(NO3)3. The Ga(NO3)3 concentrations of 250 and 500 µM were chosen for the treatments of studies.
Figure 1. Ga exposure conditions and phenotypic characterization of Ga-treated Arabidopsis plants.
(A) Phenotypes of Arabidopsis exposed to 6-750 µM of Ga(NO3)3. Bar = 1 cm.
Seven-day-old Arabidopsis seedlings grown in one-half-strength Murashige and Skoog (½ MS) medium were treated with Ga(NO3)3 for 8 d. B, Root length. The dash line represents the root length before Ga treatments; Fresh biomass of Arabidopsis including (C) roots and (D) shoots of seedlings grown under different Ga levels as mentioned in (A). The means are averaged from four replicates (n=8-12). Error bars correspond to standard error of mean. Values of fresh biomass or roots length followed by different
1/2MS 6 µM Ga 30 µM Ga 150 µM Ga 250 µM Ga (A)
500 µM Ga 750 µM Ga
Ga concentration (mM)
0 6 30 150 250 500 750
Shoot fresh biomass (mg plant-1) 0 5 10 15 20
25 a
a a a a
b
c
Ga concentration (µM) Ga concentration (mM)
0 6 30 150 250 500 750
Root fresh biomass (mg plant-1 )
0 2 4 6 8 10 12
14 a
ab
ab ab
bc cd
d
Ga concentration (µM)
Ga concentration (mM)
0 6 30 150 250 500 750
Root length (cm)
0 2 4 6 8 10
12 a
b b b
b
c d
Ga concentration (µM)
(C)
(B)
(D)
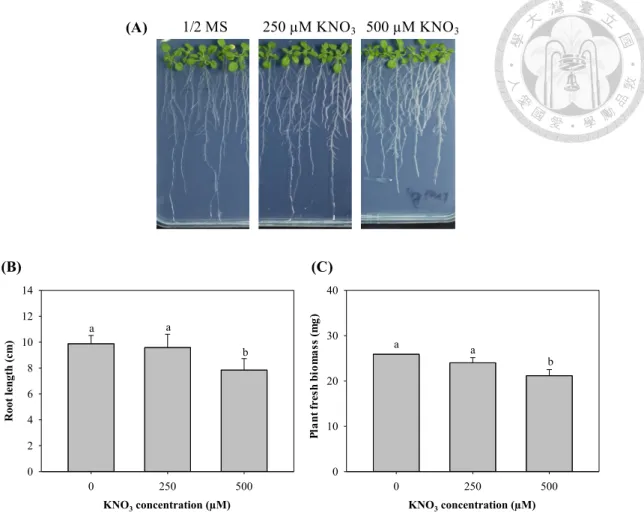
Figure 2. KNO3, which used as a control for the effect of nitrate had no effect on Arabidopsis growth.
(A) Phenotype of seedlings treated with 250 or 500 µM of KNO3. Bar = 1 cm.
Seven-day-old seedlings grown in ½ MS medium were treated for 8 d. (B) Root length and (C) fresh biomass of seedlings grown under different KNO3 levels as mentioned in (A). The means are averaged from four replicates (n=8-12). Error bars correspond to standard error of mean. Values of fresh biomass or roots length followed by different letters are significantly different at p < 0.05.
KNO3 concentration (mM)
0 250 500
Root length (cm)
0 2 4 6 8 10 12 14
a a
b
KNO3 concentration (µM) KNO3 concentration (mM)
0 250 500
Root length (cm)
0 10 20 30 40
a a
b
KNO3 concentration (µM)
1/2 MS 250 µM KNO3 500 µM KNO3
(A)
(C) (B)
Plantfreshbiomass(mg)
3.2.2 Effect of Gaon membrane integrity
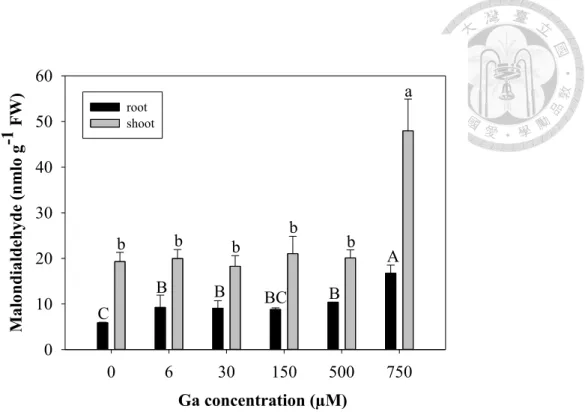
Lipid peroxidation plays an important role in cell membrane damage, which can be indirectly measured by a cytotoxic product “Malondialdehyde (MDA)”. Thus, the level of lipid peroxidation (MDA formation) has widely been utilized to evaluate the negative effects of abiotic stress on plants (Verma and Dubey 2003; Cho and Park 2000; Dixit et al. 2001). MDA production in the shoot and root of control plants were approximately 20 and 6 nmol/g FW, respectively. Ga(NO3)3 in the range of 6 to 500 µM had no significant effect on MDA production in both shoots (18-21 nmol/g FW) and roots (8-10 nmol/g FW). But at 750 µM Ga(NO3)3, the MDA levels were 2.5-fold higher in shoot (50 nmol/g FW) and 3-fold higher in root (18 nmol/g FW) compared with the control (Fig. 3). Therefore, Ga does cause membrane damage at high concentration.
Figure 3. Lipid peroxidation of Arabidopsis treated with to 250 or 500 µM of Ga(NO3)3. The means are averaged from four replicates (n=8-12). The error bars correspond to standard error of mean. Values of malondialdehyde followed by different letters are significantly different at p < 0.05 within the group. FW, fresh biomass.
Ga concentration (mM)
0 6 30 150 500 750
Malondialdehyde (nmlo g-1 FW) 0 10 20 30 40 50 60
root shoot
a
b b b
b b
A
BC B
B B C
Ga concentration (µM)
3.2.2.1 Glutathione and phytochelatin do not play roles in defenses of Ga-induced stress
It is known that plants possess defense strategies to combat with such detrimental effects of heavy metal exposure and their accumulation. The mechanisms related to the cellular free metal content including apoplastic regulation (Marschner, 1995; Gobran et al., 2000), metal exclusion, chelation and sequestration (Hall, 2002), while the strategies related to the regulation of cellular responses including repair of stress-damaged proteins and antioxidative defense (Hall, 2002). Glutathione (GSH; γ-glu-cys-gly) is a key component in such metal scavenging because its thiol (-SH) group has high affinity to metals. In addition, it also acts as a primary precursor for phytochelatins (PCs) synthesis. PCs, a chelating agent in plants, could protect plants from the adverse toxicity problem through forming complexes with toxic metal ions in the cytosol, which are subsequently transported into the vacuole (Salt et al., 1995; Bricker et al., 2001;
Freeman et al., 2004; Mittler et al., 2004; Cuypers et al., 2010; Jozefczak et al., 2012).
The GSH contents in the shoot and root of control plants were approximately 60 and 120 µmol/g FW, respectively. After exposure to various concentrations of Ga(NO3)3, the cellular GSH level declined with the increase of Ga concentration (Fig.
4). A maximum 2-fold decrease in GSH in root (60 µmol/g FW) was observed at the treatment concentration of 500 µM Ga(NO3)3.
To explore the mechanistic connection between GSH/PCs levels and Ga stress tolerance in Arabidopsis, three mutants cad1-3 and cad2-1 which had been genetically modified to alter GSH/PCs levels (Howden and Cobbett, 1992; Howden et al., 1995a;
Cobbett et al., 1998; Shanmugan et al., 2012) were examined. The cad1 locus, which is deficient in PCs with a mutation in PC synthase gene (Howden et al., 1995b), while the
et al., 1995a; Shanmugan et al., 2012). These mutants are sensitive to a range of heavy metals.
By analyzing the physiological responses of cad1-3 and cad2-1 under Ga-treated conditions, it may clarify whether Arabidopsis use GSH/PCs to detoxify the heavy metal stress. If GSH/PCs have positive role on the tolerance of Ga stress, the mutants should be hypersensitive compared with the wild type to Ga stress. However, the results showed that there was similar phenotype between the mutants and wild type under Ga treatments (Fig. 5). Therefore, GSH/PCs has no effect on the tolerance of Ga stress.
Figure 4. GSH levels in roots and shoots of Arabidopsis treated with 250 or 500 µM of Ga(NO3)3.
The means are averaged from four replicates (n=8-12). The error bars correspond to standard error of mean. Values of Ga concentration followed by different letters are significantly different at p < 0.05 within the group. FW, fresh biomass.
Ga concentration (mM)
0 250 500
GSH (mmol g-1 FW )
0 20 40 60 80 100 120 140 160
root shoot
a a A
a
B B
Ga concentration (µM) GSH (µmol g-1 FW)
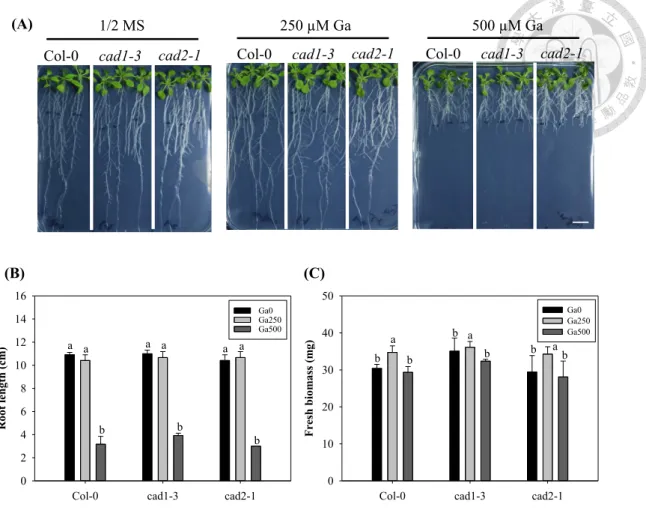
Figure 5. Characterization of GSH/PCs-Deficient lines (cad1-3, cad2-1) in Ga detoxification.
(A) Phenotype of Col-0 (wild type), cad1-3 and cad2-1 seedlings treated with 250 or 500 µM of GaN3O9. Bar = 1 cm. Seven-day-old Arabidopsis seedlings grown in ½ MS medium were treated for 8 d. (B) Root length and (C) fresh biomass of seedlings grown under different Ga levels as mentioned in (A). The means are averaged from four replicates (n=8-12). Error bars correspond to standard error of mean. Values of fresh biomass or roots length followed by different letters are significantly different at p <
0.05.
Col-0 cad1-3 cad2-1
Root length (cm)
0 2 4 6 8 10 12 14 16
Ga0Ga250 Ga500
a a a a a a
b b b
Col-0 cad1-3 cad2-1
Fresh biomass (mg)
0 10 20 30 40 50
Ga0 Ga250 Ga500
a b b
b a
b b ab
Col-0 cad1-3 cad2-1 Col-0 cad1-3 cad2-1 Col-0 cad1-3 cad2-1
1/2 MS 250 µM Ga 500 µM Ga
(A)
(B) (C)
Figure 6. Characterization of GSH/PCs-Deficient lines (cad1-3, cad2-1) in Cd detoxification.
(A) Phenotype of Col-0 (wild type), cad1-3 and cad2-1 seedlings treated with 5 or 25 µM of CdSO4. Bar = 1 cm. Seven-day-old Arabidopsis seedlings grown in ½ MS medium were treated for 8 d. (B) Root length and (C) fresh biomass of seedlings grown under different Cd levels as mentioned in (A). The means are averaged from four replicates (n=8-12). Error bars correspond to standard error of mean. Values of fresh biomass or roots length followed by different letters are significantly different at p <
0.05.
Col-0 cad1-3 cad2-1 Col-0 cad1-3 cad2-1 Col-0 cad1-3 cad2-1
1/2 MS 5 µM Cd 25 µM Cd
Col-0 cad1-3 cad2-1
Root length (cm)
0 2 4 6 8 10 12 14
Cd0 Cd5 Cd25
a a
b a
b
c
b a
c
Col-0 cad1-3 cad2-1
Fresh biomass (mg)
0 10 20 30 40 50
Cd0 Cd5
a Cd25
a
b
b c a
a
b b
(B) (C)
(A)
3.2.3 Impacts of Ga on the homeostasis of mineral elements in Arabidopsis
The contents of mineral elements in the seedlings were analyzed to evaluate whether Ga had potential effects on nutrient uptake and translocation. Roots were the main Ga accumulation site as they absorbed much higher quantities (1000 mg kg-1 DW) than shoot (200 mg kg-1 DW) with 7 days of 500 µM Ga treatment after transfer (Fig. 7).
Ga does not have dramatic influence to the contents of macronutrients including Mg, K, Na, Ca and P (Fig. 8). For micronutrients, the treatments of Ga slightly decrease Mn accumulation. The treatment of 250 µM Ga induces root Zn accumulation, but not at 500 µM Ga (Fig. 9). Interestingly, Ga dramatically reduces the accumulation of Fe in the root. This data suggests that Ga may negatively influence the uptake of Fe. It is possibly that Ga competes with Fe uptake or suppresses Fe uptake.
Figure 7. Ga accumulation in roots and stem of Arabidopsis treated with 250 or 500 µM of Ga(NO3)3.
The means are averaged from four replicates (n=8-12). The error bars correspond to standard error of mean. Values of Ga concentration followed by different letters are significantly different at p < 0.05 within the group. DW, dry biomass.
Ga concentration (mM)
0 6 30 150 250 750
Ga concentration (mg kg-1 DW)
0 200 400 600 800
1000 root
shoot
B
A
C a
c b D
D
D d d d
Ga concentration (µM)