TIBCO LogLogic® Log Management Intelligence (LMI)
User Guide
Software Release 6.1 March 2017
TIBCO SOFTWARE IS SOLELY TO ENABLE THE FUNCTIONALITY (OR PROVIDE LIMITED ADD-ON FUNCTIONALITY) OF THE LICENSED TIBCO SOFTWARE. THE EMBEDDED OR BUNDLED SOFTWARE IS NOT LICENSED TO BE USED OR ACCESSED BY ANY OTHER TIBCO SOFTWARE OR FOR ANY OTHER PURPOSE.
USE OF TIBCO SOFTWARE AND THIS DOCUMENT IS SUBJECT TO THE TERMS AND CONDITIONS OF A LICENSE AGREEMENT FOUND IN EITHER A SEPARATELY EXECUTED SOFTWARE LICENSE AGREEMENT, OR, IF THERE IS NO SUCH SEPARATE AGREEMENT, THE CLICKWRAP END USER LICENSE AGREEMENT WHICH IS DISPLAYED DURING DOWNLOAD OR INSTALLATION OF THE SOFTWARE (AND WHICH IS DUPLICATED IN THE LICENSE FILE) OR IF THERE IS NO SUCH SOFTWARE LICENSE AGREEMENT OR CLICKWRAP END USER LICENSE AGREEMENT, THE LICENSE(S) LOCATED IN THE “LICENSE” FILE(S) OF THE SOFTWARE. USE OF THIS DOCUMENT IS SUBJECT TO THOSE TERMS AND CONDITIONS, AND YOUR USE HEREOF SHALL CONSTITUTE ACCEPTANCE OF AND AN AGREEMENT TO BE BOUND BY THE SAME.
This document contains confidential information that is subject to U.S. and international copyright laws and treaties. No part of this document may be reproduced in any form without the written authorization of TIBCO Software Inc.
TIBCO, Two-Second Advantage, and LogLogic are either registered trademarks or trademarks of TIBCO Software Inc. in the United States and/or other countries.
All other product and company names and marks mentioned in this document are the property of their respective owners and are mentioned for identification purposes only.
THIS SOFTWARE MAY BE AVAILABLE ON MULTIPLE OPERATING SYSTEMS. HOWEVER, NOT ALL OPERATING SYSTEM PLATFORMS FOR A SPECIFIC SOFTWARE VERSION ARE RELEASED AT THE SAME TIME. SEE THE README FILE FOR THE AVAILABILITY OF THIS SOFTWARE VERSION ON A SPECIFIC OPERATING SYSTEM PLATFORM.
THIS DOCUMENT IS PROVIDED “AS IS” WITHOUT WARRANTY OF ANY KIND, EITHER EXPRESS OR IMPLIED,
INCLUDING, BUT NOT LIMITED TO, THE IMPLIED WARRANTIES OF MERCHANTABILITY, FITNESS FOR A PARTICULAR PURPOSE, OR NON-INFRINGEMENT.
THIS DOCUMENT COULD INCLUDE TECHNICAL INACCURACIES OR TYPOGRAPHICAL ERRORS. CHANGES ARE PERIODICALLY ADDED TO THE INFORMATION HEREIN; THESE CHANGES WILL BE INCORPORATED IN NEW EDITIONS OF THIS DOCUMENT. TIBCO SOFTWARE INC. MAY MAKE IMPROVEMENTS AND/OR CHANGES IN THE PRODUCT(S) AND/OR THE PROGRAM(S) DESCRIBED IN THIS DOCUMENT AT ANY TIME.
THE CONTENTS OF THIS DOCUMENT MAY BE MODIFIED AND/OR QUALIFIED, DIRECTLY OR INDIRECTLY, BY OTHER DOCUMENTATION WHICH ACCOMPANIES THIS SOFTWARE, INCLUDING BUT NOT LIMITED TO ANY RELEASE NOTES AND "READ ME" FILES.
Copyright © 2002-2017 TIBCO Software Inc. All Rights Reserved.
TIBCO Software Inc. Confidential Information
|
iiiContents
Preface . . . ix
Related Documents . . . x
Typographical Conventions . . . xii
Connecting with TIBCO Resources . . . .xiv
How to Join TIBCOmmunity . . . .xiv
How to Access TIBCO Documentation. . . .xiv
How to Contact TIBCO Support . . . .xiv
. . . .xiv
Chapter 1 Using LogLogic Appliances . . . .1
LogLogic Appliance Overview . . . 2
Appliance User Functions . . . 3
LogLogic Product Families. . . 5
LogLogic LX Product Family . . . 5
LogLogic MX Product Family . . . 6
LogLogic ST Product Family. . . 6
Scalable Infrastructure . . . 7
Chapter 2 Viewing Dashboards . . . .9
Viewing System Status . . . 10
Viewing Multiple Systems Status (Management Station) . . . 15
Viewing Message Rate . . . 17
Viewing CPU Usage . . . 18
Viewing Log Source Status . . . 20
Viewing Unapproved Messages . . . 24
Viewing Recent Messages . . . 24
Viewing Log Source Data Trend . . . 26
Managing Your Dashboard . . . 27
Managing Widgets . . . 28
Defining your Dashboard Canvas Settings . . . 39
Chapter 3 Viewing Real Time Log Messages . . . .41
Accessing and Selecting Real Time Messages to View . . . 42
Java Security Settings. . . 47
Modifying your Java settings . . . 47
Chapter 4 Searching Collected Log Messages . . . 49
Search Overview. . . 50
Using Index Search. . . 52
Search Expression Rules. . . 52
Running an Index Search . . . 53
Using the Search Results Tab . . . 56
Using the Search History Tab . . . 64
Using the Search Filters Tab . . . 65
Using the Clipboard Tab. . . 65
Tag-Based Searches Using the Tag Picker Interface . . . 68
Using Regular Expression Search . . . 69
Using Distributed Regular Expression Search. . . 71
Viewing Pending and Running Searches. . . 73
Viewing RegEx Search Results . . . 75
Using Search Filters . . . 76
Adding a Search Filter . . . 76
Search Filter Options . . . 78
Putting Your Logins Search Filter to Work . . . 80
Adding Additional Parameters to a Pre-Defined Regular Expression Search Filter. . . 81
Modifying a Search Filter . . . 83
Viewing All Saved Index Searches . . . 85
Using and Creating All Index Reports . . . 86
Chapter 5 Creating and Managing Alerts . . . 89
Viewing and Handling Alerts . . . 90
Manage Alert Templates . . . 93
Adding a New Alert Template Format . . . 93
Viewing and Modifying an Alert Template . . . 96
Removing an Alert Template . . . 97
Managing Alert Rules . . . 98
Preconfigured System Alerts . . . 98
Adding a New Alert Rule . . . 100
Parsed Data Alerts. . . 104
Modifying or Removing An Alert . . . 105
Chapter 6 Generating Real-Time Reports . . . 107
Preparing a Real-Time Report . . . 108
Generating a Report: An Example. . . 112
Contents
|
vAvailable Operators . . . 114
Access Control Reports . . . 117
Permission Modification Reports . . . 118
User Access Reports . . . 119
User Authentication Reports. . . 120
User Created/Deleted Reports . . . 121
User Last Activity Reports . . . 122
Windows Events Reports . . . 124
Database Activity Reports . . . 126
All Database Events Reports . . . 127
Database Access Report . . . 128
Database Data Access Report . . . 129
Database Privilege Modifications Report . . . 130
Database System Modifications Report . . . 131
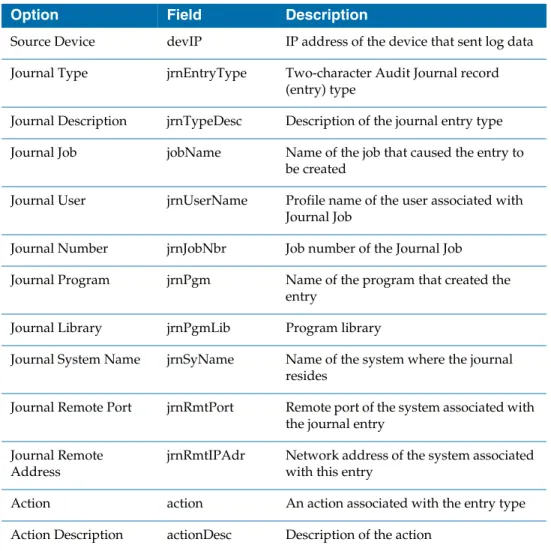
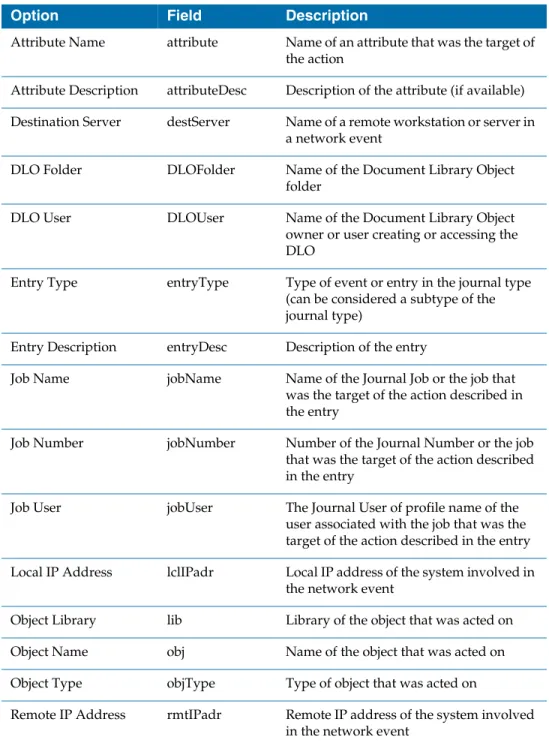
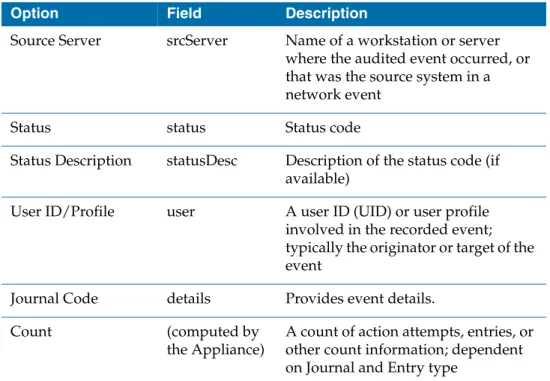
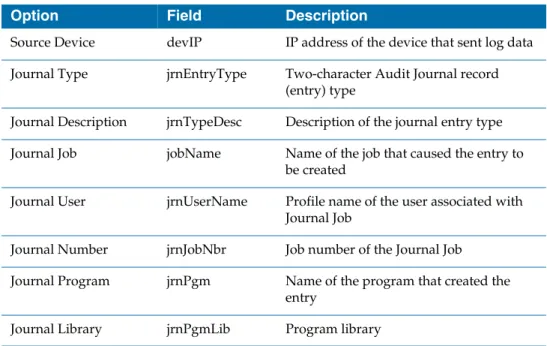
IBM i5/OS Activity Reports . . . 132
All Log Entry Types Reports . . . 133
System Object Access Reports . . . 135
User Access By Connection Reports . . . 138
User Actions Reports . . . 140
User Jobs Reports . . . 143
Threat Management Reports. . . 146
IDS/IPS Activity Reports. . . 147
Threat Activity Reports . . . 148
Configuration Activity Reports . . . 149
Scan Activity Reports . . . 151
Security Summary Reports . . . 152
DB IPS Activity Reports . . . 153
HIPS Activity Reports . . . 154
Mail Activity Reports . . . 156
Exchange 2000/03 SMTP Reports . . . 157
Exchange 2000/03 Activity Reports . . . 158
Exchange 2000/03 Delay Reports . . . 159
Exchange 2000/03 Size Reports . . . 160
Server Activity Reports . . . 161
Exchange 2007/10 Activity Reports . . . 161
Exchange 2007/10 Mail Size Reports . . . 162
Network Activity Reports . . . 164
Accepted Connections Reports . . . 166
Active FW Connections Reports. . . 167
Active VPN Connections Reports . . . 168
Application Distribution Reports . . . 169
Denied Connections Reports . . . 170
VPN Access Reports . . . 173
VPN Sessions Reports . . . 174
VPN Top Lists Reports. . . 175
Web Cache Activity Reports . . . 176
Web Surfing Activity Report . . . 177
DHCP Activity Report . . . 178
DHCP Granted/Renewed Activity Report . . . 179
DHCP Denied Activity Report . . . 180
NAT64 Activity Report . . . 181
Operational Reports . . . 183
All Unparsed Events Reports. . . 184
Firewall Statistics Reports . . . 184
Total Message Count Reports . . . 185
Security Events Reports . . . 186
System Events Reports . . . 187
VPN Events Reports . . . 188
Policy Reports . . . 190
Check Point Policies Reports. . . 191
Network Policies Reports. . . 191
Rules/Policies Reports. . . 192
ECM Policy Reports. . . 193
Enterprise Content Management . . . 195
ECM Activity Reports. . . 196
Content Management Reports. . . 197
Security Settings Reports . . . 197
Expiration and Disposition Reports . . . 198
HP NonStop Audit . . . 200
Configuration Changes Reports . . . 201
Failed and Successful Logins Reports. . . 202
Object Changes Reports . . . 203
HP NonStop Audit Activity Reports . . . 204
User Actions Reports. . . 205
Object Access Reports . . . 206
IBM z/OS Activity . . . 207
Resource Access Reports . . . 208
Security Modifications Reports . . . 209
System Access/Configuration Reports . . . 210
Unix System Services Reports . . . 210
Login/Logout Reports . . . 211
Violation Reports . . . 212
Storage Systems Activity . . . 214
Filer Access Reports . . . 214
Flow Activity . . . 216
Contents
|
viiApplication Usage Reports . . . 216
User Browsing Reports. . . 217
Top Users Reports . . . 218
All Saved Reports . . . 220
Chapter 7 Setting User Preferences. . . .221
Viewing Your LogApp Account . . . 222
Changing Login Landing Page. . . 223
Changing LogApp Account Password . . . 224
Chapter 8 Advanced Features . . . .225
Advanced Search Overview. . . 227
Using Content Assist . . . 228
Using the Search Field . . . 228
Using the Time Field. . . 229
Using Smart Lists . . . 229
Using Monthly Index . . . 230
Search Results . . . 231
Charts . . . 232
Columns . . . 234
Data . . . 241
About Bloks . . . 251
Filter Bloks . . . 251
Viewing All Bloks . . . 252
Adding a Blok . . . 252
Modifying Bloks . . . 253
Deleting Bloks. . . 253
Time Bloks . . . 254
Manage Bloks . . . 255
Manage Dashboard . . . 258
Viewing Dashboards. . . 259
Adding Widgets to a Dashboard . . . 260
Editing a Widget . . . 271
Deleting a Widget . . . 272
Duplicating a Dashboard . . . 272
Deleting a Dashboard . . . 272
Managing Data Models . . . 274
Viewing Data Models . . . 277
Adding a Data Model in Graphical Mode . . . 278
Adding a Data Model in Raw Mode . . . 288
Duplicating Data Models . . . 291
Deleting Data Models. . . 291
Using the REST API . . . 292
Constructing REST Requests . . . 292
REST API Endpoint ( baseurl ) . . . 293
Response Status Codes . . . 293
REST API Support for Advanced Search . . . 295
Creating a Query . . . 295
Retrieving Results . . . 296
Deleting a Query . . . 297
Creating Sub-Queries . . . 297
Appendix A Syslog Host Field Character Sets . . . 299
Syslog Header Character Sets . . . 300
Exceptions . . . 301
Appendix B Supported Regular Expression Characters . . . 303
Appendix C Search Syntax Reference . . . 305
Event Query Language Reference . . . 306
USE Statement . . . 308
FILTER Statement . . . 310
Predefined Functions . . . 315
COLUMNS Statement . . . 322
GROUP BY Statement. . . 323
SORT BY Statement . . . 325
LIMIT Statement . . . 326
Optimizing Queries for Performance . . . 326
Text Search . . . 327
Search Examples. . . 328
|
ixPreface
The TIBCO LogLogic® LMI User Guide is an operational guide for LogLogic Appliances. It covers topics related to managing dashboards, reports, alerts, and performing searches to manage and use the log data collected and aggregated from all types of source systems in your enterprise.
Topics
• Related Documents on page x
• Typographical Conventions on page xii
• Connecting with TIBCO Resources on page xiv
Related Documents
The LogLogic documentation is available on the TIBCO LogLogic documentation page.
The following documents contain information about the LogLogic Appliances:
• TIBCO LogLogic® LMI Release Notes — Provides information specific to the release including product information, new features and functionality, resolved issues, known issues and any late-breaking information. Check the LogLogic Customer Support Website periodically for further updates.
• TIBCO LogLogic® LMI Hardware Installation Guide — Describes how to get started with your LogLogic Appliance. In addition, the guide includes details about the Appliance hardware for all models.
• TIBCO LogLogic® LMI Configuration and Upgrade Guide — Describes how to install and upgrade the LogLogic Appliance software.
• TIBCO LogLogic® LMI User Guide — Describes how to use the LogLogic solution, viewing dashboard, managing reports, managing alerts, and performing searches.
• TIBCO LogLogic® LMI Administration Guide — Describes how to administer the LogLogic solution including all Management and Administration menu options.
• TIBCO LogLogic® Log Source Packages Configuration Guides — Describe how to support log data from various log sources. There is a separate manual for each supported log source. These documents include documentation on LogLogic Collectors as well as documentation on how to configure log sources to work with the LogLogic solution.
• TIBCO LogLogic® Log Source Packages Collector Guides — Describe how to implement support for using a LogLogic Collector for specific log sources such as IBM i5/OS and ISS Site Protector.
• TIBCO LogLogic® LMI Web Services API Implementation Guide — Describes how to implement the LogLogic Web Services APIs to manage reports, manage alerts, perform searches, and administrate the system.
• TIBCO LogLogic® LMI Syslog Alert Message Format Quick Reference Guide — Describes the LogLogic Syslog alert message format.
• TIBCO LogLogic® LMI Enterprise Virtual Appliance Quick Start Guide— Provides instructions on how to quickly set up the TIBCO Enterprise Virtual Appliance.
• TIBCO LogLogic® LMI Log Source Report Mapping Guide — Provides provides a set of tables listing Log Source Reports by Device Type, sorted by UI Category.
Preface
|
xi• TIBCO LogLogic® LMI XML Import/Export Entities Reference Guide—Describes how to manually import, export, and edit XML files into and from the appliance when not using the appliance UI.
• TIBCO LogLogic® LMI Memory Module Installation Guide—Describes how to install and remove memory modules in LogLogic appliances.
Typographical Conventions
The following typographical conventions are used in this manual.
Table 1 General Typographical Conventions Convention Use
code font Code font identifies commands, code examples, filenames, pathnames, and output displayed in a command window. For example:
Use MyCommand to start the foo process.
bold code font
Bold code font is used in the following ways:
• In procedures, to indicate what a user types. For example: Type admin.
• In large code samples, to indicate the parts of the sample that are of particular interest.
• In command syntax, to indicate the default parameter for a command. For example, if no parameter is specified, MyCommand is enabled:
MyCommand [enable | disable]
italic font Italic font is used in the following ways:
• To indicate a document title. For example: See TIBCO ActiveMatrix BusinessWorks Concepts.
• To introduce new terms For example: A portal page may contain several portlets. Portlets are mini-applications that run in a portal.
• To indicate a variable in a command or code syntax that you must replace.
For example: MyCommandPathName Key
combinations
Key name separated by a plus sign indicate keys pressed simultaneously. For example: Ctrl+C.
Key names separated by a comma and space indicate keys pressed one after the other. For example: Esc, Ctrl+Q.
The note icon indicates information that is of special interest or importance, for example, an additional action required only in certain circumstances.
The tip icon indicates an idea that could be useful, for example, a way to apply the information provided in the current section to achieve a specific result.
Preface
|
xiiiThe warning icon indicates the potential for a damaging situation, for example, data loss or corruption if certain steps are taken or not taken.
Table 1 General Typographical Conventions (Cont’d) Convention Use
Connecting with TIBCO Resources
How to Join TIBCOmmunity
TIBCOmmunity is an online destination for TIBCO customers, partners, and resident experts. It is a place to share and access the collective experience of the TIBCO community. TIBCOmmunity offers forums, blogs, and access to a variety of resources. To register, go to http://www.tibcommunity.com.
How to Access TIBCO Documentation
The latest documentation for all TIBCO products is available on the TIBCO Documentation site (https://docs.tibco.com), which is updated more frequently than any documentation that might be included with the product.
Documentation for TIBCO LogLogic products is available on the TIBCO LogLogic documentation page.
How to Contact TIBCO Support
For comments or problems with this manual or the software it addresses, contact TIBCO Support as follows:
• For an overview of TIBCO Support, and information about getting started with TIBCO Support, visit this site:
http://www.tibco.com/services/support
• If you already have a valid maintenance or support contract, visit this site:
https://support.tibco.com
Entry to this site requires a user name and password. If you do not have a user name, you can request one.
Using LogLogic Appliances
|
1Chapter 1 Using LogLogic Appliances
Topics
• LogLogic Appliance Overview on page 2
• Appliance User Functions on page 3
• LogLogic Product Families on page 5
LogLogic Appliance Overview
Log data can comprise up to 25 percent of all enterprise data. Log data also contains critical information that can improve security, compliance and
availability. Until now most companies have relied on ineffective and inefficient homegrown solutions and manual processes to manage this data.
LogLogic provides the industry's first enterprise class, end-to-end log management solution. Using LogLogic’s log management solutions, IT organizations can analyze and archive network log data for the purpose of compliance and legal protection, decision support for network security remediation, and increased network performance and improved availability.
LogLogic log management appliances simplify, automate, and reduce the cost of log data aggregation and retention, eliminating the need for servers, tape
libraries, and archival administrators. If the network grows, simply rack and stack additional appliances as needed.
Appliance User Functions
|
3Appliance User Functions
There are two primary user types on a LogLogic Appliance:
• User – monitors appliance operations, runs searches, manages alerts, and creates and runs reports based on collected data
• Administrator – configures and maintains the appliance itself, including managing log sources, user accounts, appliance configurations, running backups, and more
Depending on access permissions, a user can perform User functions,
Administrator functions, or both. This manual describes User tasks and functions.
For Administrator information, see the TIBCO LogLogic® LMI Administration Guide.
Dashboard, Reports, Search, and Alert functions can be opened by clicking their respective icons on the home page or by clicking their buttons on the top
navigation menu on the home page.
Management, and Administration functions for the appliance are opened by clicking their buttons on the top menu on the home page. For more information on these functions, see TIBCO LogLogic® LMI Administration Guide.
Online Help can be opened by clicking the Help icon on any page. Brief video tutorials provide tips and guidance by example for many new LogLogic features.
Tutorials can be accessed from the home page and from certain application pages.
The appliance GUI provides access to all Administrator and User functions.
Administrators can perform all functions on the appliance, while Users are limited to functions that have been assigned to them by the System
Administrator.
The functions in the navigation menu vary depending on the appliance product family. For example, an ST appliance displays fewer options than the LX
appliance because certain features are not available on ST appliances. In addition, Reports may show different entries, depending on the Log Source Packages (LSPs) installed.
For all text fields throughout the UI, null is not a valid entry.
In addition to documentation, the LogLogic appliance is supported by
comprehensive, context-sensitive online Help, which can be opened from any UI page in the application. Clicking the question mark (?) opens Help for the particular tab that is highlighted. Clicking the question mark (?) Help on the topmost menu bar opens the entire online Help repository, plus a Table of Contents, an Index, and a Search function within Help. Take a moment to explore Help to discover the rich content offered there.
LogLogic Product Families
|
5LogLogic Product Families
LogLogic offers three families of products to provide better, faster, and smarter log management, database security, and regulatory compliance solutions to corporations:
• LogLogic LX Appliances are purpose-built appliances for real-time log data collection and analysis. These appliances slash response times to network security and utilization incidents, boost IT productivity, and reduce the corporate cost of security and performance event remediation.
• LogLogic MX Appliances perform real-time log data collection and analysis ideal for mid-size and large companies. These appliances slash response times to network security and utilization incidents, boost IT productivity, and are optimized to provide for log data needs in a non-enterprise environment.
• LogLogic ST Appliances automate the entire log data archival process, minimizing administration costs while providing more secure log data capture and retention.
LogLogic Appliances bring visibility of compliance activity metrics to CIOs and CSOs, and control over activities to the compliance team, permitting them to review the compliance timeliness and compliance posture mandated by Sarbanes-Oxley (SOX) and Payment Card Industry Data Security Standard (PCI-DSS).
LogLogic Appliances provide the highest log collection and analysis performance amongst all log management vendors. Log events are received and indexed in real-time. The LogLogic Appliances have clearly-stated metrics that cannot be matched.
LogLogic LX Product Family
Featuring a parallel processing architecture, the appliances centralize log data collection and retention by simultaneously processing raw log data and metalog data. Distributed real-time reporting and targeted queries let administrators take immediate action on network issues from a centralized management console.
These appliances help enterprises harness the power of log data for a safer, more reliable network, while reducing corporate IT costs and providing rapid return on investment.
LX Benefits
• Real-Time Reports, ad-hoc queries and fast drill downs to speed up identification, isolation and repair of security and network incidents
• Non-disruptive installation and plug-and-play operation: no changes to network configurations, no integration with other systems, no training required, available in minutes
• Self-maintaining, embedded database technology that eliminates the need for DB administration
To view photographs of the LX Appliance layout, see the TIBCO LogLogic® LMI Hardware Installation Guide.
LogLogic MX Product Family
The appliances centralize log data collection and retention by simultaneously processing raw log data and metalog data at any volume. Designed specifically for mid-size and large companies, MX Appliances provide the disk space and processing power required for most non-enterprise environments.
MX Appliance features support the need to harness the power of log data for a safer, more reliable network, while reducing corporate IT costs and providing rapid return on investment. MX Appliances are designed for installations where data must be retained longer than LX Appliances provide, but where enterprise features such as failover* and managing other log appliances are not required.
MX Benefits
MX product family appliances offer the following benefits:
• Real-time reports, ad-hoc queries and fast drill downs to speed up identification, isolation and repair of security and network incidents
• Features and specifications targeted specifically to mid-size and large companies
• Self-maintaining, embedded database technology that eliminates the need for DB administration
To view photographs of the MX Appliance layout, see the TIBCO LogLogic® LMI Hardware Installation Guide.
LogLogic ST Product Family
Available in compact, rack-mountable systems with up to 8 terabytes of compressed data on on-board storage and interfaces to NAS devices, the ST Appliances archive up to 10 years 11 months of log data while eliminating the need for servers, tape libraries, and archive administrators.
LogLogic Product Families
|
7The ST SAN (Storage Area Network) product offers virtually unlimited archive storage.
When used with LogLogic's LX Appliances, ST Appliances guarantee complete and accurate transmission of network equipment logs from anywhere on the enterprise WAN or LAN. ST Appliances feature an n-Tier architecture controlled by a management console that centralizes long-term log data archival while allowing for distributed log analysis and broader data accessibility.
ST Benefits
ST product family appliances offer the following benefits:
• High volume log data aggregation from centralized and remote log data sources
• Long-term retention of unaltered, complete, raw log messages at a secure, central location to make archives unimpeachable
• Distributed architecture of remote collection and central storage make log data collection and retention infinitely scalable
• Self-maintaining, embedded database technology that eliminates the need for DB administration
To view photographs of the ST Appliance layout, see the TIBCO LogLogic® LMI Hardware Installation Guide.
Scalable Infrastructure
The scalable LogLogic network infrastructure significantly accelerates response time to data center security and availability events, while providing complete log data archives for compliance and legal protection. LogLogic Appliances make log data in enterprise networks truly useful for the first time, improving corporate security, compliance and network availability, while reducing IT costs and costly network downtime, and improving corporate return on IT investment.
Viewing Dashboards
|
9Chapter 2 Viewing Dashboards
LogLogic Appliances let you monitor a large variety of data to observe the system’s status and the widgets saved on your Dashboard.
Topics
• Viewing System Status on page 10
• Viewing Multiple Systems Status (Management Station) on page 15
• Viewing Log Source Status on page 20
• Viewing Log Source Data Trend on page 26
• Managing Your Dashboard on page 27
Viewing System Status
The System Status tab displays a condensed view of the appliance's current state, showing current message rate, CPU utilization, alerts, total message counts, and disk usage (including usage external to the database).
To view system status
1. Choose Dashboards > System Status from the navigation menu.
2. View the following sections on the System Status tab for information about your appliance’s system status:
— Current Message Rate
— New Alerts
— Disk Usage
— CPU Usage
— Message Counters
Detailed descriptions for each section are documented in Table 2 on page 10.
3. Click to expand or collapse a section to display an expanded or condensed version of the section’s status information.
4. Optionally, click the Message Rate tab for a larger view of this graph.
5. For more information, see Viewing Message Rate on page 17.
6. Optionally, click the CPU Usage graph or the CPU Usage tab for a larger version of this graph.
7. For more information, see Viewing CPU Usage on page 18.
8. Click the Refresh button to update the system status information for your appliance.
Table 2 System Status Tab Elements Element Description General information
Uptime Continuous running time since the last reboot of the appliance.
Date/Time Date and time set on the appliance.
Viewing System Status
|
11Software Version LogLogic software release running on the appliance.
Failover (not visible unless issues are present)
Status of the Management Station cluster’s master and standby appliances. If issues exist, they are indicated through flags:
• C: Cluster_id mismatch
• A: Appliance model mismatch
• V: Software version mismatch
• E: Eligible
• H: HA mode
• X: eXcluded
• O: Out-of-cluster
• M: Master
• S: Standby
For example, the failover status line Failover: master 10.1.4.6 (wait), standby 10.1.4.7
(flags:__V/EHX/O) means the master is waiting for the standby, and the standby is running the wrong software version, is configured for failover, is eligible for HA, but is excluded, and (as a result of the version mismatch) is out of cluster.
IMPORTANT! After pairing two appliances in HA, do not change any network settings.
System Status sections Current Message Rate
Measured messages per second rate for the last 1, 5, and 15 minute time segments.
Click on the 1 MIN, 5 MIN, or 15 MIN headings links to change the Message Rate Graph time scale to 2 hour, 12 hour, and 24 hour time scales, respectively.
When using LogLogic TCP for routing logs to the appliance, this graph displays spikes of activity every 5 minutes rather than a steadier line. This is because LogLogic TCP transfers data in regularly recurring chunks that are merged on the appliance, and not continually.
Table 2 System Status Tab Elements (Cont’d) Element Description
Message Rate Graph (Message Rate tab)
Recent message rate over 1, 5, and 15 minute time segments.
The pink line represents the average number of messages per time segment.
The blue line represents the real-time incoming message rate for your appliance.
The red line appears when inbound traffic exceeds the preset threshold
Click the Message Rate tab for a larger view of this graph.
New Alerts (LX/MX only) Number of active alerts over 1, 6, and 12 hour periods categorized by priority.
Disk Usage Usage of the disk on the file system. This can be helpful for calculating data retention time tables, by listing Free and Total available usage.
CPU Usage Current CPU utilization for the last 1, 5, and 15 minute time segments.
Click on the 1, 5, and 15 minute headings to change the CPU Usage Graph time scale to 2, 12, and 24 hour time scales, respectively.
CPU Usage Graph Percent CPU utilization over 1, 5, and 15 minute time segments.
Click the CPU Usage Graph or the CPU Usage tab for a larger version of this graph.
Table 2 System Status Tab Elements (Cont’d) Element Description
Viewing System Status
|
13Message Counters Statistics on each message category stored in the appliance since the last boot. The count corresponds to a percentage of the total number of messages received. This is useful in calculating data retention settings and maximum syslog message rates.
Message categories:
Total Received—Total number of incoming messages for all categories.
Processed—Total number of messages received and parsed into the database.
Unapproved—Messages received from a log source that is not in the Manage Devices table. These messages are discarded. If auto-identify is on, all messages are auto-identified and no messages are unapproved.
Skipped—Total number of messages ignored by the appliance when the log source entry in LMI exists but is disabled.
Dropped—Total number of messages recognized but not processed due to network congestion or a corrupted syslog message.
The following appear only on LX and MX appliances:
Total Parsed—Total number of incoming messages parsed for all categories.
Accepted IP—Total number of messages indicating successful connections through the firewall. For example, PIX® Message Numbers - 302013-302016.
Denied IP—Total number of messages indicating denied access by the firewall. For example, PIX Message Numbers - 106001, 106006, 106007, 106015, 106023.
Security—Total number of messages to be recorded in the Security Event Log report.
System—Total number of messages to be recorded in the System Event Log report.
Generic—Total number of flawed messages received from an approved source. These messages are discarded.
URL—Total number of messages to be recorded to the Web Surfing Activity report.
FTP—Total number of messages to be recorded in the FTP Connections report.
Auth/Access —Total number of messages to be recorded to the VPN Events report.
Table 2 System Status Tab Elements (Cont’d) Element Description
Message Counters (cont’d)
Other—Any message that is not in included in the other listed categories. Messages received from an approved source but contain an unrecognized message number. Certain known messages numbers are discarded.
Updates the system status information for your appliance.
Table 2 System Status Tab Elements (Cont’d) Element Description
Viewing Multiple Systems Status (Management Station)
|
15Viewing Multiple Systems Status (Management Station)
The Management Station System Status is the fastest way to view the condition and status of your appliances as traffic flows through your system. You can use this information to provide for rapid reporting to the operations staff and acquire information about syslog messages at any particular time.
The System Status information uses a proprietary technology for optimizing and then collecting security data for immediate use. Administrators can monitor the CPU usage when necessary to check on its congestion.
To view system status using a Management Station
1. Choose Dashboards > Management Station from the navigation menu.
2. View the following sections on the Management Station tab for information about an appliance’s status:
— Message Statistics
— Message Rate
— New Alerts
— Message Counters
For detailed descriptions of each section, see Table 3 on page 15.
3. Click the Refresh button.to view updated status information for the appliance.
Table 3 Management Station Screen Elements
Element Description
General information
Software Version Management Station appliance’s software version.
Displays the Help topic for this tab.
Management Station sections
Appliances Lists the appliances in your Management Station cluster.
To view the System Status for an Aapliance, click its name.
• A green square indicates the appliance is online.
• A red square indicates the appliance is offline.
• A blank square indicates the appliance entry is being updated.
Message Statistics Displays the following message statistics:
• Total, Processed, Dropped, Unapproved, and Skipped—Message processing information about each managed appliance.
Click a number in these columns to change the displayed value to the nearest thousand, million, or billion value.
Click the ID, Model, or IP columns to sort the appliances as required.
• Message Rate/Sec—Message rate, per second, by time segments of 1, 5, and 15 minutes.
Click on the message rate values to set the Message Rate graph to 4, 12, and 24 hour timescales, respectively.
• Time Skew—Time delta, in seconds, between the Management Station appliance and each remote appliance.
Message Rate Graph Monitors the rate at which messages are collected.
The Message Rate graph displays the current message rate by time segments of 1, 5, and 15 minutes. For example, 1 min – 100 msgs/sec. On ST Appliances, to the right of the minutes is the number of messages per second (xxx msgs/sec) for the appliance. xxx does not reflect the amount of messages that comes in via the LogLogic TCP protocol.
• The pink line represents the average number of messages per time segment.
• The blue line represents the real-time incoming message rate for your appliance.
• The red line appears when inbound traffic exceeds the preset threshold
Table 3 Management Station Screen Elements (Cont’d)
Element Description
Viewing Multiple Systems Status (Management Station)
|
17Viewing Message Rate
The Message Rate tab shows the number of messages processed by the appliance over a 12-hour time period.
To view the message rate of the appliance
1. Choose Dashboards > System Status from the navigation menu.
2. Click the Message Rate tab to view the Message Rate graph.
New Alerts The number of activated alerts, by hour and priority (High, Medium, Low, All).
Click an alert value to show the Aggregated LX or MX Alert Log.
Message Counters Statistics on each message category stored in the syslog database. The count corresponds to a percentage related to the total number of messages received. This is useful in calculating data retention settings and maximum syslog message rates.
The following is a list of message counters:
• Total Received—Total number of incoming messages for all categories.
• Processed—Total number of messages received and parsed into the file system.
• Skipped—Total number of messages ignored by the appliance when the log source entry in LMI exists but is disabled.
• Unapproved—Messages received from a log source that is not in the Manage Devices table. These messages are discarded. The most recent 100 messages are accessible from the Data Sources screen. (If
auto-identify is on, all messages are auto-identified and no messages are unapproved.)
• Dropped—Messages recognized but not processed due to network congestion.
Updates the system status information for your appliance.
Table 3 Management Station Screen Elements (Cont’d)
Element Description
3. If you are viewing a larger version of the Message Rate graph, click the back and forward buttons to display the number of messages during a specific time segment.
For additional information about the graph, see Table 4 on page 18.
4. Click the Refresh button to update the Message Rate graph.
Viewing CPU Usage
The CPU Usage tab contains a graph that shows CPU utilization as a percentage over a 12-hour time period.
To view the CPU usage
1. Choose Dashboards > System Status from the navigation menu.
Table 4 Message Rate Tab Elements
Element Description
Go back 12 hours.
Go back six hours.
Go forward 12 hours.
Go forward six hours.
Displays the corresponding Help topic.
Message Rate section
<blue line> Real-time message traffic which includes UDP syslog and/or raw TCP (SyslogNG) traffic.
<pink line> Average rate of the incoming messages for the time segment shown.
<red line> Appears when inbound traffic exceeds the preset threshold Updates the Message Rate graph.
Viewing Multiple Systems Status (Management Station)
|
192. View the CPU usage by doing one of the following in the System Status screen:
— View the small graph in the CPU Usage section.
— Click on the small graph in the CPU Usage section to view a larger version of the graph.
— Click the CPU Usage tab to view a larger version of the graph.
3. If you are viewing a larger version of the CPU Usage graph, click the back and forward buttons to display the number of messages during a specific time segment.
For additional information about the graph, see Table 5 on page 19.
4. Click the Refresh button to update the CPU Usage graph.
Table 5 CPU Usage Tab Elements
Element Description
Go back 12 hours.
Go back six hours.
Go forward 12 hours.
Go back 12 hours.
Displays the corresponding Help topic.
CPU Usage section
<blue line> CPU usage in real time.
<pink line> Average CPU percent utilization for the time segment shown. To see a larger version of the screen, click the CPU Usage tab.
Updates the CPU Usage graph.
Viewing Log Source Status
The Log Source Status tab lets you view statistics for each source device.
To view the log source status
1. Choose Dashboards > Log Source Status from the navigation Menu.
2. View the following log status information for each source device:
— Name
— IP Address
— Type
— Last Received Time
— Collector Domain
— Total Message Count
— Byte Rate/Sec
— Description
For detailed descriptions of each item, see Table 6 on page 20.
3. Click the Refresh button to update the view of your devices. 4. Optionally, click to print all the items in the list.
Log Source Status Descriptions
Table 6 lists and describes the elements in the Log Source Status tab.
If during auto-discover a device has the same name as an existing device, a random number is appended to the device name.
Table 6 Log Source Status Tab Elements Element Description
Saves the report in a CSV format. You can view the file in Excel as a spreadsheet.
Note: The CSV file saves and displays a maximum of 10,000 lines. A generated report can contain more than this number.
Viewing Log Source Status
|
21Displays the report in HTML format in a new window. You can save the HTML file to your local machine.
Note: The HTML file saves and displays a maximum of 5000 lines. A generated report can contain more than this number.
Saves the report as a PDF file. You can save the PDF file to your local machine. Viewing the generated report as a PDF only works for Adobe Acrobat Reader version 6.0 and higher.
Note: The PDF file saves and displays a maximum of 5000 lines even though the generated report may contain more than this number.
Click to print all the items in the list.
Click to display the corresponding Help topic.
Displays the first page or last page of detail for the device list.
• Displays the previous page of detail for the device list.
• Displays the next page of detail for the device list.
• To display details for a specific page, type a page number and click GO.
Note: For certain pages that display this option, you can only view a set number of rows. To set the number of rows to view, use the Personal Preferences tab.
Log Source Status section (all of the following columns are sortable) Name Name of your source device. The format for this field is
<collector domain id>_<ip address>_ <device type> for example 1_10.10.10.10._windows.
IP Address IP address for your source device.
Type Type of source device.
Table 6 Log Source Status Tab Elements (Cont’d) Element Description
Last Received Time
• For File based devices, time displayed will show that the last event processed time
• For Syslog based devices, time displayed will show when the last event was received
Collector Domain This is the name used to identify each message sent from a specific device. This can either be the Collector Domain name added in the LogLogic Universal Collector or the name specified in the LMI when the device was added.
Total Message Count
The following types of messages counts:
Total—Total number of messages processed for the specified device.
• 1 Min—Total number of incoming messages during the previous one minute period.
• 5 Min—Total number of incoming messages during the previous five minute period.
• 15 Min—Total number of incoming messages during the previous 15 minute period.
1 Min (Byte Rate/Sec)
Byte rate per second for each device during the previous one-minute period.
Description Description you defined for the Source Device in the Management > Devices > Devices tab and the
Management > Check Point Configuration > Interfaces tab.
If you selected the Auto-identify Log Sources option in the Administration > System Settings > General tab, the system displays that the source device is an auto-identified log source.
Updates the view of your devices. If auto-identify is enabled and the appliance detects new devices, refresh displays them in this view.
Table 6 Log Source Status Tab Elements (Cont’d) Element Description
Viewing Log Source Status
|
23Advanced Options
By default, all these options are displayed:
• Name
• IP Address - supports /prefix length <0-32> for IPv4 and / prefix length <0-128> for IPv6. The field supports the Classless Inter-Domain Routing (CIDR) notation for IPv4 and IPv6. Available options include:
— equals - only returns the pattern entered
— not equals - returns everything but the entered pattern
— in - several patterns may be entered separated by a comma, all matches will be returned
— not in
— like - like behaves the same way as "in"
— not like
Note: The use of asterisks (*) is no longer supported.
• Type
• Last Received Time
• Collector Domain
• Total
• 1 Min
• 5 Min
• 15 Min
• 1 Min (Byte Rate/Sec)
• Description
Use the drop-down menu to view options in ascending or descending order.
Deletes all text in the Advanced Options text boxes.
Executes with the defined Advanced Options parameters.
Table 6 Log Source Status Tab Elements (Cont’d) Element Description
Viewing Unapproved Messages
Use the Unapproved Messages tab to view information on up to 100 of the most recent real-time messages received from a recognized but unapproved source.
Unapproved messages are discarded.
Summary data on unapproved messages can be seen from the Dashboards >
System Status tab.
To view unapproved messages
1. Choose Dashboards > Log Source Status from the navigation menu.
2. Click the Unapproved Messages tab.
3. This section contains the following elements.
4. Click the Refresh button to update the information. 5. (Optional) Click to print all the messages in the list. 6. (Optional) Click to open the Help topic.
Viewing Recent Messages
Use the Recent Messages tab to view information on up to 100 of the most recently-received real-time messages.
Messages from all file-based data are not listed here because they are not treated as real-time messages.
Table 7 Unapproved Messages Tab Elements Element Description
No. Number assigned to the message.
Time Time the message was received.
IP Address IP address of the appliance through which the message was received.
Message Text of the message.
Messages from all file-based data are not listed here because they are not treated as real-time messages.
Viewing Log Source Status
|
25To view recent messages
1. Choose Dashboards > Log Source Status from the navigation menu.
2. Click the Recent Messages tab.
This section contains the following elements.
3. Click the Refresh button to update the information. 4. (Optional) Click to print all the messages in the list. 5. (Optional) Click to open the Help topic.
Table 8 Recent Messages tab descriptions Element Description
No. Number assigned to the message.
Time Time the message was received.
IP Address IP address of the appliance through which the message was received.
Message Text of the message.
Viewing Log Source Data Trend
The Log Source Data Trend tab displays the graphs of incoming Syslog Data rate in MB from all sources over the last 24 hours. The top graph displays Realtime Logs, and the bottom graph shows File Transfer Logs. Log data that has been fully indexed is represented by blue bars; log data to be indexed is represented by orange bars. The bar graphs refresh once per minute.
To view log source data trend
1. Choose Dashboards > Log Source Data Trend from the navigation menu.
2. View the Syslog data from all sources within the last 24 hours as shown below.
Managing Your Dashboard
|
27Managing Your Dashboard
The My Dashboard menu allows you to customize your Dashboard with visualizations, known as “widgets”, representing report results, search results, alerts, and appliance performance. For example, If you have an index search showing web surfing activity within the Intranet, this data can be presented on your Dashboard using the Trend Graph widget, and refreshed periodically with recent data from an Index Search.
The system admin can specify the maximum number of widgets that can be displayed on your Dashboard using the Administration > System Settings >
General tab.
Widget Types
You can create different types of widgets to add to your dashboard canvas. The different types are:
• Summary: Displays top 10 results from any Report saved with the
“Summarized” option. It also displays All Index Reports as well as Index Searches that are grouped by option (except grouped by Time). For details, see Managing Summary Widgets on page 29.
• Trend: Displays a trend of Index Search “hits” occurring over a period of 1 day, 1 week or 1 month. For details, see Managing Trend Widgets on page 32.
• Alerts: Displays recent triggered alerts matching your specified filters. For details, see Managing Alert Widgets on page 36.
It is possible to exceed the recommended number of widgets (10) on your My Dashboard. However, graphical errors may result in the data displayed. Similarly, if you set the amount of data to be displayed inside each widget beyond the recommended value of 10, graphical errors may result.
• System: Displays Network and File based data ingest trends, Disk usage, and CPU usage utilization. For details, see Managing System Widgets on page 38.
About My Dashboard
By default, the dashboard canvas displays some pre-configured widgets. The Widgets link enables you to add widgets to your dashboard. A new widget is always added on the upper left side on your dashboard canvas. If a widget is already added to the dashboard, you cannot add the same widget to the
dashboard again. For detailed information about widgets, see Managing Widgets on page 28.
To view your dashboard
1. Access Dashboards > My Dashboard from the navigation menu.
2. View your My Dashboard canvas.
Managing Widgets
The Dashboard is highly customizable with widgets and data of your selection.
The Widgets link allows you to view and add existing widgets to your dashboard, create new widgets, edit existing widgets settings, or remove widgets from the system.
• The widget list is only populated by reports. Therefore, you must save a report before you can create a widget.
• Imported Compliance Suites are templates and not reports. Hence, you need to save one in order to populate in the Widget list.
• Widgets show data from time periods as specified (Once every few hours, Once a day, Once a week, and Once a month). The widget data is refreshed after the time period has completely passed. For example: If you specify Once a day time frame, and feed data at 2:17pm, the widget data will be refreshed after midnight. Similarly, if you specify Once a week time frame, then the widget data will be refreshed after Sunday midnight.
• Widget report is always executed according to its schedule. Only when a widget is first created, and added to dashboard, the widget report executes outside the schedule. Therefore, If you wish to modify a widget report schedule, first delete the widget, and then re-create a new widget with new schedule.
The NAS/SAN Disk Usage widget will display only on the ST Appliance.
Managing Your Dashboard
|
29Using the drag-drop method, you can change the position of widgets on your Dashboard. Click and drag the widgets title bar to move a widget to a new location on the canvas. You can also resize any widget by pulling the bottom side of the widget. The system automatically saves your latest widget positions with your LogLogic User Account.
Depending on the widget type, some widgets display different buttons on the upper right corner of the widget.
Table 9 lists and describes the widget buttons
By default, widgets are created exclusively for your use. However, you can share your widgets with others by checking Shared option on the widget's settings screen. Sharing Report and Search widgets improves system performance, since the underlying data used for the visualization only needs to be created once for all Dashboard views of the Widget.
Managing Summary Widgets
The summary widgets provides focused visualization of first 10 records returned from the underlying Saved Report query.
Table 9 Widget buttons
Button Description
Shows the toolbar for that widget. Using this toolbar, you can view different presentation options of the selected report. For example, for Summary widget, you can choose to view Column chart, Bar chart or Table format.
Displays the widget in full screen view. If it is already in full screen view, this will restore the widget to normal size.
Displays the widget’s existing settings. Click the button to open the Edit widget settings window. This allows you to change the widget’s existing settings.
Removes the widget from your Dashboard. However, the widget is still available in the widget list to use on other dashboards.
Select the color of the widget ‘s graph from a color palette.
Note: From the widget toolbar, this button is available only for certain widget types.
If you click , the report displays more view options such as Column Chart, Bar Chart, Table, Axis Label, and Drilldown. The Drilldown button takes you to the actual report page where you can run the report with the same log sources.
The time frame on the widget is defined separately than the actual report’s time range. Similarly, when a widget is shared and if you don’t have similar privileges as the widget owner, you may not be able to view the same data as displayed in the widget.
For more information on other widget buttons, see Table 9 on page 29.
To add an existing summary widget to your dashboard
1. Access Dashboards > My Dashboard > Widgets from the navigation menu.
2. Click the icon to begin adding a widget. The Widgets pane appears.
3. Click the Summary icon. A list of existing summary widgets, if any, is displayed in the second pane.
4. Select the widget from the list. The widget’s settings are displayed for your review in the third pane.
5. Click Add to Dashboard to add the widget to your dashboard.
To create a new summary widget
1. Navigate to the Dashboards > My Dashboard > Widgets menu.
2. Click the icon to begin adding a widget. The Widgets pane appears.
3. Click the Summary icon. A list of existing summary widgets, if any, is displayed in the second pane.
4. Click the Create New link to create a new widget. The new widget settings pane appears.
5. Enter the Name and Description of the widget.
6. Select a report from the Report list as explained in Table 10.
If a widget is already added to the dashboard, you cannot add the same widget to the dashboard again.
To create a summary widget, you must have the Reporting privileges. For more information about privileges, see Managing Users in the TIBCO LogLogic® LMI Administration Guide
Managing Your Dashboard
|
317. Specify a Timeframe as explained in Table 9.
8. Click the Save Settings button to save the widget’s settings. The widget is now listed in the saved widget list. Click Add to Dashboard button to add the widget to your dashboard.
Or,
Click the Save & Add to Dashboard button to save the settings and add the Table 10 Summary Widgets Elements
Element Description
Name Name of your widget that is displayed on the widget Title bar.
Description Description of your widget.
Shared Select the checkbox if you want to share your widget with others.
However, only the creator can edit this widget settings.
Selected Displays the selected report from the Report list. When the report is not selected, None is displayed.
Enter text to filter Enter the text to filter Report list and then press Enter.
Report list By default, the following columns are displayed:
Type--the report template type, for example, User Access Name--the name of the report
Description--the description of the report
Click on the column heading to sort the table by that column to view in ascending or descending order.
Timeframe section
Run Specify the time frame to refresh the widget’s report results. The options are:
Once every few hours Once a day
Once a week Once a month
Note: Depending on the above selected Run option, the
corresponding following fields may change. For example: If you select Once a week option, specify time, and day of the week.
Specify the appropriate intervals.
To edit an existing summary widget’s settings
1. Select a widget from the saved widget list.
2. Make the appropriate changes.
3. Click the Save Settings button to save the new settings.
Managing Trend Widgets
The Trend widget displays a trend of Index Search “hits” occurring over a period of 1 day, 1 week or 1 month.
If you click , the report displays more view options such as Column Chart, Line Chart, and Drilldown. The Drilldown button takes you to the actual report page where you can run the report with the same log sources. The time frame on the widget is defined separately than the actual report’s time range. Similarly, when a widget is shared and if you don’t have similar privileges as the widget owner, you may not be able to view the same data as displayed in the widget.
For more information on other widget buttons, see Table 9 on page 29.
Only the creator of the widget can edit that widget’s settings.
The Save & Add to Dashboard button is available only when the widget is not on your dashboard.
Managing Your Dashboard
|
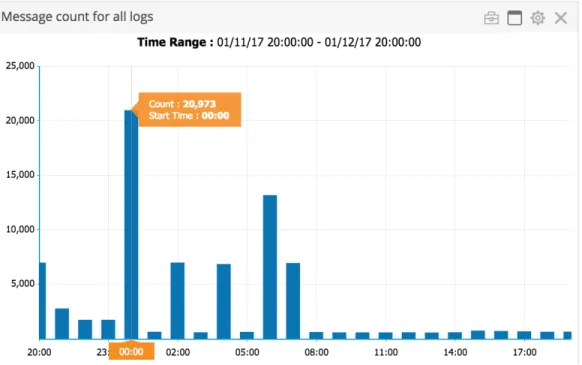
33Figure 1 Trend Widget Example
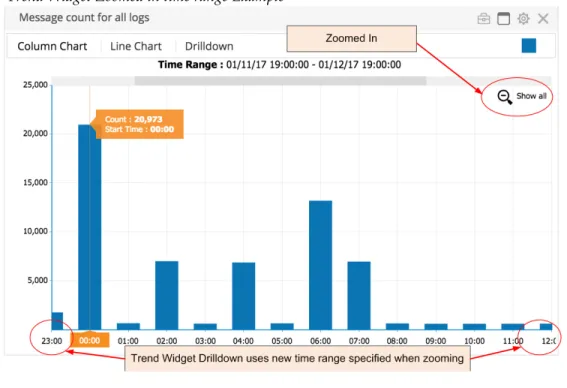
Trend widgets allow you select a time range and zoom in to the data. When you specify a time range on the widget, the Drilldown option will use the same time range to display the report. If the chart is zoomed in, the zoomed time range will be used if you click the Drilldown option.
Figure 2 Trend Widget Zoomed in time range Example
To add an existing trend widget to your dashboard
1. Access Dashboards > My Dashboard > Widgets from the navigation menu.
2. Click the icon to begin adding a widget. The Widgets pane appears.
3. Click the Trend icon. A list of existing trend widgets, if any, is displayed in the second pane.
4. Select the widget from the list. The widget’s settings are displayed for your review in the third pane.
5. Click the Add to Dashboard link to add the widget to your dashboard.
To create a new trend widget
If a widget is already added to the dashboard, you cannot add the same widget to the dashboard again.
To create a trend widget, you must have the Index Search privileges. For more information about privileges, see Managing Users in the TIBCO LogLogic® LMI Administration Guide.
Managing Your Dashboard
|
351. Access Dashboards > My Dashboard > Widgets from the navigation menu.
2. Click the icon to begin adding a widget. The Widgets pane appears.
3. Click the Trend icon. A list of existing trend widgets, if any, is displayed in the second pane.
4. Click the Create New button to create a new widget. The Widgets pane appears.
5. Enter the Name and Description of the widget.
6. Select a saved search from the Search list as explained in Table 11.
7. Specify the Trend Range as explained in Table 11.
Table 11 Trend Widgets Elements Element Description
Name Name of your widget displayed on the widget Title bar.
Description Description of your widget.
Shared Select the checkbox if you want to share your widget with others.
However, only the creator of the widget can edit the settings.
Selected Displays your selected search. When the search is not selected, None is displayed.
Enter text to filter Enter the text to filter the saved search settings and then press Enter.
Search List By default, all these columns are displayed:
Type–the report template type, for example, User Access Name–the name of the report
Description–the description of the report
Click on the column heading to sort the table by that column to view in ascending or descending order.
Trend Range section
Tiimespan Specify the timespan from the drop-down menu. The options are:
• 1 Day
• 7 Days
• 30 Days
8. Click the Save Settings button to save the widget’s settings. The widget is now listed in the saved widget list. Click Add to Dashboard button to add the widget to your dashboard.
Or,
Click the Save & Add to Dashboard button to save the settings and add the new widget to your dashboard.
To edit an existing trend widget’s settings
1. Select a widget from the saved widget list.
2. Make the appropriate changes.
3. Click the Save Settings button to save the new settings.
Managing Alert Widgets
The Alert widget displays recent triggered alerts matching your specified filters.
If you click , the report displays more view options such as Enable, and Disable. For more information on other widget buttons, see Table 9 on page 29.
To add an existing alert widget to your dashboard
1. Access Dashboards > My Dashboard > Widgets from the navigation menu.
2. Click the icon to begin adding a widget. The Widgets pane appears.
3. Click the Alerts icon. A list of existing alert widgets, if any, is displayed in the second pane.
4. Select the widget from the list. The widget’s settings are displayed for your review in the third pane.
Only the creator of the widget can edit that widget’s settings.
The Save & Add to Dashboard button is available only when the widget is not on your dashboard.
If a widget is already added to the dashboard, you cannot add the same widget to the dashboard again.