行政院國家科學委員會專題研究計畫 成果報告
應用雲端運算技術於建構隧道檢監測資訊系統之研析 研究成果報告(精簡版)
計 畫 類 別 : 個別型
計 畫 編 號 : NSC 100-2221-E-011-114-
執 行 期 間 : 100 年 08 月 01 日至 101 年 07 月 31 日 執 行 單 位 : 國立臺灣科技大學營建工程系
計 畫 主 持 人 : 謝佑明
計畫參與人員: 碩士班研究生-兼任助理人員:鄒昌佑 博士班研究生-兼任助理人員:潘茂森
報 告 附 件 : 出席國際會議研究心得報告及發表論文
公 開 資 訊 : 本計畫可公開查詢
中 華 民 國 101 年 10 月 31 日
中 文 摘 要 : 本研究探討以雲端運算技術串連隧道檢監測之上、中、下 游,其上游為隧道檢測資料之收集、中游為雲端運算技術架 構之隧道檢監測資料儲存管理平台、下游則為三維互動式隧 道檢監測資料視覺化系統。
由於隧道檢監測資料為維護隧道安全與維護工程實施之重要 參考依據,因此其資料保存甚為重要,需要一能長期運作、
可靠保存之資訊管理系統。因此本研究以雲端運算技術建構 隧道檢監測資料之儲存管理平台,利用雲端運算技術可存取 之大量電腦資源,以達到永續運作與資料可靠儲存的目的,
並作為長期累積隧道檢監測案例之碁石。待雲端運算資料儲 存管理系統建立後,則利用其為案例資料庫,並開發一隧道 與檢監測視覺化系統,利用先進之電腦視覺化技術將隧道之 1) 檢監測資料、2) 基本幾何資料、3) 地形地質資料進行融 合後呈現,以協助使用者能深入瞭解檢監測資枓以利於隧道 異狀之辦識。
本研究透過 MongoDB 雲端資料庫管理系統作為基底,儲存研 究案例之基本資料與檢監測資料,並依所收集得到之案例資 料研擬適當的資料模型。為便利資料庫存取程式之開發,本 研究研析了資料庫存取的共通模式,並使用 PHP 撰寫程式產 生器,解析以 JSON 格式定義之資料綱要,並依其自動產生 C++程式之資料存取介面。本研究利用 Qt 類別庫開發使用者 介面以達到友善的使用者與資料庫互動介面,最後使用 VTK 繪圖類別庫,將隧道之基本幾何資料、地形資料與檢監測資 料進行融合後呈現,最後建立使用者與資料之間的操作互 動。
中文關鍵詞: 雲端運算、隧道檢測、隧道監測、資訊系統、視覺化、電腦 繪圖、虛擬實境
英 文 摘 要 : This research project investigates the use of cloud- computing to streamline the process of tunnel
inspection and monitoring. The inspection and
monitoring data originated from field operations, and they need to be managed, maintained, and utilized. We use cloud-computing platforms to help manage and maintain field data. The stored data are then visualized and utilized by an interactive, three- dimensional visualization system developed in this project.
Tunnel inspection and monitoring data are important for tunnel safety and maintenance. It is necessary to
store these data sustainably and reliably. This project proposes the use of cloud computing to construct a data storage and management information system for such purpose. Cloud computing enables the access to large computation resources through the Internet to maintain sustainable operations and reliable storage, and layouts a firm foundation for accumulating tunnel inspection and monitoring data in the long run. The stored data need to be effectively used. Thus, a visualization system is developed to fuse and visualize tunnels' 1) inspection and monitoring data, 2) basic geometrical data, 3) geological condition, and 4) host mountain's
topography. Visualization enables deep understanding of the data, facilitates communications between users, and help users identify the cause of anomalies.
MongoDB, a cloud-based database management system, is used in this work for sustainable data storage. A visualization system written in C++ helps utilize the inspection and monitoring data. The system has a friendly graphical user interface developed using Qt class library, and its visualization is done using VTK. Furthermore, code generators were created using PHP to generate C++ classes for accessing MongoDB.
英文關鍵詞: cloud computing, tunnel inspection, tunnel monitoring, information system, visualization, computer graphics, virtual realty
1
一、動機與目的
台灣地區有三分之二的面積屬於山地,為了交通、灌溉等需求,台灣有許多的公路、鐵路、捷運、
引水等用途的隧道。隧道內發生嚴重損壞時,則必需在隧道損害段特別去注意方能得知。因此,隧道 安全之檢監測作業是十分重要的。隨著台灣地區隧道逐漸老化,隧道之檢監測技術以及檢監測資料之 管理技術必需提升,檢監測必需定期進行,以維持使用人的安全。
根據文獻[1]中記載,每 100 公尺之隧道分作 30 環,每環約拍攝 11 – 15 張數位相片。以某隧道 全長約 310 公尺為例,則大約需要 90 環,且每環以 13 張相片計算,共需 1170 張數位相片,以每張 相片之檔案大小為 10MB(Megabyte)進行計算,則需要約 12GB(Gigabyte)的空間來儲存隧道襯砌影像 之原始資料。若進行影像、色彩校正等影像處裡過程,將會需要額外的空間進行儲存,由此案例可得 知,進行一次隧道檢測測量至少需要 24GB 以上的儲存空間。且根據文獻[2],統計截至 2003 為止的 台灣地區非軍事用途隧道,長度已達 821.7 公里,如欲進行全面性隧道檢監測,且不考慮隧道半徑差 異的話,由以上推估可知欲儲存原始影像資料與影像處裡後的資料,將會需要大約 61TB 的資料量。
所以我們除了需要一個龐大的儲存空間來存放基本的檢測資訊以外,還需要能夠設計一個完整的資料 儲存架構與持續穩定服務的系統,保持數據不會因硬體損壞因素而遺失。
國內外的隧道維護管理系統,針對檢監測數據提供,異狀繪製平面、檢監測資料數據記錄、基本 檔案的匯入等功能,功能已經相當多,且於視覺化方面也有些許應用,如繪製隧道異狀資訊、照片預 覽功能等,但皆無考慮地形觀察與結合隧道實境進行觀察。而現行的隧道異狀判釋,主要依據平面隧 道襯砌展開圖進行判讀,並使用其它的檢測與監測資料來協助判讀,在判釋時,如圖 1 所示,使用者 必需能綜整不同的檢監測資料,而不同的資料往往存在不同形式的檔案或格式,因此會考驗其短暫記 憶的能力。而傳統的二維展示方式方,更考驗使用者的空間推理能力。且根據不同的判讀者對於資料 的認知不同,容易產生溝通上的問題,所以如果能夠使用三維互動視覺化的方式進行判讀,有助於使 用者對資料的理解[3]。
本研究除了解決資料綜整的問題外,由於隧道檢監測資料為維護隧道安全與工程實施之重要參考 依據,且儲存的資料將會隨著時間越來越多,若伺服器主機穩定性不足或是容量不足,將會降低系統 的服務水準,且若資訊系統沒有進行適當規劃與資料的備份機制,將會造成檢監測資料無法存取或遺 失的問題。因此,本研究的目的之二即在於建立長期運作且可靠的維護管理系統,讓使用者能夠進行 如圖 2 之隧道資訊的管理與維護[4]。而本研究則使用雲端運算相關技術以解決於龐大的隧道檢監測 資料之管理維護相關困難。並結合電腦視覺化技術,將隧道之基本幾何資料、地形資料與檢監測資料 進行融合後呈現,可針對隧道外進行地形環境的觀察,並進入隧道內進行虛擬實境式之探查,最後將 檢監測資訊整合於視覺環境當中,並設計使用者與資料之間的互動方式。
2
圖 1 傳統異狀判釋方式 圖 2 維護管理資料系統概念圖[4]
二、文獻探討
2.1 隧道檢監測作業技術與記錄格式
目前國內針對隧道結構安全檢測,已採用目視測繪與全斷面掃描等方式進行初步調查,而異狀顯 著處進行襯砌調查或混凝土取樣及強度試驗等調查[5, 6] ,嚴重者進行混凝土鑽孔及強度試驗等二次 檢測或詳細檢測,並且針對試驗結果實施補強措施,並根據不同的階段,將使用不同的作業技術。此 外,監測系統的配置,通常由業主單位委託進行探查與設置監測儀器並進行監控與改善的規劃。常見 的監測項目有地中傾斜管、水壓計、結構物傾斜計、地錨荷重計及雨量計等五項監測儀器,且針對每 個項目在不同地點設置多個監測儀器[7]。然過去鮮少探討適當的資料模型以統合不同監測儀器之資 料與數據。
2.2 隧道維護管理資訊化現況
國外在十數年前即已注意到應將隧道之維護管理予以資訊化。美國 FTA (Federal Transit
Administration) 於 2001 年己提出的隧道管理系統應含有檢測、管理、維護與修復等四大功能,並進 行規劃。針對國內隧道檢監測的資訊化記錄系統,於 2007 年時由聯合大地工程顧問公司開發出的集 集隧道維護管理系統[8],之後於中興工程顧問社運用 VB.NET 與 X3D 程式語言,發展了隧道營運維 護管理系統[9]。台北捷運則由設施維護管理的角度,建立一套台北捷運之維護管理系統[10]。
2.3 雲端技術與 NoSQL 資料庫管理系統
根據美國國家標準局(NIST, National Institute of Standards and Technology)針對雲端的定義[11],雲 端應該具備五大特徵(5 Characteristics)、可分為四個佈署模型(4 Deployment Models)與三種可能服務模 式(3 Service Models)。而雲端運算本質上即為分散式運算(Distributed Computing),強調使用可透過網 路存取之運算資源來解決問題或提供服務,如資料雲的概念[12]。
許多新一代的網站系統如 Facebook、Google 等大型網站,為了解決存取或處理大量資料時的效 能問題,捨棄了關聯式資料庫技術,改用 NoSQL 資料庫來提升效能與擴充彈性[13]。目前已開發出 之 NoSQL 資料庫系統可大致分為鍵值資料庫(Key-Value store)、圖形化資料庫(Graph)與文件型資料庫 (Document store)等,其中以鍵值資料庫是最常看到的,最大特色就是採用 Key-Value 的資料架構,並 且每筆資料各自獨立,以 BigTable、HBase、Dynamo、Cassandry、Hypertable 等屬於 Key-value 這類 的資料庫。而文件型資料庫較適合儲存非結構性的文件,也就是欄位較不像表格般固定,其中的代表 以 MongoDB、Riak、CouchDB 等。而圖形化資料庫專門用來處裡樹狀或網狀結構較適合,像是地理 資訊系統或者複雜關係的系統,其中的代表以 Neo4j、InfoGrid 等為主[14]。而在選擇 NoSQL 資料庫 時,可依據應用之需求,考量分散式系統中 CAP(Consistency、Availability、Partition Tolerance) 等三 特性之比重[15]加以選擇。而本研究認為 MongoDB 相當適合於建置隧道檢監測資料庫。
2.4 虛擬實境與視覺化技術
虛擬實境(VR, Virtual Reality),為利用電腦模擬產生一個三維的虛擬空間,提供使用者自然與即 時地觀察三度空間內的事物,如同身歷其境進行視覺等感官的模擬。於隧道工程方面,中興工程顧問 社應用虛擬實境技術,結合了 VB.NET 與 X3D 程式語言開發三維視覺化模組[9],能夠提供管理者更 擬真的隧道實況資訊。然由由於其利用 X3D 建置虛擬實境之場景,將會受限於其檢視器(viewer)提供 之功能,可能無法有效提供檢監測資訊。
本研究針對隧道的專案進行建模與資料呈現的動作,使用者可進行整個隧道專案的概觀預覽,與 走進隧道內部進行資料勘查。而上述的功能皆可使用 VTK 所提供的類別去協助完成,此外 VTK 架
3
構下也有提供一些類別去協助數學運算(ex.內插計算、座標格式轉換),與方便的互動工具(Widgets),
增加不少程式開發的速度,也減少了許多複雜的運算流程[4]。
三、資料庫與系統規劃
3.1 系統架構與功能設計
本系統主要為針對隧道檢測專案進行 Mongo 資料庫設計,與針對資料庫存取的共通概念,利用 C++物件導向的方式規劃資料庫中共通的存取介面,並利用 JSON 與 PHP 輔助存取介面類別的自動產 生。再來針對使用者與資料庫之間,使用 Qt 進行介面(GUI)的開發,最後將特定的資料通過視覺化方 式使用 VTK 繪製後,呈現給使用者如圖 3。
圖 3 整體架構概觀
本研究整理出於此研究所需要的功能,根據這些功能去整理與規劃出資料庫所需要儲存的資料。
其中功能規劃 (1)建立/預覽專案基本資料 (2)隧道事件記錄 (3)建立/預覽專案環境資訊 (4)預覽檢測 資訊與資料 (5)輸入檢測資料 (6)建立隧道斷面與線型資料 (7)建立監測儀器資訊 (8)調閱監測資訊 與資料 (9)視覺模擬功能 (10)DEM 資料上傳
3.2 資料庫規劃
本系統將資料庫的 collection 分為三大類,第一類為隧道專案資料儲存,主要負責儲存隧道名稱、
起始里程等資料。第二類為檢測與監測資料。第三類屬於型態、項目或類別類型的資料。圖 4 為本 研究所開發之系統的資料庫模型。其中:
(1) db.Tunnel: 用於儲存隧道專案基本資料、周邊環境資料,與建構視覺模擬所需要的基本資訊,如 斷面資料與線形等。
(2) db.DEMCollection: 用於儲存建構三維視覺化模擬所需要的 DEM 資料。
(3) db.MonitorInformation: 儲存監測儀器資料與監測儀器所記錄的資訊,其中監測儀器資訊中儲存之 儀器座標可運用於三維模擬環境中。另外此 Collection 可用於儲存外部匯入資料(ex.中央氣象局 雨量資料)所運用。
(4) db.InspectionInformation: 用於儲存檢測記錄與檢測位置,其中檢測位置將顯示於三維視覺模擬環
4
境。另外特別的是,本論文將檢測的資料分為三種型態,分別為評等式資料、描述式資料與連續 式資料。
(5) db.Tunnel_Type: 記錄隧道的型態所用 (ex.公路隧道、鐵路隧道等)。
(6) db.Event_Type: 記錄事件型態所用 (ex.地震事件、爆炸事件等)。
(7) db.Monitor_Item: 記錄監測儀器的類型 (ex.地中傾斜儀、雨量計等)。
(8) db.InspectionType: 記錄檢測的型態 (ex.平時檢測、臨時檢測等)。
(9) db.Unit: 記錄於隧道檢監測資料中可使用的單位 (ex. mm、cm)。
(10) db.AdminstrativeRegion: 記錄行政區域所使用 (ex.台北市、新北市等)。
(11) db.Environment_Image_type: 記錄環境影像類型 (ex. 地形圖、空照圖等)。
圖 4 本系統資料庫模型
db.Tunnel
_id: string, Name: string, StartMileage: string, EndMileage: string, Length_M: double, OpeningDate: Date_t, Type: string, Note: string,
BenchmarkCoordinate: [double], MonitorDBRef: [string], InspectionDBRef: [string], TunnelEvent: [{
Name: string, Date: Date_t, Type: string, Location: string, Who: string, What: string, How: string }],
TunnelFile:[{
Name: string, Note: string, Keyword: [string]
}], TunnelImage:[{
Title: string, StartMileage: string, EndMileage: string, Date: Date_t, FileName: string, type: string }],
EnvironmentInfo:{
AdminstrativeRegion: string, TerrainOverview: string, GeologicalOverview: string, NearEngineeringOverview: string, Note: string,
EnvironmentImage:[{
Title: string, Date: Date_t, Contents: string, Scale: string,
SourceStartMileage: string, FileName: string, Type: string }]
}, Geometry:{
CrossSectionalShape:[{
Order: int, Coordinate: [double]
}], Linear:[{
Order: int, Coordinate: [double]
}]
}, Abnormal:[{
IsOutside: string, AbnormalStartMileage: string, AbnormalEndMileage: string, Coordinate: [double], AbnormalType: string, Description: string, Observed: Date_t, Point:[double]
}]
db.MonitorInformation
_id: string, MonitorItem: string, BenchmarkElevation: double, AutoRecode: string, MonitorCoordinate: [double], IsOutside: string, DataName: [string], DataUnit: [string], MonitorData: [{
DID: string, DateTime: Date_t, Value: [double]
}]
db.DEMCollection
_id: int, x: double, y: double, z: double
db.InspectionInformation
_id: string, MethodName: string, InspectionType: string, DateTime: Date_t, StartMileage: string, EndMileage: string, Degree: double, Coordinate: [double], Detector: string, Note: string, DescriptionData:[{
DescriptionItem: string, DescriptionContents: string }],
ContinuousData:[{
DataName: string, DataUnit: string, Value: double }],
RatingData:[{
RatingName: string, RatingValue: int }],
Marks: [{
Type: string, Name: string, Note: string }],
InspectionImage:[{
PictureTitle: string, Date: Date_t, Contents: string, Note: string, StartMileage: string, EndMileage: string, FileName: string, Item: string }]
db.Tunnel_Type
_id: string
db.Monitor_Item
_id: string, NumberOfValue: int
db.Event_Type
_id: string
db.Environment_Image_Type
_id: string
db.InspectionType
_id: string
db.Unit
_id: string
db.AdminstrativeRegion
_id: string
Reference Reference
5
3.3 系統運作架構
本研究整體架構以顏色細分為六大部分 1)黃-隧道基本資訊儲存架構 2)綠-環境資料儲存架構 3) 粉紅-檢測資料儲存架構 4)藍-監測資料儲存架構 5)紅-三維模擬程式架構 6)白-其它類別。其中,隧 道基本資訊儲存架構專門用來存取隧道基本資料所使用,並且於程式使用前,用於選擇隧道所用,為 整個資訊系統之核心,架構如下圖 5; 環境資料儲存架構專門用於存取隧道環境周邊資料所用,屬於 隧道基本資料中的一個附屬資料,由於此架構與檢監測資料於資料庫中的架構較為不同(屬於 reference 類型),而環境資料在資料庫架構中屬於隧道基本資料的嵌入設計,架構於圖6; 檢測資料儲 存架構進行隧道檢測資訊的存取,隧道檢測的資料較複雜,且資料多樣化,本程式除了設計資料存取 介面進行數據預覽所用,另外將針對視覺化的部分,嘗試將檢測資訊放入三維模擬的環境當中如圖 7; 監測資料儲存架構 針對隧道周邊的監測資料進行存取,由於監測資料分為手動記錄與自動記錄兩 種方式,差異在於記錄的時間頻率不同,於此論文中,將以手動資料做為例子進行建置,並保留自動 記錄所需要的限制如圖 8; 三維視覺模擬程式架構三維視覺模擬為本論文其中一個重要的架構,本論 文將針對隧道的斷面資料與線型資料,配合 DEM 模型建置三維環境,並將監測資料繪製至三維環境 中,提供直接預覽,並嘗試將檢測資料也放置於三維環境中如圖9; 其它類別此部分是對於一些共用,
或者為了進行視窗控制所用,但並不屬於前任何五大類別如圖10。
圖 5 隧道基本資訊程式架構圖 圖 6 環境資料程式架構圖
Qt
Abnormal
Event_Type Tunnel_Type Tunnel
TunnelEvent TunnelFile
TunnelImage
CreateEvent
CreateEventTyoeView CreateTunnel CreateTunnelType
SelectTunnel
TunnelEvents TunnelInfo
1 0..*
1
0..*
10..*
1
0..*
1 0..*
1 0..*
MainWindow
1 0..*
1 0..*
1 0..*
1
0..* EnvironmentInfo
Geometry 1
0..1 1
0..1
1 0..*
A B A uses B
A has B (Composition)
A B
1 0..*
Qt
AdminstrativeRegion
EnvironmentInfo EnvironmentImage AdminstrativeRegionView
CreateEnvironmentImageType
EnvironmentInfoView uploadenvironmmentImage
Environment_Image_Type
1 1 0..*
0..*
Tunnel 1
0..*
10..*
1 0..*
A B A uses B
A has B (Composition)
A B
1 0..1
6
圖 7 檢測資料程式架構圖 圖 8 監測資料程式架構
圖 9 三維視覺模擬程式架構圖 圖 10 其它類別圖
另外 WGS84_TWD97TM2_Transform 用於 WGS84 轉成 TWD97 之格式所使用,本論文於視覺環 境中所使用的皆為 TM2 的座標系統,然實務上許多資料乃以 WGS84 座標系統儲存,因此必需進行 座標轉換。本研究使用 Proj[16] 函式庫解決座標轉換之問題。
3.4 自訂義資料庫存取介面
本研究針對資料庫的開發與規劃本系統所需要的功能後,發現其中有許多通用的模式去進行資料 的存取與尋找,經過整理後可分為 (1)FindDB(尋找資料)、(2)SaveDB(儲存資料)、(3)UpdateDB(更新 資料)與 (4)針對 Collection 本身所包含的 Object(物件)或 Array Object(陣列裡面包含物件)進行新增與 刪除的功能。所以利用物件導向設計模式,撰寫 PHP 程式,利用其解析以 JSON 格式定義之資料模
Qt
InspectionInformation
RatingData
ContunuiusData DescriptionData
InspectionImage
InspectionType AddInspection
CreateInspectionType InspectionInfoView
1 0..*
1 0..*
1 0..*
1
0..*
1 0..*
Tunnel Tunnel3D
1
0..1
WGS84_TWD97TM2_Transform 1
0..*
1 0..*
A B A uses B
A has B (Composition)
A B
A B
1 0..* A has B (Aggregation)
Marks 1
0..*
Qt
Monitor_Item MonitorInformation
MonitorData AddMonitorData
CreateMonitor
MonitorInfo MonitorItem
1 0..*
Unitview
Unit 1
0..*
1 0..*
Tunnel 1
0..*
1 0..*
1 0..*
A B A uses B
A has B (Composition)
A B
Qt
Unit Login
MainWindow Unitview
WGS84_TWD97TM2_Transform dem_erdas SelectTunnel
AddInspection AdminstrativeRegionView
CreateEnvironmentImageType CreateMonitor
CreateTunnel EnvironmentInfoView
InspectionInfoView MonitorInfo MonitorItem
Tunnel3D TunnelEvents TunnelFilesView TunnelInfo
UploadLinear UploadCrossSectionalShape
CreateTunnelType
DEMCollection
型後 四
4.1
研究 TW 題下 式,
4.2
『A 型的 標值 尺) 別庫
展開 使異 4.3
訊之 中標 形測
後,分別產
、檢監測資 檢監測資料
隧道檢監 究採用隧道 WD97-TM2 座
下,將材質根
,尋找相關
隧道幾何與 本研究建 ASTER GDE 的建置。而 值,單位為
。爾後本研 庫之輔助繪 而計算出 開圖等貼附 異狀成因更 視覺化技術
本系統除 之記錄,結合 標示其檢測 測量資料與
產生 c++ 程式 資料模型 料視覺化模 監測之下游為 道線型的真實 座標位置進 根據隧道幾 關的檢監測資
與 DEM 模 建議將地形與
EM Version 而隧道本體的 為公尺) 以及 研究所研發之 繪製於螢幕上 出之隧道本體 附於三維隧道 更易於判釋,
術輔助隧道 除了能夠幫助
合隧道斷面 測資料或是註 與斷面繪製資
式碼以及其 型視覺化設
模型概念 為三維互動 實測量資訊 進行繪製,並 幾何形狀貼附
資訊,並將
圖 11 本 模型於三維空
與隧道本體 n2. (October 的呈現上,
及線型資料 之程式即可 上。
體之三維網 道網格上,即
,如圖11所 道檢監測資料 助使用者觀 面展開圖進行
註解。應用 資料,分別取
其對應之標頭 設計與操作
動式隧道檢監 訊,並結合隧 並貼附隧道 附於所繪製 將檢監測位置
本研究提出的 空間之呈現 體同時呈現。
r 17, 2011) 則必需在系
(需於現地 可自動產生隧
網格,可再進 即可產生擬 所示。
料之記錄 觀察隧道整體
行標示記錄 用 VTK 類別
取得相對應
7
頭檔(header 作模式
監測資料視 隧道斷面的 道真實的襯砌 製出來的網格
置資料結合
的異狀輔助 現
。而數值地
』,進行資 系統中先行 地進行測量
隧道之三維
進行材質貼附 擬真之隧道影
體地形與走 錄,並整合至 別庫所提供的
應區間內的內
r file),以簡
視覺化系統,
的相對位置 砌資料,在
格上,希望 合至三維模型
助判釋之視覺
地形資料上目 料解析,同 行輸入隧道之
,輸入系統 維網格模型並
附,將事前 影像,以輔
走進隧道內部 至三維視覺 的 vtkTuple
內插數值,
簡化與加速程
,針對隧道幾
,整合至三 在不詳細考慮 望判釋者能夠 型當中如圖
覺化方式
目前使用 A 同時將高程資
之斷面資料 統單位為 TM
並與數值地
前已繪製好的 輔助還原隧道
部進行實境 覺環境中,讓
Interpolator 並且將資料
速程式之開發
幾何圖形的 三維模擬環境
慮貼圖影像 夠直觀的透 圖 11。
ASTER GDE 資料取出後 料 (以 CAD
M2 之座標格 地型模型同時
的隧道襯砌 道異狀之三
境模擬外,並 讓使用者能 r 內插功能 料轉換至實
發。
的繪製方面 境中,並使 像之精細度的 透過視覺化的
EM 所提供 後,進行三維
繪製並擷取 格式,亦為 時透過 VTK
砌影像或是異 三維空間位置
並可針對檢測 能夠在三維空 能,可以透過
實際的座標中
,本 使用
的問 的方
供的 維模 取座 為公
K 類
異狀 置,
測資 空間 過線
中。
8
系統先讀取隧道斷面展開圖後,事先建立輔助板的基本網格,之後建立材質座標後繪製出來,如圖 12 所示。並且透過 VTK 所提供的 vtkSeedWidget 建構與使用者之互動,讓使用者可以進行標註的功能。
如此可方便使用者輸入檢監測資料或對於異狀判釋輸入註記,並透過即時之三維呈現可避免資料位置 之錯誤輸入,如圖 13 所示。
圖 12 檢測位置標示板
圖 13 二維平面標示點建構至三維模擬環境成果圖 4.4 三維互動資料探索系統操作設計
Qt creator 是一個完整程式開發環境 (IDE),並額外支援 Qt 的圖形化使用者介面(Graphics User Interface, GUI)開發,其中內容包含了編輯模式與 UI 設計模式,更有豐富的套件可以快速開發出所需 要的 GUI。所以本研究運用 Qt 的元件,控制周邊環境顯示的範圍與進行隧道內部移動的操作做為主 軸,使用拉桿(QSlider)讓使用者可針對 DEM 的範圍進行調整,並透過 Qt 所提供的 LCD 顯示元件 (QLCDNumber)可計算使用者所觀看的範圍大小。另外使用工具按鈕(Tool button)讓使用者可進行資料 讀取的開關。其中 Slider 結合 LCD 元件與 DEM 模型之互動關係,使用者拉動拉桿,會將拉桿的數 值傳入 DEM 模型繪製的功能中,透過重新計算 DEM 所需要顯示的範圍,並且將攝影機重新設置後,
後重新繪製 DEM 模型。
本研究將檢監測資料匯入至視覺化模擬環境中,以圓球體的狀態去標示監測儀器的位置,使用者 可使用 Tool button 進行開關,並且於滑鼠停留在球體上,顯示相關的檢監測資訊,當使用者開啟顯 示監測資料的按鈕,程式在視覺模擬的類別中,呼叫資料庫中存取介面中的隧道資料,取得此專案內 所記錄的監測儀器 ID 後,呼叫資料庫存取介面中的監測儀器資料,並且根據監測儀器所記錄的位置 將資料給繪製出來,且使用者亦可透過拉桿(Slider)進入隧道內部進行觀察。繪製成果展示於圖14與 圖15。
9
圖 14 監測資料顯示於三維環境展示圖 圖 15 攝影機於隧道內部移動之展示 五、成果展示
本研究以 Qt 使用者介面設計軟體,進行圖形化使用者介面(GUI, Graphical User Interface)的開發,
圖 16 為本研究所開發之雲端式資料管理系統介面概觀。透過此系統,使用者可管理多個隧道專案之 資料,包含檔案的上傳與下載,隧道事件記錄等資訊。
圖 16 雲端式資料管理系統介面概觀
根據民國 97 年由『永基工程顧問有限公司』所針對嘉寶隧道地區後續監測計畫工作所提出的期 末報告書,嘉寶隧道路段位於霧鹿村與新武路村間之新武呂溪南側,隧道長度約 310m,斷面採馬蹄 型,高度為 6.9m,寬度為 9.0m。其中「嘉寶隧道」附近岩盤岩性係以大南澳片岩中之黑色片岩為主,
間夾綠色片岩、矽質片岩。檢測方面,隧道內異狀主要分佈於西洞口起 0~125m 段,其後經以鋼線網 加噴凝土予以補強,現有噴凝土仍持續發生開裂、錯動、側壁擠入、滲漏水及白華等現象[7]。於監 測儀器設置的部分設有一處雨量計; 4 孔水壓計觀測井; 一處地滑計; 一處孔內伸縮儀; 新設 5 孔地 中傾斜管; 結構物傾度盤 4 只; GPS 位移觀測點 20 只。且隧道的起始里程由西洞口 191k+670 處向東 行至 191k+980,隧道的通車時間為 1989/07/01,為公路隧道,全長 310 公尺,因此將數據加入專案 中,如圖 17、圖 18、圖 19 所示。
10
圖 17 案例隧道專案基本資料
圖 18 案例隧道地形概述
圖 19 隧道環境檢視成果
根據監測報告書內所提供的監測儀器座標位置,於本專案中,建立各監測儀器資訊,並將提供的 資料進行輸入的動作,如圖 22,此外,不同的監測儀器所記錄的數據不同,選擇監測儀器編號 GP01 的監測資料觀看,此監測儀器類型為 GPS 測點,記錄的數據為 N、E、Z 的 TM2 座標系統資料與高 程資料,且資料頻率為每年記錄一次。於記錄的資料內可觀察到該點位每年的變化情況。並根據案例 隧道專案報告書所提供的隧道斷面異狀繪製展開圖,將真實影像貼附至隧道斷面上,並結合異狀繪製 展開圖貼放於檢測位置標示板上,並針對圖片上異狀顯著處於異狀檢測板上進行標記,並於視覺化環 境中走入隧道內的位置觀看。並且於查詢資料時,將滑鼠移動至檢測的資料點上方,系統將會自動顯 示出檢測時所輸入的內容,如圖 23。
11
圖 20 監測資料案例展示 圖 21 檢測資料資料顯示成果
另外將監測資料顯示至三維環境中,如下圖22所示,於此案例將所輸入的監測儀器利用圓球的 方式結合至 DEM 數值模型上,且圓球的高程與位置將利用輸入儀器資料時所使用的資料建立,透過 選擇所需要顯示的監測儀器項目,可以觀察到監測儀器於此環境中的配置與位置,並且於觀看時,將 滑鼠移動至資訊點的上方,將自動出現資訊點所記錄的訊息,如圖23。
圖 22 監測資料視覺化成果展示 圖 23 監測儀器資訊顯示成果 六、結論
本研究使用雲端資料庫管理系統 MongoDB 進行資料庫的開發,擴充與備份相較於使用傳統 SQL 資料庫容易,且能夠將隧道檢監測的龐大數據透過資料管理系統儲存至資料庫內,並且使用的類 別庫皆為開放原始碼與跨平台的類別庫,於理論上適合未來將系統移動至其它平台繼續開發或應 用。
本研究使用 MongoDB 雲端資料庫,結合使用者介面的設計,管理龐大的檢監測數據,且將檢監 測資料結合至三維視覺化環境當中,並且針對檢測資料開發輔助標示記錄板,於輸入檢測資料時,
可透過輔助標示記錄板記錄檢測的位置,輔助檢測資料能夠呈現於三維視覺環境之中,並且結合 了 DEM 資料,將檢監測資料直接標示於建置出來的模型上,讓使用者能夠快速準確地瞭解檢監 測資訊於環境中的位置。
本研究將隧道的真實材質貼附於隧道的斷面,使用者可以透過本研究所設計的互動介面,並透過 本研究程式的操作介面,實際走入隧道內部進行預覽與進行隧道環境的觀察,幫助使用者,透過 隧道環境的觀察,結合其他檢監測資訊輔助異狀的判釋。
本研究先以雲端資訊系統開發出本研究案例所使用的資料庫,並結合 PHP 程式撰寫通用的資料 存取介面,能夠有效的針對未來所需要進行資料庫設計變更時,能夠快速的完成使用者介面與資 料庫之間的存取介面,與現有的傳統檢監測資料庫比較,更能容易開發,且基於雲端的特性,擁 有高擴充性與高系統穩定性。
本研究結合 DEM 資料幫助使用者觀察隧道周邊的地形與環境,能夠彌補於現有的檢監測維護管 理系統無法針對隧道環境進行實境觀察的缺點,最後於檢測資料較難轉換至實際的三維座標位置,
進行位置標示板的設置,提供檢測資料視覺化的處理方式之建議。
本研究成功嘗試以材質貼附的方式進行隧道實境的展示,貼附材質須經由設定材質座標,將材質 座標貼附於頂點座標上,而頂點座標皆由斷面量測與線形測量所彙整的資訊得來,容易產生失真 問題,所以研究透過視覺化亦可達到輔助之功能,但欲使用此方法進行更加詳細的檢測或者進行 危害之判斷,仍需解決貼材質的精度問題。
12
本研究所發展的隧道異狀輔助判釋系統,亦可應用於隧道檢監測相關的教學上,透過資料庫所儲 存的檢監測資訊,與直觀的視覺環境,未來學生將不需要進入現場,就能夠走入隧道內部與了解 檢監測資料以及模擬隧道異狀判釋,亦能作為隧道檢監測教育訓練之案例教學與異狀診斷平台。
誌謝
本研究承蒙國立臺北科技大學王泰典教授的大力協助,除提供寶貴的資料外,並給予多方指教,特此 感謝。
參考文獻
1. 馮正一、王天佑、洪世勳、陳錦清, 個人數位助理在大地工程上的應用. 中興工程季刊, 2002.
2. 張吉佐、侯秉承、劉弘祥, 台灣山岳隧道工程技術之回顧與展望. 地工技術第 100 期, 2004.
93-106.
3. Hsieh, Y.M. and Y.S. Lu, A Visualization System for Field Monitoring Data in Construction Engineering, in Automation in Constructionin revision.
4. 鄒昌佑, 應用視覺化技術於隧道異狀輔助判釋之初探, in 營建工程系2012, 國立台灣科技大 學.
5. Asakura, T. and Y. Kojima, Tunnel maintenance in Japan. Tunnelling and Underground Space Technology, 2003. 18(2-3): p. 161-169.
6. 蕭牟淵、游本志、王泰典、蕭興臺, 台灣公路隧道安全檢測及評估之研究. 台灣公路工程第 36 卷第 5 期, 2010.
7. 永碁工程顧問有限公司、交通部公路總局第三區養護工程處, 省道20號線嘉寶隧道地區後續 監測計畫工作, 2008.
8. 聯合大地工程顧問股份有限公司, 隧道維護管理系統使用手冊. 2009.
9. 李國榮、龍明治、高憲彰, 隧道異狀之繪製及健全性評估方法研究, in 第十三屆大地工程學術 研討會2009.
10. 高宗正、陳俊宏、嚴崇一、黃佳駿、李維峰, 台北都會區大眾捷運系統結構物維護管理資訊系 統之建立. 管道工程技術, 2009. 36: p. 73.
11. NIST, The NIST Definition of Cloud Computing, in Computer Security2011: U.S. Department of Commerce.
12. 黃重憲, 淺談雲端運算. 國立台灣大學計算機及資訊網路中心電子報第 00008 期, 2009.
13. Muthukkaruppan, K. The Underlying Technology of Messages. 2010; Available from:
https://www.facebook.com/notes/facebook-engineering/the-underlying-technology-of-messages/454 991608919.
14. Kovács, K. Cassandra vs MongoDB vs CouchDB vs Redis vs Riak vs HBase vs Membase vs Neo4j comparison. Available from: http://kkovacs.eu/cassandra-vs-mongodb-vs-couchdb-vs-redis.
15. Hurst, N. Visual Guide to NoSQL Systems. 2010; Available from:
http://blog.nahurst.com/visual-guide-to-nosql-systems.
16 Edgewall. Proj API Reference. Available from: http://trac.osgeo.org/proj/wiki/ProjAPI.
國科會補助專題研究計畫項下出席國際學術會議心得報告
日期:101 年 10 月 31 日
一、參加會議經過
本次參與 ICCCBE 2012 國際會議,首先非常感謝中央大學的黃榮堯教授以及 他的學生負責協調交通、住宿、行程、旅行社接洽等相關事宜,並將臺灣多位參 與本次會議的學人聚集在一起,增進了彼此之間的交流機會。本次旅程由桃園機 場出發、途中經由香港機場轉機後直扺莫斯科,在旅館休息一晚後即開始參與會 議之各項議程。
6 月 27 日上午報到後,即開始參與開幕式,開幕式為典型的會議主辦單位致 歡迎詞、計算機於土木與建築工程之應用國際學會主席致詞。接下來為三場次的 keynote lecture,首先是莫斯科市的代理市長 Marat Khusnullin 以「Development of modern megalopolis and the role of information technologies in the management of urban development processes」為題,說明了莫斯科市在近年發展過程中,積極導入 資訊科技之應用,以現代化莫斯科市之基礎建設。由於代理市長以俄文進行演講,
現場主辦單位有貼心地提供即時口譯之服務,並方便現場與會來賓以英文或俄文 發問或回答時,不致於讓其它來賓無法參與。
接下來的 keynote lecture 則是由臺灣大學謝尚賢教授介紹台大的研究團隊在分 析工程文件以建立起 domain knowledge 的努力,演講內容十分精彩,也引起許多 現場來賓提問,甚至有人建議謝教授將他們的成果賣給 Google。
緊接著的 keynote lecture 則是由德國慕尼黑科技大學的 Ernst Rank 教授介紹他 們在力學分析上近年來發展的 particle in cell 之結構分析方法,說明近年來結構分 析計算方法最大的限制,在於幾何建模上,而他們則利用 particle in cell 的技巧,
簡化建模分析之困難,並可提高分析速度。
早上的 keynote lectures 結束,中午在會場以 buffet 形式用餐後,緊接著就是十 分緊湊之議程。每個時段同時間有五個平行議程進行,可見一般。而本人本次會 議共有三篇文章發表,第一篇發表之文章為「The Evaluation of Sparse Matrix Performance in Meshfree Analysis」, 在 第 一 天 之 「Computational Mechanics」
session, 此議程中由本人指導之博士班學生潘茂森報告我們在無元素分析方法上針 計畫編號 NSC-100-2221-E-011-114
計畫名稱 應用雲端運算技術於建構隧道檢監測資訊系統之研析 出國人員
姓名 謝佑明 服務機構
及職稱
國立臺灣科技大學營建工程系 助理教授
會議時間
101 年 6 月 27 日 至
101 年 6 月 29 日
會議地點
蘇俄 莫斯科
會議名稱
(中文)第十四屆計算機於土木與建築工程之應用國際會議
(英文)14th International Conference on Computing in Civil and Building Engineering
發表論文 題目
(中文) 分散式架構之監測資訊系統之可靠度分析
(英文) Reliability Assessments on a Distributed-Computing Based Monitoring Information System
對不同的稀疏矩陣格式進行效能之評估,而他也順利完成了他首次在國際會議上 的發表。第二篇發表之文章為「Enhancing Performance of Meshfree Methods by Hybrid Computing」,亦由潘茂森同學發表,以增進他在國際研討會發表之經驗,
此發表被安排在第二天下午之「Computational Mechanics」session,此文章中介紹 了我們如何透過 GPU 加速無元素分析之計算時間。而第三篇發表之文章為「R eliability Assessments on a Distributed-Computing Based Monitoring Information System」,被安排在第三天近中午之「Distributed Computing in Engineering」session,
此發表介紹我們在解決大規模監測專案時使用之分散式運算架構,並針對此架構 進行了可靠度分析,以協助系統管理者決定其佈署方式。
而 除 了 參 與 前 述 之 三 個 議 程 外 , 本 人 也 參 與 了 如 「Disaster Preparedness, Response and Recovery with IT
」、「Computer Simulation for Civil and Building Engineering」 、 「Building Information Modeling, Industry Foundation Classes」、
等議程,並與其它國內外學者進行意見的交流與討論。
二、與會心得
此次會議中,GPU (圖形處理器) 之應用成果已逐漸顯現,除了本人發表 之文章外,如「Seismic damage simulation for urban buildings based on high performance GPU computing」之發表即利用 GPU 技術去作大規模都會地區的 震災評估,並可達到十分良好之加速;「Parallel finite element mesh generator using multiple GPUs」則是
利用多個 GPU 來加速有限元素網格之產生。此外,BIM (建築資訊模型) 仍然是相當熱門之研究課題,包括如何 利用 BIM 進行設施管理、使用 BIM 之工作流程、BIM 可能造成之法律 訴頌、應用 BIM 進行建築標準之自動檢查、利用 BIM 估算改建或重建 之廢棄物量、BIM 導入之成熟度評估、BIM 應用於高效率節能之建築等 等。
三、考察參觀活動(無是項活動者略) 略
四、建議
本次會議的論文集完全採用電子全文的形式,不再像過去附上一本厚厚的論 文集,僅將各場次發表的論文摘要集結成薄薄的一冊。此作法不但可減輕與會人 員的負擔、並可達到節能減碳的目的,建議國科會未來在補助國際會議舉辦時,
能強烈建議舉辦單位使用相同的作法。
五、攜回資料名稱及內容 會議論文集之電子全文。
六、其他
本次會議議程可由官方網站 http://www.icccbe.ru 下載,透過
http://www.icccbe.ru/frontend/index.php?page_id=194 之互動式議程可找到 下載本人此次會議發表之三篇文章,應足以佐證文章已被接受。
論文被接受發表之大會證明文件
(綠色代表已被接受之文章,由大會文章發表系統擷取)
Abstract
Field monitoring cost has been steadily decreasing due to the advances in wireless sensor network (WSN), system-on-a-chip (SoC), and microelectromechanical systems (MEMS). We are already swimming in a sea of sensors (PCAST 2010). It is thus vital to design an information system architecture that effectively store and manage vast amount of monitoring data. For this purpose, this paper introduces service orientated information system architecture. This design use distributed computing to help manage monitoring data. It is well suited to deploy in cloud-computing based facilities. It can also be used as a reference to build monitoring information systems. In addition, reliability analyses are introduced on vital functions for such systems. These analyses help developers design system processes in the information system. They can also help system administrators decide system deployment schemes to achieve desired data reliability or service levels.
Keywords: information system, monitoring, distributed computing, cloud computing, reliability
1 Introduction
Monitoring data are valuable for civil and construction engineering projects. Monitoring data are used in safety monitoring for early warning and hazard prevention (Aktan et al, 1998; Wong 2004; Li et al. 2006;). These data can verify accuracy of analytical or numerical models (Finno and Calvello 2005; Hashash et al. 2006). They can build predictive models through regression, artificial intelligence, or data mining (Liang et al. 1999; Malkawi et al. 2000). Finally, they are basis in decision-support systems (Cheng and Ko 2002; Cheng et al. 2002). Because monitoring data have many applications, and they record real responses of civil and infrastructure systems, they are thus very valuable. Therefore, it is vital to store and manage them properly.
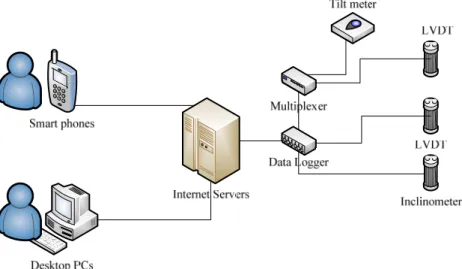
Fig. 1 shows typical automated monitoring information systems. They have four main components: 1) transducers, 2) data loggers, 3) Internet connections, and 4) Internet servers and databases. Transducers measure physical quantities (e.g. water pressure, settlement, etc.) and output analog or digital signals (e.g. voltage or duty cycles). The signals are then read and digitized by data loggers. The digitized data is then sent over the Internet to the Internet server, and they in the end get stored into the backend database. Finally, the Internet server or the application server responds to user requests such as charting and querying of monitoring data.
Scale of automated monitoring will grow rapidly in next few years. This is owing to the advances of wireless communication, MEMS sensors, etc. As a result, conventional setup shown in Fig. 1 can face scaling issues in bandwidth, storage space, processing power, etc. It has been noted that we are
Reliability Assessments on a Distributed-Computing Based Monitoring Information System
Y.-M. Hsieh & Y.-H. Chen
National Taiwan University of Science and Technology, Taiwan, Republic of China
“already swimming in the sea of sensors” (PCAST 2010). It is necessary to rethink how we build such information systems. It should be noted wireless sensor network, a promising technology that delivers huge amount of monitoring data, is based on distributed computing. Therefore, information systems processing data from such origin should also use distributed computing to keep up with the need for processing power.
Figure 1. Typical setup of automated monitoring information systems
Hsieh and Hung (2009) proposed an information system design based on SOAP standard and distributed computing. Their design provides a framework to build reliable, scalable, flexible, and always-accessible information systems. However, the reliability for such design is not quantified.
Furthermore, the flexible system architecture is hard to configure without guidance. There is a need for quantitative guidance for system administrators. This paper supplements their work by assessing reliability on critical operations in the proposed design. By using the assessments to be described, system reliabilities are quantified. Thus, we can provide the needed guidance for system deployment and configuration.
The rest of this paper is organized as the following. First, we describe the distributed system design for automated monitoring information system. We also discuss how the design provides features such as scalability, reliability, and always-on accessibility. Second, we depict critical components or operations in the design and their reliability evaluation. Finally, we draw some conclusive remarks. Here we would like want to point out that cloud computing, the current IT revolution, is essentially distributed computing in its heart. Therefore, the assessments described in this work may also apply to information systems built “in the cloud.”
2 A distributed architecture for monitoring information systems
In this section, we first introduce the information system design proposed by Hsieh and Hung (2009).
The flexibility of deployment is then demonstrated. Important factors affecting reliability assessments are also discussed.
2.1 Distributed information system design for automated monitoring
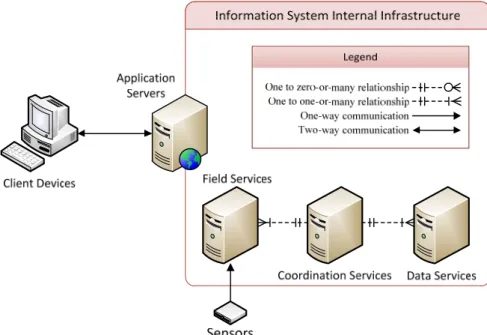
Fig. 2 depicts the proposed information system design by Hsieh and Hung (2009) for automated monitoring systems. Their design adopts service orientation. Therefore, there are three discrete services in the system design. They are data service, coordination service, and field service.
Data service (DS) is the storage service for monitoring data. In other words, all monitoring data are stored and managed by DS. It must be noted an information system may use many DS. This serves two purposes: 1) to scale up the storage capacity without interruption and 2) to provide data redundancy. First, conventional client-server architecture cannot expand storage capacity without shutting down server machines or using special hardware. The proposed system design can increase system storage capacity by adding more DS. As a result, no system interruption is needed when adding capacity. Second, data redundancy can be easily achieved by duplicating data on two or more DS. This is further discussed next.
Field service (FS) runs on data loggers or field computers. It is responsible for getting instrumentation data and sending them to the designated DS. This is a very simple task. However, there are two important designs that must be noted: 1) there may be one or more designated DS, and 2) the DS designation is temporal. When monitoring data are important, one may choose to assign two or even more DS to one FS. This introduces data redundancy and improves data reliability. Our design also introduces temporal DS designation. The DS designation is provided by coordination service to be introduced. By using temporal DS designation, we can avoid system interruption during capacity upgrade or system maintenance. Before a DS runs out of its disk space, the system administrator or some supervising programs can find all field services associated with this particular DS and route all further data storage needs to other DS by configuring coordination. As a result, there is no need for service interruption.
Coordination service (CS) is a very simple yet extremely important. Its sole purpose is to respond to field services about their designated DS. It other words, the associations between field services and data services are managed on CS, or CS couples FS with DS. As noted previously, this coupling helps achieve data reliability, capability scalability, and always-on accessibility.
Figure 2. A distributed system architecture for automated monitoring systems
2.2 Deployment Schemes
It must be noted in previous discussions we mentioned services, not servers. This is because software services are software components deployed on servers, and there is usually no limit on how many services can be deployed on one server. As a result, there are many possible schemes to deploy the aforementioned services. In the following, we show two out of many possible deployments for
small-scale and large-scale monitoring projects. We also briefly discuss factors affecting their system reliability.
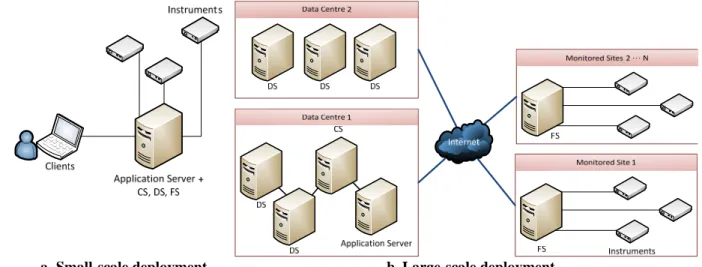
2.2.1 Small-scale deployment
Fig. 3a illustrates a small-scale deployment. In such setup, all three services are crammed on one computer installed on the monitoring site. This setup requires no Internet connection to work. If the computer is broken or out of service, then the monitoring data during system restoration is gone. The system reliability is determined entirely by the computer.
a. Small-scale deployment b. Large-scale deployment Figure 3. Deployments schemes
2.2.2 Large-scale deployment
Fig. 3b shows a large-scale deployment. In such deployment, all three services are installed on different computers, and there are many servers running DS. Furthermore, some DS are deployed to different data centres. Such setup can handle lots data, offer large data bandwidth, and improve system reliability because different data centres are unlikely to malfunction at the same time. In this setup, however, both networking and computers control the overall system reliability. The reliability assessment is further complicated by the fact that field computers may have lower reliability than the ones used in the data centre. The same holds true for the networking. These are because the construction site conditions are often harsh and unfriendly to the computing equipment. Thus, reliability assessments need to consider site conditions.
3 Reliability assessments
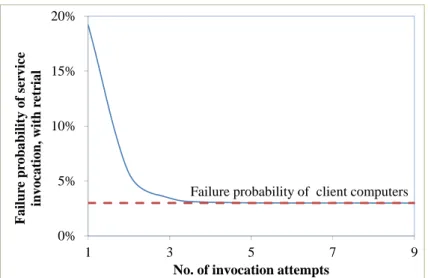
The information system built using the services described has many favourable features, and it can be deployed flexibly. This flexibility, however, causes difficulties in system configuration and deployment. How many DS should one use to handle 10,000 sensors? How many FS should be assigned to one DS? These questions cannot be answered easily without some quantitative advices.
Therefore, we suggest using reliability analyses to help answer these questions. In the following, we discuss four assessments. They are discussed because either they represent the most critical operations in the system, or they are most important system characteristics.