行政院國家科學委員會專題研究計畫 成果報告
台北軟弱黏土應力應變行為之基礎研究(第 3 年) 研究成果報告(完整版)
計 畫 類 別 : 個別型
計 畫 編 號 : NSC 95-2221-E-011-055-MY3
執 行 期 間 : 97 年 08 月 01 日至 98 年 12 月 31 日 執 行 單 位 : 國立臺灣科技大學營建工程系
計 畫 主 持 人 : 歐章煜
處 理 方 式 : 本計畫可公開查詢
中 華 民 國 99 年 03 月 31 日
1
目 錄
Part 1: Introduction ... 2
Part 2: Improvement of test apparatus ... 7
Part 3: Improvement of test procedure ... 30
Part 4: Anisotropic stiffness for Taipei silty clay ... 62
2
Part 1: Introduction
3
Stress-strain behavior of soils at small strain has become one of the most important geotechnical engineer topics for the last two decades. According to the data measured in-situ, many researchers (Jardine et al. 1986; Burland 1989; Mair 1993) pointed out that the strain caused by construction was always less than 0.05% in the regions far from construction areas, which belongs to the range of small strains. Generally, the strain measurements used in conventional triaxial tests are measured externally, which may result in overestimating the axial strain.
In recent years, the study of soil stress-strain behavior at small strain has been improved by the development of high-resolution local measurements, which allow strain measurements on specimens to be resolved to the order of 10-5 and bring out realistic soil behavior.
As highlighted above, strains concerned in geotechnical problems at small strain are mostly less than 0.05%. Thus, the way of measuring axial strains in triaxial tests becomes significantly important. Considerable research has proved that the high stiffness of soils at small strain can only be observed through measuring the strain on the sample locally (Jardine et al. 1984; Goto et al 1991;
Lo Presti et al. 1995). The recommended method to fix the local sensor on a soil specimen is either sticking the sensor on the membrane for stiff clays, which may result in a relative displacement between the sample and the local sensor, or piercing a pin into the specimen through the membrane for soft clays. The use of pierced-pin placement may reduce the relative displacement between the
specimen and the local sensor, but the pin piercing the membrane will increase the risk of leakage within tests, even if silicone is used to seal the puncture. In
addition, the installation of local sensors on a specimen may cause undesirable disturbances to the tested soil sample. The degree of this disturbance greatly depends on the technique of setup of local sensors, i.e. it varies from researchers to researchers.
In order to eliminate possible errors of measurement, an alternative strain
4
measurement, making use of a high-precision servo motor, namely the
Direct-Drive motor (D.D. motor), in the axial loading system is presented in this study, which not only provides the needed axial displacement but also can be used to measure the axial strain. A modified triaxial testing system with the mentioned D.D. motor and local strain measurements is thus developed to perform the test.
Then, the stress-strain behaviors of natural Taipei silty clay obtained by two different strain measurements were compared to investigate the feasibility of measuring the strain by means of the D.D. motor.
In addition to the strain measurement used in triaxial tests, testing procedures for sampled soil have been recognized as important factors in determining soil properties. As a result, work on developing and comparing techniques for reproducing the in-situ state of soil have been undertaken (e.g., Bjerrum 1973;
Ladd and Foott 1974; Ladd and De Groot 2003; Santagata and Germaine 2005).
Most studies have focused on improving the reconsolidation stage. However, as observed by Cho et al. (2007), the effect of swelling during saturation of clay specimens causes changes in soil structure and affectes stress-strain responses at a strain of less than 0.01%. Saturation is thus considered as important as the
reconsolidation stage in a triaxial test.
To maintain the good quality of the soil sample during the saturation stage, an apparatus capable of controlling the suction in soil specimens and connecting to the triaxial testing system should be developed. Studies related to setting up a suction control system have been done by many researchers (e.g., Cunningham et al. 2003, Jotisankasa et al. 2007). However, these suction control systems focused on studies related to unsaturated soil. The application of existing suction control systems to saturated soil tests has been limited because suction force directly applied to saturated soil will result in the decrease of degree of saturation, which is undesirable in testing on a saturated soil sample.
Thus, this study also describes the improvement of saturation in triaxial tests
5
considering soil suction due to sampling. An apparatus capable of suction control in triaxial tests has been developed to improve the saturation condition. Triaxial tests with and without suction control were conducted on reconstituted samples of Taipei silty clay. The effects of saturation with suction control are verified in terms of (1) the void ratio change (e e0 ) after recompression (2) the shear modulus obtained from bender element tests during K0 consolidation, and (3) the
stress-strain characteristics at small strains during undrained shearing.
After the improvement of testing apparatus and procedure, triaxial tests conducted on Taipei silty clay were carried out. The stress-strain behavior observed in test results were used in modifying the soil constitutuve model. The accuracy of ground movement predictions during underground construction is improved by using the soil models which can simulate the soil behaviors at small strain. However, another attempt has been made to achieve the improvement of accuracy by considering the anisotropic properties of soils in numerical
simulations (Ng et al. 2003; Nishimura et al. 2005). The work mentioned above carried out that the prediction of deformation in construction is greatly improved with consideration of the anisotropic behavior for clayey soils. Therefore, the anisotropic properties of soils should be investigated for the purpose of getting better prediction and analytic results for geotechnical problems, especially for deep excavations with structures nearby.
The existence of inherent anisotropic stiffness for soft clays under K0
consolidation state can be proven and investigated by performing triaxial tests with local measurements and multi-orientation bender elements. The bender element, embedded in triaxial apparatus and proposed by Dyvik and Madshus (1985), has become one of the major laboratory tests in the study of the soil stiffness. Recent advances in laboratory techniques enable measurements of the horizontal propagation of shear wave velocity through the soil specimen in triaxial tests (Pennington et al. 1997). The shear waves obtained by bender element tests
6
can be used in calculating the shear moduli, GBE, by applying the following equation:
2
( ) ( )
BE ij s ij
G V (1)
where i is the direction of wave propagation and j is the direction of wave
polarization. is the bulk density and Vs is the measured shear wave velocity.
Finally, this study focused on the development of anisotropic shear modulus during K0 consolidation and undrained shearing. A series of CK0UAC triaxial tests were conducted on reconstituted Taipei silty clay. The variation of anisotropy of shear moduli under different consolidation stress, void ratio, and shear strain was investigated by performing bender element tests. The empirical equations for estimating the shear moduli and anisotropic ratio for shear moduli in the function of stress state, void ratio, and OCR were established.
7
Part 2: Improvement of test apparatus
8
1. Testing Apparatus
1.1. Axial Loading System
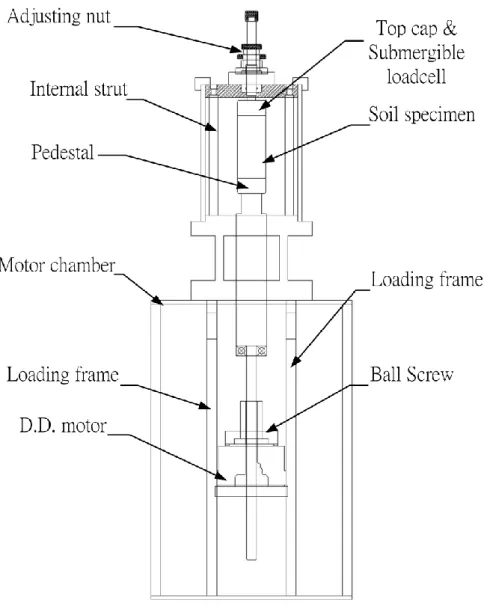
A triaxial testing system, capable of performing tests at small strain and equipped for local measurements, is developed in this study. The testing system, consisting of an axial loading system, a pressure controller, and a data acquisition system, is an automated, programmable, and feedback-controlled system. A high-accuracy, direct-drive servo motor (D.D. motor) was used to provide the axial displacement in triaxial tests. As shown in Fig. 1, the D.D. motor (SN: NSK M-YSB 2020KN001) was fixed on the loading frame, and the transmission was an extremely precise ball screw (SN: NSK DFT 2805-5) tightened on the motor directly, i.e. no indirect transmissions such as gears or belts were used in the axial loading system.
The major advantages of a driving system with a D.D. motor are the high rigidity and the absence of transmission gears. Hence, the backlash in the axial loading system should be zero. The resolution of the motor is 819200 steps per revolution, and every round of rotation creates 5 mm of linear motion. Thus, the minimum single axial displacement is mm (= mm), which makes it ideal for displacement-controlled tests. The maximum error due to the D.D. motor is 150 seconds in every round of rotation, i.e. the 150 seconds error will be generated in each motor rotation, i.e. 360 degrees
(360 degree 60 min degree 60sec min 129200 seconds). Thus, the possible largest error in the axial displacement is 0.0116% (150 1292000), or 0.58 m
9
( 0.0116% 5mm ) in every round of rotation of the D.D. motor.
1.2. Specimen Setup
Even though the axial loading system was designed to be as precise as possible, errors existing in the setup of a specimen may still result in
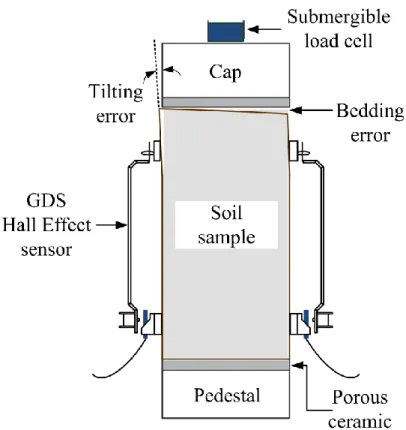
underestimated soil stiffness at small strain. The probable errors encountered in conventional triaxial tests include the rotation of the top cap, the measurement of load and deformation, disturbance during the preparation of a sample, and tilting and bedding errors. Most errors mentioned above can be eliminated by modifying the triaxial cell, for example, by using internal measurement and a fixed top cap.
Fig. 2 shows the local deformation measurement used herein, i.e. the GDS Hall Effect local strain transducers. However, the disturbance due to the preparation of specimens and the tilting and bedding errors shown in Fig. 2 are much more difficult to avoid, compared to other errors mentioned above, during a triaxial test.
A set of accessories for preparation of a specimen and a recommended testing procedure are thus used in this study to remove the errors (Kung 2007).
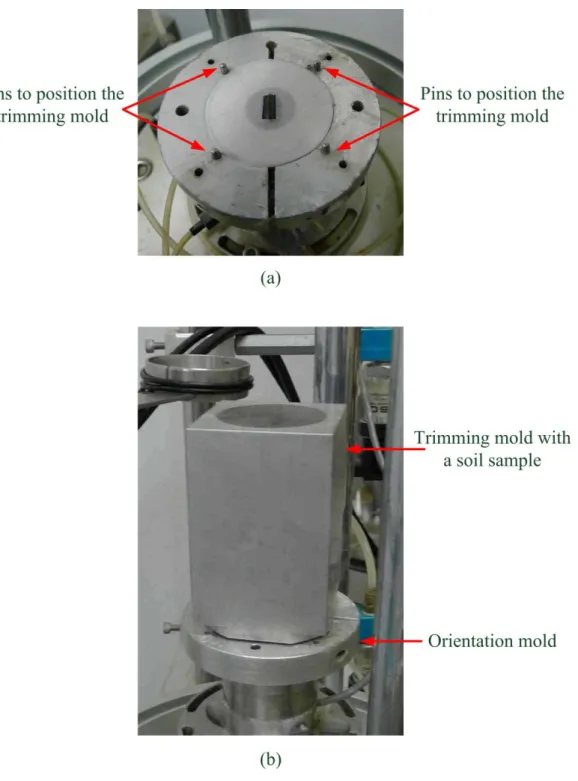
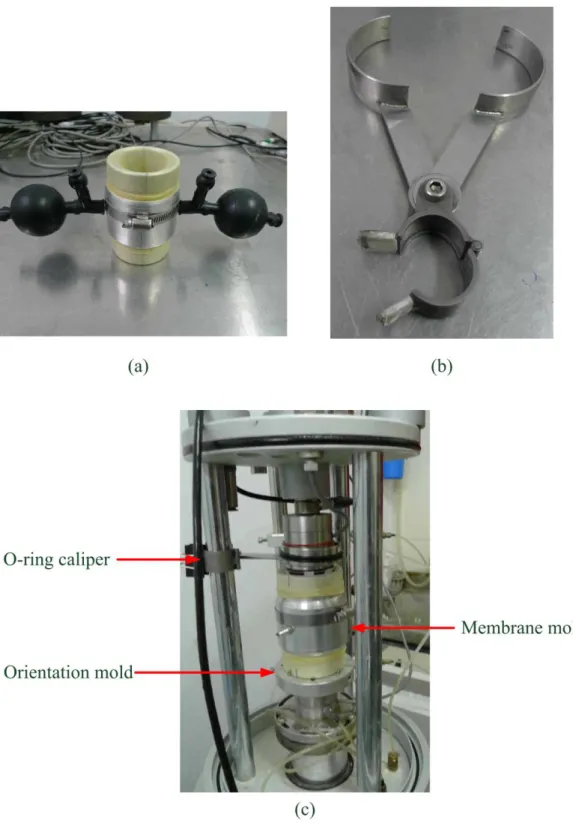
The accessories include a trimming mold (shown in Fig. 3a), an orientation mold (Fig. 4a), a membrane mold (Fig. 5a), and an O-ring caliper (Fig. 5b). The trimming mold was used to ensure that the top and bottom surfaces of the sample were horizontal and smooth after trimming, which can reduce the bedding error caused by a non-horizontal sample surface. Fig. 3b illustrates a trimming mold with a soil sample. Fig. 4a shows an orientation mold with four small pins, used to ensure that the trimming mold and soil sample are placed exactly in the right position and they contact the pedestal tightly as shown in Fig. 4b. Thus, bedding error due to gaps between the sample and the cap/pedestal may be eliminated. In the process of mounting a membrane, the membrane mold shown in Fig. 5a was used to prevent probable tilt and disturbance. The membrane mold was also placed on the orientation mold with pins, which helped the operator to mounting the membrane without eccentricity as shown in Fig. 5c. As a result, the bedding and
10
tilting errors induced by the set-up of a specimen were greatly reduced and should not affect the accuracy of the stress-strain measurement in the test.
2. Test Plan and Materials
2.1. Test Materials
Small-strain triaxial tests were conducted on 50 mm diameter specimens of low plasticity Taipei silty clay taken from fixed-piston thin-tube samples and from reconstituted samples. The in-situ soil samples were retrieved from a site near a well-documented excavation case in Taipei, named TNEC. Considerable
investigations of soil characteristics at the TNEC site have been done by
laboratory tests on tube samples and field tests, e.g., small-strain tests and in-situ cross-hole tests (Ou et al. 1998; Kung 2007). The reconstituted sample was made of low plasticity Taipei silty clay as well. The clay was dried in the oven for 24 hours and then crushed to a powder, passing through a 425-micron sieve. The reconstituted samples were created by mixing the soil powder with a water content of 93%, twice the liquid limit, to form slurry. The slurry was then subjected to a vertical consolidation stress of 150 kPa, by several steps in a chamber.
2.2. Test Plan
The testing plan presented here is separated into two series, i.e. test series A and test series B. The purpose of test series A was to ensure that strains measured by the D.D. motor and the Hall sensor were close to each other. For test series B, two strain measurements were used to investigate the stress-strain behavior of natural clay. These two test series are introduced in detail in the following.
Test series A, i.e. CIU_AC test, was to investigate the difference in axial strains measured by the D.D motor and the Hall sensor at different testing conditions, i.e. the effective confining pressure and shearing rate. In order to exclude the other influencing factors, such as spatial variation of in-situ soil, the
11
reconstituted samples were therefore used and subjected to isotropic consolidation.
The effective consolidation stresses were 49 kPa, 98 kPa, and 196 kPa. After the isotropic consolidation, the specimen was subjected to the undrained shearing at two different shearing rates, namely, 1%/hr and 5%/hr. For investigating the consistency of test results, all the tests mentioned above were performed twice.
The purpose of test series B, i.e. CK0U_AC test, is to realize the stress-strain behavior of Taipei silty clay, which was investigated through two different strain measurements, i.e. the strain measured by the D.D. motor and by the Hall sensor.
Thus, the in-situ tube samples were used and consolidated to the in-situ stress state at the K0 condition with the recompression method. After finishing the
consolidation, undrained shearing at the rate of 0.2%/hour was performed. The stress-strain behavior of natural clay was observed. All the detailed information for tests is listed in Table 1.
3. Test Results and Discuss
3.1. Results of CIU_AC test
Fig. 6 shows the measured axial strains from the D. D. motor and the Hall sensor at different testing conditions. All the tests in test series A were repeated to investigate if the results were consistent. The symbols of open circle and open triangle represent the first and the second tests in test series A, respectively. The solid line represents the strain measured by the D.D. motor being equal to that measured by the Hall sensor.
Strains measured by the D.D. motor were expected to be always much larger than those measured by the hall sensor if the deformation of the loading frame, the bedding error or the tilting error exist in the testing system. As observed in Fig. 6, even though the tests were performed at different effective confining pressures and shearing rates, the strains measured by the D.D. motor were still close to those measured by the Hall Effect local strain sensor and the results from the first and
12
second tests were not always on the same side of the solid line. The results show that the loading frame deformation, the bedding error or the tilting error has little influence on the strain measurement with the arrangement of tests presented herein.
Discrepancies between the measured data and the solid line shown in Fig. 6 can be explained as resulting from the measuring error of the Hall Effect local sensor. The reason for treating the discrepancy in Fig. 6 as noise affecting the Hall sensor was that bedding and tilting errors were proved to have little influence on the strain measuring. Moreover, the Hall sensor accurate to about 0.8% of full range output (6mm here), i.e. 48 m (0.8% 6mm), which was significantly larger than the maximum error in the D.D. motor measurements, which was 0.58 m , as mentioned previously.
3.2. Strain ratio of two strain measurements
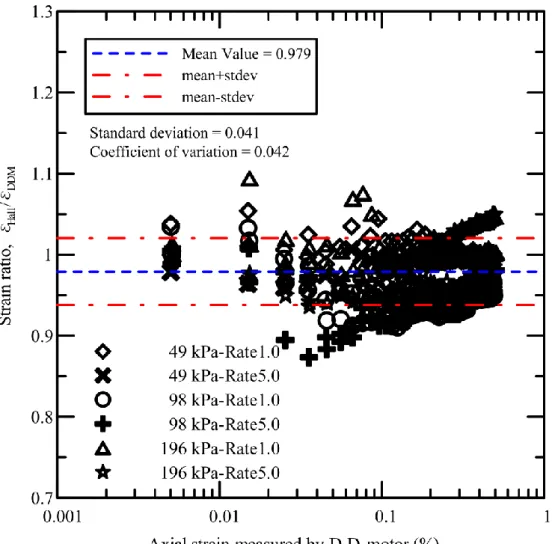
Fig. 7 shows the ratio of strain measured by the Hall sensor to that measured by the D. D. motor in the strain range of 10-3% to 1%. The mean value of strain ratio obtained in test series A was 0.979, and the coefficient of variation was equal to 0.042. As observed in Fig. 7, most strain ratios ( ) were located within 0.9 to 1.1, i.e. the maximum difference between two different strain measurements was only 10%. For the small strain range (strain less than 0.01%), the strain ratios were in the range of 0.98 to 1.04, which was more reliable. The variation of strain ratio may result from measuring noise affecting the Hall sensor, as discussed above. However, the strain ratio seems to be more scattered in
larger-strain ranges than in the small-strain range. The result can be explained by the fact that the loading frame was subjected to higher loading when the axial strain increased, and this resulted in such discrepancy. For the test at the effective confining stress of 196 kPa and shearing rate of 5%, which was the heaviest loading condition for the loading frame, the strain ratio shown in Fig.7 was not affected significantly by the deformation of loading frame and was still close to
13
1.0. Thus, consistent results from tests at different confining pressures and
shearing rates indicated that the strain measured by the D. D. motor can be used as an alternative strain measurement for all kinds of testing conditions.
3.3. Stress-strain behavior measured by two strain measurements
In test series A, the consistency of strains measured by the D.D. motor and the Hall sensor has been examined on reconstituted samples. The undrained Young’s modulus of natural Taipei silty clay was therefore investigated by
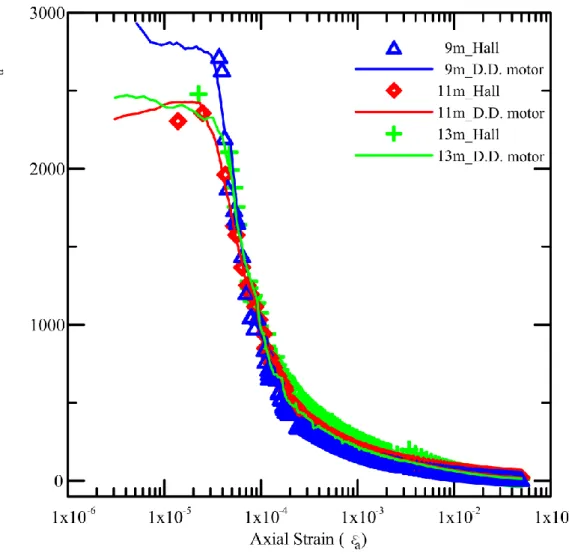
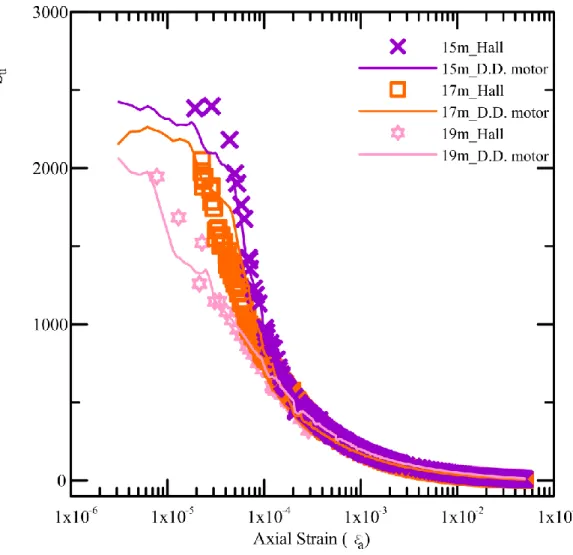
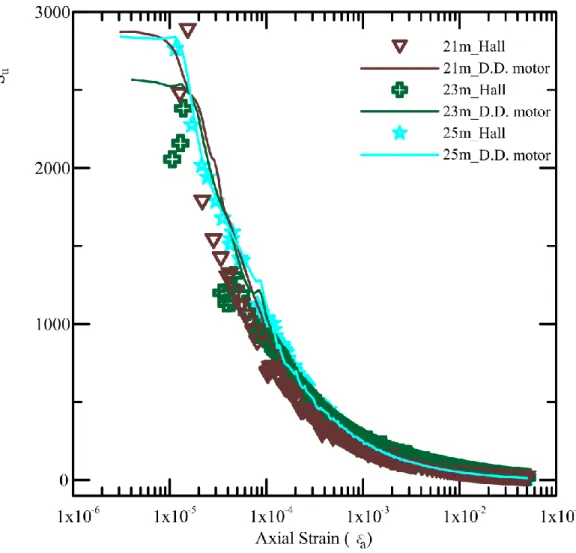
performing the triaxial test (CK0U_AC) on the tube sample in test series B. Fig. 8 to Fig. 10 show the degradation curves of undrained secant Young’s modulus ( ) normalized by the undrained shear strength ( ) for the samples retrieved from the depths listed in Table 1. According to the test results obtained from test series B, the following important phenomena can be observed: (1) the stiffness measured by the D.D. motor and the Hall sensor were in good agreement, and the ratio of stiffness calculated by the D.D. motor to that by the Hall sensor ranged between 0.97 and 1.09 (shown in Table 2), (2) the smallest strain level measured by the D.D. motor could reach the order of 10-4%, and was apparently smaller than that measured by the Hall sensor, (3) the stiffness measured by the D.D.
motor at strain less than 10-3% was almost constant, which showed the linear behavior of clay at very small strain, (4) all the normalized undrained secant Young’s moduli at small strain, Eu,sec Su , were located in the range of 1896 to 2849 (see Table 2), which matched previous work quite well (Kung 2007). All the important findings listed above proved that measuring the strain by means of a D.D motor in the triaxial test were practicable and not affected by the operator’s technique for assembling on-specimen local strain measurements.
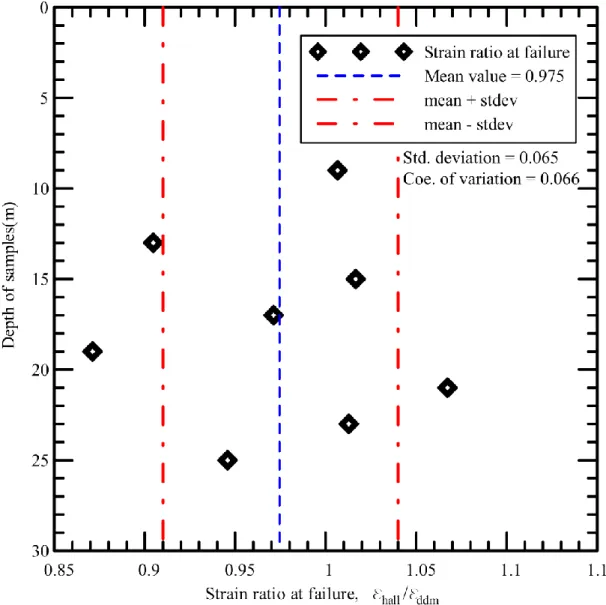
3.4. Comparison of two strain measurements at the failure condition
The loading frame of the triaxial testing system will be subjected to the
14
largest loading when the soil sample reaches the failure state, which may overestimate the strain measured externally. Results shown in Fig. 8 to Fig. 10 illustrate that the stiffness measured by two strain measurements were still close to each other, even though the strain was approaching the failure condition. Table 3 lists the failure strain measured by the D.D. motor and the Hall sensor, and the ratio of strain measured by the D.D. motor to that by the hall sensor at the failure state. Most of the failure strains measured by two strain measurements were within the range of 3% to 5%. Also, the strain ratios measured on samples from different depths are plotted in Fig. 11 where the mean value of strain ratios is 0.975 and the coefficient of variation is equal to 0.066. All the results mentioned above proved that the strain measurements made by use of a D.D. motor were still reliable even near the failure condition of the soil samples.
4. Summary
Two series of small-strain triaxial tests, i.e. CIU_AC and CK0U_AC, were carried out on reconstituted and tube samples of Taipei silty clay, respectively.
Strains and stiffness measured by the D.D. motor and by the Hall Effect local strain sensor were compared to examine the feasibility of measuring the strain by the D.D. motor in triaxial tests. Results from CIU_AC tests on reconstituted samples show that the ratios of strain measured by two different methods were in the range of 0.9 to 1.1, and were located between 0.98 and 1.04 at the small-strain range, which implies that strain measurements made by the D.D. motor are suitable for the triaxial test. In addition, results of CIU_AC tests also show that either different effective confining pressures or different shearing rates have little influence on the strains measured by the two methods.
Results from CK0U_AC tests on tube samples indicate that the ratios of stiffness from the D.D. motor to those by the Hall sensor ranged between 0.97 and 1.09. The stiffness measured by the D.D. motor was much steadier than that measured by the Hall sensor at strain less than 10-3%, which brought out the linear
15
stress-strain behavior of soils at such levels of strain. The ratios of strain measured by two strain measurements near the failure state of the soil sample, i.e. strain at about 5%, were in the range of 0.87 to 1.07. It is thus expected that an alternative strain measurement by the D.D. motor with the accessories developed for set-up of specimens could be used for strain measurement in triaxial tests, both for the small-strain range and the large-strain range.
16
Table. 1 Detailed test information
Test series A B
Sample type Reconstituted sample Tube sample Consolidation type Isotropic consolidation K0 consolidation
or Depth 49 kPa, 98 kPa, 196 kPa
9, 11, 13, 15, 17, 19, 21, 23, 25m
Shearing rate 1%/hr and 5%/hr 0.2%/hr
# of tests 12 9
17
Table. 2 Summary of undrained stiffness in test series B Depth
of sample
. . D D M
,sec u
u
E S
(by D.D.M)
Hall
,sec u
u
E S
(by Hall) Su
(kPa)
Stiffness ratio*
9 m 5.16 10 6 2778 3.95 10 5 2638 35.77 1.05 11 m 1.02 10 6 2228 1.38 10 5 2305 64.29 0.97 13 m 1.02 10 6 2396 2.26 10 5 2476 50.63 0.97 15 m 1.04 10 6 2486 1.94 10 5 2384 49.87 1.04 17 m 1.03 10 6 1896 2.33 10 5 1920 56.18 0.99 19 m 6.20 10 6 1969 7.77 10 6 1946 69.32 1.01 21 m 1.34 10 6 2643 1.27 10 5 2467 67.68 1.07 23 m 1.02 10 6 2593 1.38 10 5 2382 92.49 1.09 25 m 1.03 10 6 2849 1.29 10 5 2730 96.29 1.04
* The stiffness ratio is (Eu,sec)DDM (Eu,sec)Hall
18
Table. 3 Strain ratios at the failure state of soil samples Depth of
sample
Hall
at failure
. . D D M
at failure
Strain ratios
9 m 0.0367 0.0365 1.007
11 m out of range 0.1433 - 13 m 0.0214 0.0237 0.905 15 m 0.0304 0.0299 1.017 17 m 0.0223 0.0230 0.971 19 m 0.0308 0.0353 0.871 21 m 0.0320 0.0300 1.067 23 m 0.0390 0.0385 1.013 25 m 0.0508 0.0537 0.946
19
Fig. 1 Axial loading system used in this study
20
Fig. 2 Tilting and bedding errors caused by set-up of a sample
21
Fig.3 (a) the trimming mold, and (b) the trimming mold with a soil sample
22
Fig. 4 (a) the orientation mold, and (b) assemble the soil sample and trimming mold on the orientation mold
23
Fig. 5 (a) the membrane mold, (b) the o-ring caliper, and (c) mounting the membrane on the soil sample
24
Fig. 6 Results of CIU_AC tests
25
Fig. 7 Ratio of strain measured by D.D. motor and Hall sensor
26
Fig. 8 Result of small-strain stiffness on in-situ soil sample (depth 9m to 13m)
27
Fig. 9 Result of small-strain stiffness on in-situ soil sample (depth 15m to 19m)
28
Fig. 10 Result of small-strain stiffness on in-situ soil sample (depth 21m to 25m)
29
Fig. 11 Ratio of strain measured by D.D. motor and Hall sensor at failure condition
30
Part 3: Improvement of test procedure
31
1. Introduction
Testing procedures for sampled soil have been recognized as important factors in determining soil properties. As a result, work on developing and comparing techniques for reproducing the in-situ state of soil have been
undertaken (e.g., Bjerrum 1973; Ladd and Foott 1974; Ladd and De Groot 2003;
Santagata and Germaine 2005). Most studies have focused on improving the reconsolidation stage. However, as observed by Cho et al. (2007), the effect of swelling during saturation of clay specimens causes changes in soil structure and affectes stress-strain responses at a strain of less than 0.01%. Saturation is thus considered as important as the reconsolidation stage in a triaxial test.
The saturation method commonly used in conventional triaxial tests is
applying a back pressure (ub) to compress the void air in soil specimens and make it dissolve into pore water. Simultaneously, cell pressure, slightly higher than the back pressure, is applied to prevent the bulge of the specimen which may be caused by the back pressure. The very low effective stress in the conventional saturation shows that the specimen is in the unloading state (or swelling), i.e., the path BC in Fig. 1 (where B and C denote the stress state after sampling and after conventional saturation, respectively). In this conventional saturation stage, the effective stress is almost equal to 0 and located at point C in Fig. 1. When the specimen was consolidated to the in-situ stress state by the recompression method as shown by the path CD in Fig. 1, the void ratio was changed bye1. Such a considerable void ratio change indicates that the quality of the specimen may be poor.
To lower void ratio change after recompression, the effective stress of the specimen should be maintained during saturation. This objective can be achieved by maintaining the suction in specimens at first, and then removing the suction gradually and simultaneously applying cell pressure at the same value as removed suction. This process results in the transformation of suction into positive cell
32
pressure without causing any change in the effective stress, i.e., the effective stress is still equal to the residual effective stress. The residual effective stress, namely thes in Fig. 2, is the effective stress remaining in the soil specimen after
sampling, storage, and handling (Ladd and DeGroot 2003 ; Cho et al. 2007). After that, the specimen is recompressed to in-situ stress, as indicated by point E in Fig.
1, inducing the void ratio changee2. Since the void ratio change (e2) in the path BE is significantly smaller than that due to the path CD (e1), this shows that the quality of the soil sample is not degraded in the process of saturation.
To maintain the good quality of the soil sample during the saturation stage, an apparatus capable of controlling the suction in soil specimens and connecting to the triaxial testing system should be developed. Studies related to setting up a suction control system have been done by many researchers (e.g., Cunningham et al. 2003, Jotisankasa et al. 2007). However, these suction control systems focused on studies related to unsaturated soil. The application of existing suction control systems to saturated soil tests has been limited because suction force directly applied to saturated soil will result in the decrease of degree of saturation, which is undesirable in testing on a saturated soil sample.
This paper describes the improvement of saturation in triaxial tests
considering soil suction due to sampling. An apparatus capable of suction control in triaxial tests has been developed to improve the saturation condition. Triaxial tests with and without suction control were conducted on reconstituted Taipei silty clays. The effects of saturation with suction control are verified in terms of (1) the void ratio change (e e0 ) after recompression (2) the shear modulus obtained from bender element tests during K0 consolidation, and (3) the stress-strain characteristics at small strains during undrained shearing.
2. Materials and methods
2.1 Soils
33
The soil tested was Taipei silty clay. The basic properties of the soil are shown in Table 1. The clay was dried in the oven for 24 hours and then crushed and passed through a 425-micron sieve. The reconstituted samples were created by mixing the soil powder with a water content of 93%, more than twice the liquid limit, to form slurry. The slurry was then subjected to a vertical consolidation stress of 120 kPa using 4 steps in a consolidation chamber. Use of reconstituted samples ensures that the testing results will not be affected by the variability of in-situ soils.
2.2 Development of the suction control system
Two vacuum ejectors, namely the Venturi vacuum generators, were used to produce two independent suctions required in the suction control system as shown in Fig. 3. The two suction lines were connected to the top and bottom caps, so as to control the suction in soil specimens more uniformly than using only one suction control line. Another reason for controlling the suction on the top and bottom caps separately is that different suctions on the top and bottom parts of a soil specimen may be needed for future studies. However, the controlled top and bottom suctions were identical in this study. The filters placed in the top and bottom caps were made of porous ceramic whose air entry value equals 1 bar.
Two precise electro pneumatic valves (E/P1 and E/P2 in Fig. 3) were placed on the lines in front of and controlling the vacuum ejectors. The output pressure of E/P varied with the change of input voltage, i.e., the pressure which was outputted from E/P and then went through the vacuum ejector could be controlled and adjusted simultaneously by a computer program. A designated value of suction could then be generated through the vacuum ejectors. Triangles in Fig. 4 denote the relationship between input voltages for E/P and outputted suctions. The calibrated relationships were used in controlling the suction. The error in suction controlling was less than 0.2 kPa, because the control system is automatic and feedback-controlled.
34
The negative water pressure was measured by the pressure sensors, i.e., suc1 and suc2 in Fig. 3, which ranged from -1 to 0 bars. The calibration of negative pressure sensors is shown in Fig. 4 as well and denoted by circles. Fig. 5 shows the example of suction control on a soil sample in a triaxial test, where the initial suction is 40 kPa and decreases to 0 kPa in 20 steps. Additional pressure
measurements made by mid-plane pore pressure probe (M4P in Fig. 5) and
external Druck pressure transducer (Druck in Fig. 5) were used in addition to suc1 and suc2. The rate of suction adjustment was 2 kPa/step in this test, and each step ended with the pressure reading near the step goal.
2.3 Determination of residual effective stress
The evaluation of residual effective stress can be done by measuring the suction in the soil sample. Measuring suction by undrained isotropic loading in a triaxial cell is relatively simple and convenient for the conventional triaxial testing system as discussed by Navaneethan et al. (2005). However, this technique is only reliable when the B value is very close to 1.0 (B is the Skempton’s pore water pressure parameter). For a soil sample before full saturation, the B value may be much lower than 1.0 because of the existence of air bubbles in the specimen or drainage lines. The value of suction in the soil specimen is thus expected to be overestimated significantly. The overestimated suction gives incorrect information about the residual effective stress and will result in extra isotropic consolidation on the specimen if the soil specimen is saturated at this residual effective stress.
Therefore, a direct method for measuring suction by using pressure sensors of range from -1 to 0 bar and porous ceramic filters, was adopted in this study. The limit on the suction in this study is 100 kPa due to the methods and instruments used. For measuring soil suction higher than 100 kPa, other methods are available, such as the filter paper method and high capacity tensiometers.
Performance of this measuring method will be seriously affected if the filter is not fully saturated. The initial saturation procedure for ceramic filter is similar
35
to that proposed by Ridley and Burland (1999) and Take and Bolton (2003). A chamber half full of de-aired water was prepared prior to saturating the filters. The air-dry ceramic filter was placed above the water in the chamber. Then 1 bar of vacuum was applied for one hour. Afterward, submerge the ceramic filter slowly into water while maintaining vacuum for at least 30 min. After that, vacuum was released and further time allowed for saturation of the filter under atmospheric pressure.
2.4 Experimental apparatus
A triaxial testing system, capable of performing tests at small strain and equipped for local measurements, is developed in this study. The testing system, consisting of an axial loading system, a pressure controller, and a data acquisition system, is an automated, programmable, and feedback-controlled system. A high-accuracy, direct-drive servo motor (D.D. motor) is used to provide the axial displacement in triaxial tests. As shown in Fig. 6(a), the D.D. motor (SN: NSK M-YSB 2020KN001) is fixed on the loading frame, and the transmission is an extremely precise ball screw (SN: NSK DFT 2805-5) tightened on the motor directly, i.e. no indirect transmissions such as gears or belts are used in the axial loading system.
The major advantages of a driving system with a D.D. motor are high rigidity and the absence of transmission gears. Hence, the backlash during testing was minimised to a value below the detectible limit of the displacement sensors. The resolution of the motor is 819200 steps per revolution, and every round of rotation creates 5 mm of linear motion. Thus, the minimum single axial displacement is
6.1 10 6mm (=5 819200mm), which makes it ideal for displacement-controlled tests. The maximum error due to the D.D. motor is 150 seconds in every round of rotation, i.e. the 150 seconds error will be generated in each motor rotation, i.e.
360 degrees (360 degree 60 min degree 60sec min 129200 seconds). Thus, the possible largest error in the axial displacement is 0.0116% (150 1292000),
36
or 0.58 m ( 0.0116% 5mm ) in every round of rotation of the D.D. motor.
Fig. 6(b) shows the pressure controller used in controlling the cell pressure and back pressure. The pressure controller is digital and connected to the testing system, and the resolutions for controlling and reading are 1 kPa and 0.015 kPa, respectively. This testing system uses internal measurements, including two axial and one radial local Hall effect transducers (Clayton et al. 1989), a submersible load cell (±2 kN, Sensotec), two mid-plane pore pressure probes (7 bar, GDS Instrument), and bender elements (GDS Instrument). This small strain
measurement system is capable of resolving 0.003 kPa of pore pressure, 0.001%
of axial strain, and 0.005 kPa of axial stress. The Hall effect local strain sensors, which have a linear range of ±3 mm around the electrical zero, were calibrated by a calibration rig equipped with a digital micrometer head (resolution=1 m ).
A set of bender elements was embedded in the top cap and bottom pedestal.
The shape of the received signal and uncertainties in determining the travel time of the shear wave in bender element tests were affected by near-field effects (Viggiani and Atkinson 1995; Jovicic et al. 1996; Brignoli et al. 1996). In order to understand the influence of different driven frequencies on the determination of the travel time of shear waves, bender element tests with frequencies varying from 3 kHz to 15 kHz were performed on the reconstituted Taipei silty clay at constant effective vertical stress after K0 consolidation. The methods for determining the travel time were (1) The resonance method (2) The visual inspection method, and (3) The cross-correlation method (Viggiani and Atkinson 1995; Jovicic et al. 1996;
Arulnathan et al. 1998; Lee and Santamarina 2005). The test results show that a consistent travel time or velocity can be obtained once the input frequency is higher than the resonance frequency. The disturbance of near field effect when determining the travel time is eliminated by choosing a frequency higher than the resonance frequency. Therefore a driven frequency of 10 kHz is chosen for bender element tests in this study.
37
2.5 Experimental procedure
Table 2 summarizes the triaxial tests conducted for this work. Triaxial specimens were hand-trimmed to a size of50mm×height100mm from the reconstituted samples. After mounting a specimen in the triaxial cell and installing the on-specimen sensors, the residual effective stress was measured for the
specimen tested with suction control. After suction control, the specimen was saturated at its residual effective stress. The procedure of suction control is introduced in detail as follows.
Step 1. Measure the suction in the soil specimen by a pore water pressure transducer (range from -1 to 0 bars) with a porous ceramic filter. The measured suction (s) was the initial point for controlling the suction.
Step 2. Remove the suction from the specimen gradually by a value of
s N
in each single step (where N is the number of steps).
Simultaneously, the confining pressure in the triaxial cell was also increased by the Digital Pressure Controller, in which the pressure increment was equal to s N as well. Hence, the effective stress of the specimen was kept unchanged.
Step 3. Repeat Step 2 (N-1) times. The suction in the specimen would be dissipated completely at the Nth step, and the effective stress of the specimen, equal to the residual effective stress, was now applied by the cell pressure.
Step 4. Apply a back pressure to the specimen in this step to raise the degree of saturation and simultaneously, the same amount of confining pressure should be applied until the effective stress in soil is equal to the residual effective stress.
Fig. 7 shows the variations of confining pressures, effective stresses, and pore water pressures in the specimen during the suction measurement and suction
38
control. The confining pressure was kept unchanged during the suction
measurement stage, and the effective stress in the specimen should be equal to the measured suction. After the measured suction reached equilibrium, i.e., a suction of 18.5 kPa in Fig. 7, then the suction control stage started. The suction control process was separated into 5 steps here, as shown in Fig. 7, and the adjusting suction was about 4 kPa in every single step. The cell pressure was increased simultaneously for the purpose of keeping the effective stress unchanged in each step. The effective stress in the specimen shown in Fig. 7 was always equal to the initial suction (18.5 kPa) through the whole suction control process.
For those specimens without suction control, the mean effective stresses during saturation (sat ) were set equal to 10, 5 and 2 kPa, respectively, all commonly used in the conventional saturation procedure. Each specimen was recompressed under the K0 condition to an effective vertical stress of 200 kPa or 300kPa, with full saturation (B value > 98%). Thereafter, the specimens were subjected to the axial compression under the undrained condition with a rate of 0.2
%/hr.
Bender element tests were conducted in the consolidation stage using a single-pulse sinusoidal input wave with the driven frequency determined by previous tests. The trigger points of bender element tests were at the end of every two consolidation steps. The elastic shear wave velocity, Vs, was calculated using the wave travel time determined by the visual inspection method, very close to that determined by the cross-correlation method with the chosen frequency of 10 kHz, and the tip-to-tip distance between transmitting and receiving bender elements. The shear modulus, GBE can be calculated as
2
BE s
G V (1)
where = bulk mass density of the specimen when Vs was measured.
39
3. Results of Experiments
3.1 Behaviors during K0 consolidation
Typical stress paths for triaxial tests (CK0U-AC) saturated with suction and without suction control (sat 10, 5, and 2 kPa) are shown in Fig. 8. A K0 value of approximately 0.5 is observed, reasonable for the chosen clay. The variation of
K0 with effective vertical stress for the tested clay is shown in Fig. 9. In the consolidation stage, the K0 value decreases from the initial value of 1.0 at the isotropic stress state to the end of consolidation. The final K0 values for all tests have almost converged to the value as calculated by the following equation (Mayne and Kulhawy, 1982),
sin ' 0 (1 sin ')
K OCR (2)
where ' is the effective friction angle, and OCR is the over-consolidation ratio.
The K0 value estimated by Eq. (2) is 0.53 here. Nevertheless, the K0 value for the specimen saturated with suction control is much closer to 0.53 than that of the specimen saturated without suction control when the effective vertical stress reached the pre-consolidation stress. In addition, the K0 values for the tests without suction control are all smaller than those with suction control before the effective vertical stress attained the pre-consolidation stress.
Fig. 10 shows the curve of void ratio against the logarithmic effective consolidation stress during consolidation for the tests saturated with suction control (sat 18.5kPa) and without suction control (sat 5kPa). The point A in Fig. 10 represents the stress state of soil before the sampling, i.e., at the in-situ state, where v 120 kPa. Once sampling has taken place, the stress state goes to the point B, i.e., the residual effective stress. For the conventional saturation method, i.e., when sat 5kPa, the stress state falls on the point C, with some swelling. When soil specimens were recompressed to the in-situ stress,
40
e1
(=0.063) for the test with suction control, i.e., sat 18.5kPa, was smaller than e2(=0.081) for the test without suction control, i.e., sat 5kPa. The recompression processes for both specimens saturated with and without suction control were identical. However, they resulted in different void ratio changes during recompression. It may be concluded that the quality of a specimen can be improved by the proposed suction control system.
The variation of Gvh values measured by bender elements during
recompression is shown in Fig. 11. The specimen saturated with suction control exhibited higher values of Gvh than other specimens. At the effective vertical stress equal to 147 kPa, the Gvh of the specimen saturated with suction control (sat 18.5kPa) is 14% higher than that saturated without suction control (sat 5kPa).
3.2 Stress-strain behaviors during undrained shearing
After K0 consolidation, all the specimens were subjected to undrained axial compression. Fig. 12 illustrates the differences in the initial part of the
stress-strain responses by plotting the curves of Young’s modulus normalized to the undrained shear strength. Although all degradation curves of stiffness are similar, the stiffness of the specimen saturated at sat 2kPa at small strain, i.e., strain equals 10 %3 , is about 20% lower than that saturated with suction control.
Results from the comparison of the stiffness at small strain indicate that the conventional saturation method reduces the initial stiffness of soils, and the saturation method with suction control is helpful for keeping sample quality.
The undrained failure characteristics for reconstituted clay for different sat are summarized as listed in Table 2. Unlike the stress-strain behavior at small strain level, all the tests exhibite the same value of normalized undrained shear strength, i.e., Su vc 0.3. This may imply that the undrained failure
characteristics were little affected by saturation procedure.
41
4. Discussion
Both the suction measurement and vacuum source used here were in a range of -1 to 0 bars. The applicability of the proposed method of specimen saturation in triaxial tests is limited to specimens with suction less than 100 kPa from the measurement point of view and the control point of view. For specimens whose suctions are less than 100 kPa, the proposed saturation method is effective in improving the quality of specimens as discussed in the following.
The sample quality can be evaluated by either the void ratio change during recompression or the shear modulus measured by bender elements. The void ratio changes during recompression for both tests saturated with and without suction control, i.e., sat 18.5, 10, 5 and 2kPa, are listed in Table 2. The e e0 value for the specimen saturated with suction is significantly lower than that without suction control. According to the classification of sample quality suggested by Lunne et al. (1997), as listed in Table 3, the specimen saturated with suction control can be considered as “good to fair” while the quality of the specimen saturated without suction control is regarded as “fair to poor”. The effect of improvement on the sample quality can be quantified by,
0 with SC 0 without SC
0 with SC
Improvement
e e
e e
ee
(3)
where
e e0 with SC
is the void ratio change during recompression for tests with suction control, and
e e0 without SC
is that for tests without suction control.It is noted that all the specimens tested here were produced by the same
reconstitution procedure, and should have the same quality before tests. However, the improvement of sample quality for saturation tests, with suction control, in this study ranges from 29% to 45%. This shows that applying the proposed saturation method to triaxial tests will result in better quality of sample.
42
For further comparison, the shear moduli measured by the in-situ cross-hole method, which represents the undisturbed quality and no void ratio change, and those of the reconstituted samples with/without suction control measured by bender elements are plotted against the void ratio change as shown in Fig. 13. It is clearly shown that the shear modulus of the specimen saturated with suction control is much closer to that of the in-situ state than those of specimens saturated conventionally. This figure also shows that the void ratio change during
recompression can be used to evaluate the reduction ratio of shear moduli for specimens with different degrees of disturbance. The reduction ratio of shear moduli, R, is obtained by the regression of the data points in Fig. 13 and listed as below:
0
4.126 0.996
Lab In situ
R G e e
G
(4)
where GLab is the shear moduli measured on sampled soils by bender element tests, GIn-situ is the shear moduli measured by field tests, and e e0 is the void ratio change during recompression.
For example, as calculated by Eq. (4), the shear modulus measured in the laboratory test is only 66% of that measured in the in-situ state if the void ratio change by recompression is equal to 0.08. In other words, once the shear moduli measured in laboratory tests and the void ratio changes were known, the in-situ shear moduli could be determined by Eq. (4).
The relationship, considering the effect of the anisotropic stress state on the shear moduli Gvh, was proposed by Hardin and Blandford (1989) and can be expressed as:
nv nh
vh m v h
e
a a a
G Af OCR
P P P
(5)