國立臺灣大學生物資源暨農學院農業經濟學系 碩士論文
Department of Agricultural Economics College of Bio-Resources and Agriculture
National Taiwan University Master Thesis
貿易夥伴之非關稅措施對印尼農業出口的影響
The Effect of Non-Tariff Measures by the Trading Partners on Indonesian Agricultural Exports
Indra Prabowo 殷得嵐
指導教授:雷立芬博士 Advisor: Li- Fen Lei, Ph.D.
共同指導教授 : 李栢浡博士 Co-Advisor: Pai- Po Lee, Ph.D.
中華民國 109 年 6 月 June, 2020
ACKNOWLEDGMENT
First of all, My gratitude goes to the Almighty Allah, The Sole Creator of everything and The Only One God deserved to be Worshipped, for granting me the patience, serenity, wisdom, and knowledge I needed to make this study a success.
Furthermore, my special thanks are extended to the Department of Agricultural Economics for accepting me into the program and to the Taiwan International Cooperation and Development Fund (ICDF) for awarding me a fully-funded scholarship. Without the sincere support of my main and co-advisers, Li-Fen Lei, Ph.D and Pai-Po Lee, Ph.D, respectively, this work would not have been completed, therefore my gratitude goes to them for all the lectures from the Department of Agricultural Economics who have given me support and useful feedback in completing this project.
Finally, I would like to thank my friends, classmates, and family who always share their views and give me the biggest support during these two years of master’s degree studies at National Taiwan University.
ABSTRACT
This study aims to use the frequency ratio and coverage ratio to examine the effect of Non-Tariff Measures (NTM) implementing by trade partners on Indonesian agricultural exports.
Trading countries consist of the European Union, US, Japan, China, and Australia as they are major importing countries of Indonesian cocoa, nutmeg, crude palm oil, and premium rice. This study also compares the export growth rates of Indonesia and major competing countries such as India, Thailand, and Malaysia used trade data of the following year: 2000, 2002, 2003, 2005, 2007, 2010, 2011, 2012, 2013, 2014 and 2015. The year selected are to explore the impact and changes in Indonesian trade cooperation. The major findings of this study are conveyed as follows. First of all, Indonesia's trade relations with the European Union, US, Japan, China, and Australia and other partner countries dropped in 2015 and 2016. Finally, the trade cooperation with all partner countries through a series of bilateral trade negotiations, regional and multilateral have been affected, while the relationship with the European Union enhanced. This study presents the results from agricultural exports as the dependent variable and the independent variable consisting of sanitary and phytosanitary (SPS) frequency ratio and technical barriers to trade (TBT) frequency ratio, shows the results on the effect of non-tariff policies consisting of sanitary and phytosanitary (SPS) and technical barriers to trade (TBT) on the agricultural export of Indonesian to the trading partner. If the results show that a country has a high-frequency ratio value, it means that the country is very protective of its products.
Meanwhile, the smaller value of the coverage ratio shows that the products not affected by the policy.
Keywords: Indonesia, Non-Tariff Measures (NTM), Frequency Ratio and Coverage Ratio Analysis
TABLE OF CONTENTS
ACKNOWLEDGMENT... ii
ABSTRACT ... iii
LIST OF FIGURES ... v
LIST OF TABLES ... vii
CHAPTER 1 INTRODUCTION ... 1
1.1 Background and Motivation of Study ... 1
1.2 Objectives of Study ... 5
CHAPTER 2 OVERVIEW OF THE INDONESIA ECONOMIC AND TRADE ... 7
2.1 Indonesian Economy, Exports, and Imports Performance ... 7
2.2 Non-Tariff Measures of The Trading Partner Countries ... 9
CHAPTER 3 LITERATURE REVIEW ... 17
3.1. Non-Tariff Measures ... 17
3.2. Frequency Ratio and Coverage Ratio Analysis... 19
CHAPTER 4 METHODOLOGY ... 21
CHAPTER 5 RESULTS ... 23
5.1. Data Sources and Cleaning Process ... 23
5.2. Results of Frequency Ratio and Coverage Ratio ... 24
5.3. Results of The Quantitative Descriptive Analysis ... 30
CHAPTER 6 CONCLUSIONS ... 55
REFERENCES ... 58
LIST OF FIGURES
Figure 2.1. Agricultural Sector Trade Balance, 2012 – 2015 ... 9
Figure 2.2. Total Number of NTM on Cocoa in Export Destination Countries, 2016 ... 11
Figure 2.3. Total Number of NTM on CPO in Export Destination Countries, 2016... 12
Figure 2.4. Total Number of NTM on Nutmeg in Export Destination Countries, 2016 ... 13
Figure 2.5. Total Number of NTM on Mango and Mangosteen in Export Destination Countries, 2016 ... 14
Figure 2.6. Number of NTM in Premium Rice in Export Destination Countries, 2016 ... 16
Figure 5.1. Indonesia, India, Malaysia, Philippines and Thailand Cocoa Exports to Australia, 1988 - 2017 ... 31
Figure 5.2. Indonesia, India, Malaysia, Philippines and Thailand Cocoa Exports to China, 1988 - 2017 ... 32
Figure 5.3. Indonesia, India, Malaysia, Philippines and Thailand Cocoa Exports to the European Union, 1988 - 2017 ... 33
Figure 5.4. Indonesia, India, Malaysia, Philippines and Thailand Cocoa Exports to Japan, 1988 - 2017 ... 34
Figure 5.5. Indonesia, India, Malaysia, Philippines and Thailand Cocoa Exports to the United States, 1988 - 2017 ... 35
Figure 5.6. Nutmeg Exports of Indonesia, India and Malaysia to Australia, 1988 - 2017 ... 36
Figure 5.7. Nutmeg Exports of Indonesia, India and Malaysia Nutmeg Export to China, 1988 - 2017 ... 37
Figure 5.8. Nutmeg Exports of Indonesia, India and Malaysia Nutmeg Export to the EU, 1988 - 2017 ... 38
Figure 5.9. Indonesia and Malaysia CPO Exports to Australia, 1989 - 2017 ... 41
Figure 5.10. Indonesia and Malaysia Crude Palm Oil Exports to China, 1989 – 2017 ... 42
Figure 5.11. Indonesia and Malaysia Crude Palm Oil Exports to the European Union, 1989 - 2017 ... 43
Figure 5.12. Indonesia and Malaysia CPO Exports to Japan, 1988 – 2017 ... 44
Figure 5.13. Indonesia and Malaysia CPO Exports to The United States, 1989 – 2017 ... 45
Figure 5.14. Indonesia, India, Malaysia, Philippines and Thailand Mango and Mangosteen Export to Australia, 1988 – 2017 ... 46 Figure 5.15. Indonesia, India, Malaysia, Philippines and Thailand Mango and Mangosteen
Exports to China, 1988 – 2017 ... 47 Figure 5.16. Indonesia, India, Malaysia, Philippines and Thailand Mango and Mangosteen
Exports to EU, 1989 – 2017 ... 48 Figure 5.17. Indonesia, India, Malaysia, Philippines and Thailand Mango and Mangosteen
Exports to Japan, 1988 – 2017 ... 49 Figure 5.18. Indonesia, India, Malaysia, Philippines and Thailand Mango and Mangosteen
Exports to US, 1988 – 2017 ... 50 Figure 5.19. Indonesia, India and Thailand Premium Rice Exports to the EU, 1988 – 2017 ... 52 Figure 5.20. Indonesia, India and Thailand Premium Rice Exports to Japan, 1988 - 2017 ... 53 Figure 5.21. Indonesia, India and Thailand Premium Rice Exports to the United States, 1988 –
2017 ... 54
LIST OF TABLES
Table 2.1. Development of Exports, Imports and Trade Balance of Indonesian Agricultural Commodities, 2012 – 2015 ... 8 Table 4.1. Variable Description ... 22 Table 5.1. Frequency Ratio and Coverage Ratio of NTM by Products and Export Destination
Countries, 2000 ... 24 Table 5.2. Frequency Ratio and Coverage Ratio of NTM by Products and Export Destination
Countries, 2002 ... 25 Table 5.3. Frequency Ratio and Coverage Ratio of NTM by Products and Export Destination
Countries, 2003 ... 25 Table 5.4. Frequency Ratio and Coverage Ratio of NTM by Products and Export Destination
Countries, 2005 ... 26 Table 5.5. Frequency Ratio and Coverage Ratio of NTM by Products and Export Destination
Countries, 2007 ... 26 Table 5.6. Frequency Ratio and Coverage Ratio of NTM by Products and Export Destination
Countries, 2010 ... 27 Table 5.7. Frequency Ratio and Coverage Ratio of NTM by Products and Export Destination
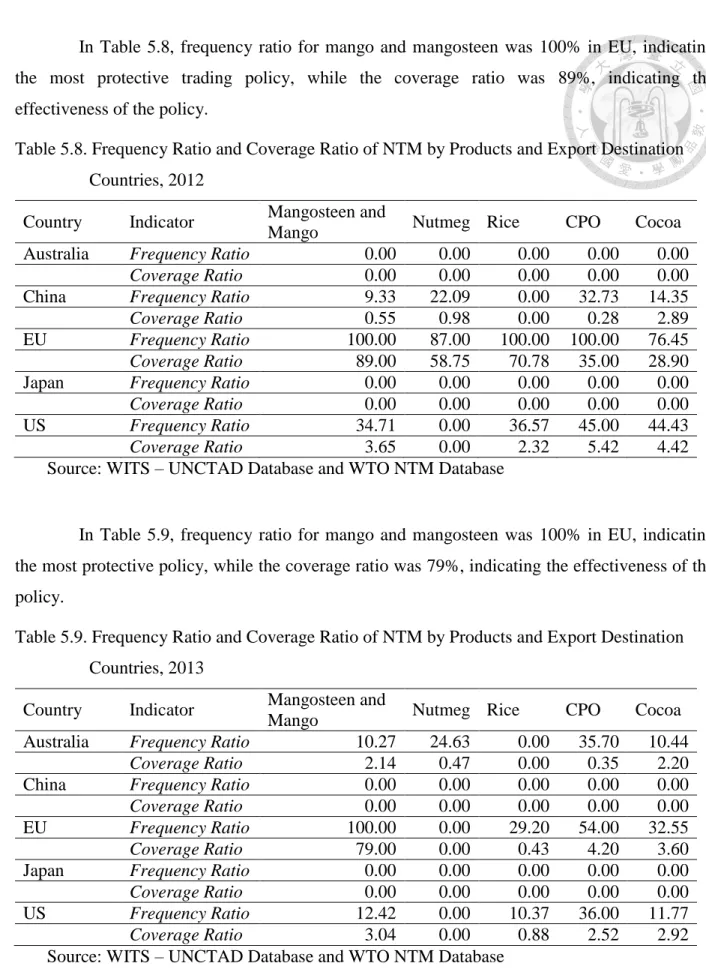
Countries, 2011 ... 27 Table 5.8. Frequency Ratio and Coverage Ratio of NTM by Products and Export Destination
Countries, 2012 ... 28 Table 5.9. Frequency Ratio and Coverage Ratio of NTM by Products and Export Destination
Countries, 2013 ... 28 Table 5.10. Frequency Ratio and Coverage Ratio of NTM by Products and Export Destination
Countries, 2014 ... 29 Table 5.11. Frequency Ratio and Coverage Ratio of NTM by Products and Export Destination
Countries, 2015 ... 29 Table 5.12. Number of NTM on Cocoa by Trading Countries, 2000 – 2015 ... 30 Table 5.13. Average Growth Rate of Indonesia, India, Malaysia, Philippines and Thailand Cocoa
Exports to Australia, 1988 - 2017 ... 31 Table 5.14. Average Growth Rate of Indonesia, India, Malaysia, Philippines and Thailand Cocoa
Exports to China, 1988 – 2017... 32
Table 5.15. Average Growth Rate of Indonesia, India, Malaysia, Philippines and Thailand Cocoa Exports to the EU, 1988 – 2017 ... 33 Table 5.16. Average Growth Rate of Indonesia, India, Malaysia, Philippines and Thailand Cocoa
Exports to Japan, 1988 – 2017 ... 34 Table 5.17. Average Growth Rate of Indonesia, India, Malaysia, Philippines and Thailand Cocoa
Exports to the United States, 1988 – 2017 ... 35 Table 5.18. Number of NTM on Nutmeg by Trading Countries, 2000 – 2015 ... 36 Table 5.19. Average Growth Rate of Indonesia, India, and Malaysia Nutmeg Export to Australia,
1988 - 2017 ... 37 Table 5.20. Average Growth Rate of Indonesia, India and Malaysia Nutmeg Export to China,
1988 - 2017 ... 38 Table 5.21. Average Growth Rate of Indonesia, India and Malaysia Nutmeg Export to the EU,
1988 - 2017 ... 39 Table 5.22. Number of NTM on CPO by Trading Countries, 2000 - 2015 ... 40 Table 5.23. Average Growth Rate of Indonesia and Malaysia CPO Exports to Australia, 1989 -
2017 ... 41 Table 5.24. Average Growth Rate of Indonesia and Malaysia Crude Palm Oil Exports to China,
1989 - 2015 ... 42 Table 5.25. Average Growth Rate of Indonesia and Malaysia Crude Palm Oil Exports to the
European Union (EU), 1989 – 2015 ... 43 Table 5.26. Average Growth Rate of Indonesia and Malaysia Crude Palm Oil Exports to Japan,
1989 - 2015 ... 44 Table 5.27. Average Growth Rate of Indonesia and Malaysia Crude Palm Oil Exports to The
United States, 1989 - 2015 ... 45 Table 5.28. Number of NTM on Mango and Mangosteen by Trading Countries, 2000 – 2015 .. 46 Table 5.29. Average Growth Rate of Indonesia, India, Malaysia, Philippines and Thailand
Mango and Mangosteen Exports to China, 1988 – 2017 ... 47 Table 5.30. Average Growth Rate of Indonesia, India, Malaysia, Philippines and Thailand
Mango and Mangosteen Exports to EU, 1988 – 2017 ... 48 Table 5.31. Average Growth Rate of Indonesia, India, Malaysia, Philippines and Thailand
Mango and Mangosteen Exports to Japan, 1988 – 2017 ... 49
Table 5.32. Average Growth Rate of Indonesia, India, Malaysia, Philippines and Thailand Mango and Mangosteen Exports to US, 1988 – 2017 ... 50 Table 5.33. Number of NTM on Premium Rice by Trading Countries, 2000 - 2015 ... 51 Table 5.34. Average Growth Rate of Indonesia, India and Thailand Premium Rice Exports to
The European Union (EU), 1988 – 2017 ... 52 Table 5.35. Average Growth Rate of Indonesia, India and Thailand Premium Rice Exports to
Japan, 1989 – 2017... 53
CHAPTER 1 INTRODUCTION
1.1 Background and Motivation of Study
Indonesia as one of the agrarian countries has great potential in the agricultural sector.
In the last five years, the contribution of the agricultural sector to the national economy has become increasingly apparent, with the average contribution of the agricultural sector to GDP reaching 10.26% and growth around 3.90%. The plantation sub-sector is the biggest contributor to the GDP of the agricultural sector. The potential yield of Indonesian plantation production shows positive growth in several types of commodities. The contribution of agricultural gross domestic product (GDP) in 2014 was USD 87.923 million or 10.26% of the national GDP the amount of USD 856.812 million (Ministry of Agriculture Republic of Indonesia, 2015). The potential of plantations and horticulture for five types of commodities with a high enough quantity of production and experiencing relatively positive growth even though it experienced a decline but the following year has increased, therefore Indonesia will increase these commodities for export to trading partners.
Agricultural products have always been a superior trading item in Indonesia. According to the official data, the value of agricultural exports during the period of January through August in 2017 had a surplus with exports reached 22.18 billion US dollars, while the import value was only 11.20 billion dollars (Statistics, 2017). Agricultural exports, including palm oils, and cocoa, represent 22.14 percent of total exports. Although the trade share of contribution to GDP started to decrease in the past decade, the contribution of agricultural trade provides a positive proportion of GDP thereby increasing Indonesia's economic development (Agency, 2017). At the micro level, the opportunities offered by international trade meaningful for agricultural products is not only limited to "traded commodities" but also a source of livelihoods of at least 7 million small farmers in rural areas are still vulnerable to the problem of poverty.
Even though the performance of agricultural exports is quite good, Indonesia still is in a phase that is increasingly difficult to predict. Some of the phenomena that are supposed to be a strong cause of the pressure include a reduced supply of agricultural products as commodities or land competition with other sectors, as well as the uncertainty of the world's ability to meet the food consumption due to climate change is increasingly noticeable. The interaction of supply
and demand shows that the relationship between the increase in the population of Indonesia and the implications of the increase derived demand by increasing consumption of agricultural products, especially food crops, is not matched by an adequate food supply causes an increased risk of food security (Hartati et al., 2015). The rebound international agricultural commodity prices were felt not to be a significant incentive for the acceleration of exports. Thus Indonesia cannot quickly respond to the increase in prices by increasing supply. On the other hand, trade in agricultural products from the import side is also very crucial, especially if linked to the stabilization of prices of agricultural products in Indonesia. Imports of raw materials and auxiliary materials such as agro-industries in the manufacturing sector also deserve attention due to the unavailability of raw materials in the domestic market or availability in inadequate quantities.
Response measures to the agricultural products trade issue usually include the use of non-tariff measures (NTMs), which are policy strategy steps in addition to tariffs which can affect influencing and controlling international trade flows. The contribution of non-tariff barriers to trade barriers in general is greater than the tariff barriers and protection in the agricultural sector is greater than in the manufacturing sector. On average, the protection is predicted to be twice as large, indicating that countries whose export composition depends on agricultural products will tend to experience more severe market access problems than countries that specialize in manufactured products (Fakhrudin, 2008). In implementing non-tariff barriers discussions are held and NTMs imposed from year to year following the agreement between countries. The implementation of non-tariff barriers gives the appearance to indications and thoughts that position these barriers as one of the triggers for the decline in exports of certain commodities of a country (Anggoro & Widyastutik, 2016).
In the context of Indonesia's agricultural trade system, it faced significant challenges due to the global constellation under the shadow of the protectionism trend. The Brexit case and the economic policy of Donald Trump’s administration certainly being some of the indicators.
Meanwhile, according to the G20, its members are responsible for 81% of protectionist measures worldwide in 2015. The G20 also considers that the protectionism that exists today is far beyond the issue of anti-trade rhetoric, but this issue is deeper and the implications for the country's political choice. Besides the action of protectionism, Indonesia is faced with the issue of
increased global trade-restrictive measures, as stated by the World Trade Organization (WTO) (2015) that since the global economic crisis hit in 2008, there has been an increase of trade- restrictive measures. Up until October 2014, a total of 2,146 new trade-restrictive measures 508 actions or 24% of the total action has been removed, leaving 76% of total actions which is as much as 1,638 measures.
In addition, Indonesia now has now joined in trade cooperation with trading partner countries through the Economic Partnership Agreement (EPA), the Free Trade Agreement (FTA), the Comprehensive Economic Partnership Agreement (CEPA), the Comprehensive Economic Cooperation Agreement (CECA), Comprehensive Trade and Economic Partnership (CTEP) and Preferential Tariff Agreement (PTA) due to the fact the country is still facing challenges associated with an increase in market access. As the level of rates in various countries are lowered substantially through a series of bilateral trade negotiations, multilateral, and across the continent, the number and role of various forms of non-tariff trade barriers increase (Salvatore, 2016).
Indonesia has made various efforts to eliminate the impacts of Non-Tariff Measures used by trading partner countries. As the major trading partner countries such as U.S. China, Japan, Australia, always protect their economic interests by using NTMs (Anggoro &
Widyastutik, 2016). Non-tariff barriers have been found to be affecting Indonesia’s cocoa export to the European Union. In addition, Azizah (2015) mentioned that Indonesian crude palm oil (CPO) exports to the European Union in the 2000-2011 period had fluctuated for nearly eleven years due to the same issue. Therefore, this research tries to see what factors influenced the decline in CPO export volume and at the same time also make efforts to safeguard against the national policy. Indonesia actively coordinates with all stakeholders to prepare the position of Indonesia concerning the policies of partner countries that can inhibit access to the Indonesian export market, then deliveries their decision at sessions in the World Trade Organization (WTO) forum and meetings conducted regionally and bilaterally.
The implementation of the NTM policy, Sanitary and Phytosanitary (SPS) and technical barriers to trade (TBT) should be taken into consideration as it usually applies in many countries, for example in Asian, European countries and the US. As indicated by studies concerning the effect of NTM on agricultural exports in China, the European Union, Australia, Japan and the
United States of America (Anggoro & Widyastutik, 2016). Regarding the effect of SPS from the perspective of exporters in China. Since SPS and TBT also apply in the European Union, it is a logical consequence that cocoa and palm oil exporters wishing to enter the European Union market must pay attention to various requirements set by the European Union government. These requirements include quality standards that are usually also associated with environmental, health, safety, labor and business ethics requirements (Azizah, 2015).
Therefore, currently many countries secured their interests by applying standardization as an instrument of carrying out patents trade barriers to protect the interests of their countries.
This phenomenon shows that the current trade has experienced a shift from price-oriented to quality-oriented. Thus, standardization is the main instrument to improve the competitiveness of a nation's products. In addition, each country has a social interest in the products to be consumed both in terms of health (the health of human today and future as well as the health of animals) and safety (safety for consumers, especially children), as well as products that do not damage the environment from the producer side, business interests are prioritized, especially the quality of products that will involve standards and quality (Ministry of Trade Republic of Indonesia, 2012).
At the forum of the WTO multilateral negotiations, in order to lower the index value of the NTM an in depth analysis of the Trade Policy Review (TPR) issued by countries that are major trading partners of Indonesia and requested clarification on the forum Trade Policy Review Mechanism (TPRM) to Indonesia is done, as well as asking for clarifications and imposing objections to the main trading partner countries through Committee and the council in WTO takes place (UNCTAD, 2018).
At the regional negotiating forum, special talks in The Association of Southeast Asian Nations (ASEAN), now routinely conduct discussions on NTM and update bilateral settlement recorded in advance and tidy process at the matrix case in ASEAN and the Non-Tariff Measures (NTMs) are published on the website of the ASEAN Secretariat. The opening of trade through FTA under bilateral and regional trade agreements that increase the number of NTMs in several major countries is designed to protect the domestic company and industry can be negotiated. In the case of ASEAN trade cooperation, the number of NTMs increased from 1,634 to 5,975 in the
period 2000 to 2015 (Ing et al., 2016). And are also believed to be one of the causes of shallow integration in ASEAN.
1.2 Objectives of Study
From the exposure of the background and context of the above issue, it is important to analyze the trade cooperation between Indonesia and trading partner countries in order to provide valuable information for policymakers to initiate trade strategies. Especially, Indonesia needs to deepen the analysis of the impacts of the implementation of the Non-Tariff Measures by trading partner countries. Various approaches and techniques used to assess the impact of non- tariff measures with a focus on technical regulations will be discussed in the study. For example, Sanitary and Phytosanitary and Technical Barrier to Trade which focuses on protecting human life or animals from other substances, contaminants, toxins or disease-causing organisms in food, the prevention or limitation of damage to the country from pests and protection of biodiversity these barrier includes a variety of technical regulation and conformity assessment procedures.
This study is going to use descriptive analysis that describes the general conditions regarding the performance of Indonesian agricultural export trade and trade policies regarding NTMs, with a special focus on SPS and TBT applied by the trading partner countries. Fugazza (2013) used the frequency ratio and coverage ratio to analyze non-tariff measures is first presented. The frequency ratio and coverage ratio are to examine the impact of non-tariff measures on Indonesian agricultural exports. In addition, Quantitative Descriptive Analysis based on UNCTAD (2015) data was used to identify the type of non-tariff measures applied to Indonesia and other trading partner countries.
The specific objectives of this study are:
1. To identify types of Non-Tariff Measures used by trading partner countries for Indonesian agricultural products.
2. To examine the impacts of Non-Tarif Measures used on Indonesian agricultural exports by calculating the frequency ratio and coverage ratio.
3. To provide recommendations on how to increases the competitiveness of Indonesian agricultural products whilst facing non-tariff barriers from trading partner countries.
This study will examine trade partner countries consisting of the European Union, US, Japan, China, and Australia as they are major importing countries of Indonesian cocoa, nutmeg, crude palm oil, and premium rice. This study also compares the export growth rates of Indonesia and major competing countries such as India, Thailand, and Malaysia used trade data of the year 2000, 2002, 2003, 2005, 2007, 2010, 2011, 2012, 2013, 2014 and 2015 based on Quantitative Descriptive Analysis. The years selected are to explore the impact and changes in Indonesian trade cooperation.
This study consists of 6 chapters. The first chapter is the introduction of the study.
Chapter 2 overview of the Indonesian Economy and Trade. Chapter 3 discusses a selection of previous studies and researches. Chapter 4 conveys research methods and used to analyze the data, Chapter 5 consists of the data source collection, analysis and discussion of the results. In the final chapter, a conclusion is drawn based on the results of the analysis and give some policy recommendation.
CHAPTER 2 OVERVIEW OF THE INDONESIA ECONOMIC AND TRADE
This chapter consists of 2 parts. First, the overview of the Indonesian Economic and Trade. Second the existing condition of Non-Tariff Measures with trading partner countries.
2.1 Indonesian Economy, Exports, and Imports Performance
The role of the agricultural sector occupies a decisive position in increasing Indonesia's economic activity, it can be seen by looking at the contribution of the agricultural sector to the Gross Domestic Product (GDP) in 2015 which amounted to 13.08% where the value occupies the third position after the manufacturing industry sector and the wholesale and retail trade sector (car and motorcycle repair). The agricultural sector to GDP consists of several commodities, including agriculture, livestock, agricultural services (food crops, horticulture, plantation, livestock), forestry and logging and fisheries. In the agricultural sector, the plantation is one of the sectors that contributed positively to gross domestic product GDP, wherein 2015 it made a significant contribution of 3.90% by occupying the first position after outperforming the food crops and the fisheries, in addition, is a supplier of raw materials for industrial needs, accommodate workers and one source of foreign exchange for the economy.
Agricultural commodity trading activities between countries are inseparable from export- import activities which are based on differences in needs and differences in the availability of resources as raw materials. The performance of agricultural sector trade activities can be known by looking at foreign trade balance. Trade activities for agricultural commodities consist of food crops, horticulture, estate crops and livestock sectors, which from 2012 to 2015 saw a surplus both in terms of trade balance volume and trade balance value.
According to Table 2.1, the trade balance of agricultural commodities during the 2012 - 2015 period fluctuated with a downward trend. It can be seen that in 2012 the trade balance was worth US $ 16.10 billion, but in 2013 the trade balance experienced a surplus which declined to US $ 14.25 billion, although on the other hand the volume of the trade balance increased by 9.29 million tons. In 2014, the trade balance experienced a surplus with a tendency to decrease to US
$ 13.88 billion with a volume of 10.70 million tons, while in 2015 the trade balance surplus in the agricultural sector had reached US $ 7.34 billion. If you look at the average growth per year,
the volume of trade balance surplus from 2012 - 2014 experienced a significant increase with an average value of 51.14% per year. The contribution to the increase in trade rate was influenced by export volume growth of 8.45% per year while import volumes decreased by 0.51% per year.
Table 2.1. Development of Exports, Imports and Trade Balance of Indonesian Agricultural Commodities, 2012 – 2015
No Description Year
2012 2013 2014 2015
1 Export
- Volume (Ton) 30,670,776 33,482,321 36,071,479 29,145,234 - Value (thousand US $) 33,661,210 30,689,919 31,038,752 21,223,738 2 Import
- Volume (Ton) 25,705,543 24,193,199 25,370,028 19,129,666 - Value (thousand US $) 17,556,682 16,430,328 17,154,557 13,885,587 3 Balance
Trading
- Volume (Ton) 4,965,233 9,289,122 10,701,451 10,015,567 - Value (thousand US $) 16,104,528 14,259,591 13,884,195 7,338,151 Source: Ministry of Agriculture Republic of Indonesia, 2015
Based on Figure 2.1, the value of the trade balance showed a decrease in the surplus with an average annual decline of 7.04%, where the average decline in the value of exports was 3.85% per year while the value of agricultural commodity imports decreased by 1% per year.
Meanwhile, the trade balance diagram based on the agricultural sector.
The plantation commodity has a strategic position in the national economy, which has a relatively positive trend in the trade balance of the agricultural sector. This is inseparable from the role of the plantation sub-sector which always provides a surplus so that it can cover the deficit of other sub-sectors. The surplus that occurred in the agricultural sector is inseparable because the majority is sourced from the export value of the plantation commodity, where the percentage of imports is relatively lower, while for other sub-sectors the value of imports is relatively greater when compared to the export value, resulting in a trade balance deficit.
The surplus in the trade balance of the plantation commodity in 2012 reached US $ 27.79 billion and in 2013 decreased by US $ 25.23 billion, while in 2014 it increased by US $ 25.69 billion, but in 2015 decreased again by US $ 17.78 billion, the average annual growth decreased by 3.70%. While for the percentage of growth in the trade balance value of the food crops,
horticulture and animal husbandry sub-sectors tended to experience a deficit during the period of 2012 through 2015, the magnitude of the deficits in the food, horticulture and animal husbandry sub-sectors tended to decrease by US $ 11.49 billion.
Figure 2.1. Agricultural Sector Trade Balance, 2012 – 2015 Source: Ministry of Agriculture Republic of Indonesia, 2015
2.2 Non-Tariff Measures of The Trading Partner Countries
Sanitary and Phytosanitary and Technical Barriers to Trade are part of the technical measures. Both policies are intended as an act of protection for humans, animals, and plants, and includes a variety of technical regulations and conformity assessment procedures. The use of specific SPS much effect on the agricultural sector and products of animal origin. Cadot et al.
(2012) describe the Sanitary and Phytosanitary as a policy that is applied to protect human life or animals from other substances, contaminants, toxins or disease-causing organisms in food; to protect human life from congenital diseases of both animals and plants; to prevent or limit damage to the country from pests and to protect biodiversity.
2012 2013 2014 2015
Crops -7600000 -6500000 -6850000 -7420000
Horticulture -1500000 -1120000 -1050000 -560000
Plantation 27790000 25230000 25690000 17780000
Husbandry -2250000 -2430000 -3500000 -1620000
-10000000 -5000000 0 5000000 10000000 15000000 20000000 25000000 30000000
Billion USD
Technical Barriers to Trade applied more widely in the various sectors. According to UNCTAD (2013), Technical Barriers is the action that refers to the technical regulations, and conformity assessment procedures with technical regulations and standards, including the measures in the SPS agreement. Technical regulation is a document that establishes the product characteristics or associated with the production process and administrative provisions. It also includes symbols, packaging, or labeling as used in the product, process, or production method.
Whereas the conformity assessment procedure is a procedure used either directly or indirectly to determine that the requirements been relevant or implement standards in technical regulations.
2.2.1. Cocoa
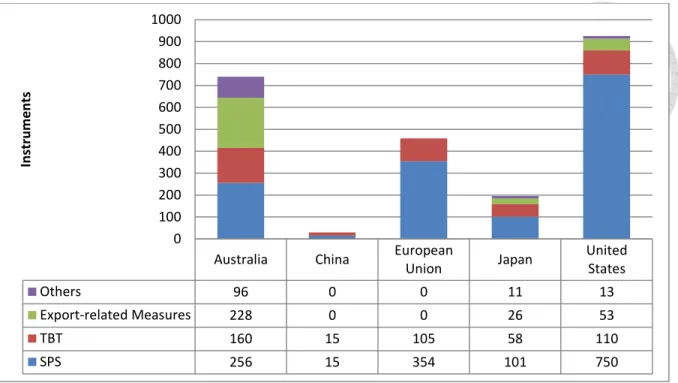
Based on Figure 2.2, total Non-Tariff Measures imposed on export destinations for cocoa in 2016 are as many as 2,351 instruments which are dominated by the Sanitary and Phytosanitary Measures (1476 instruments), Technical Barriers to Trade (448 instruments), Export Related Measures (307 instruments) and others (120 instruments). The phenomenon of an increase in the implementation of the number of Non-Tariff Measures represents the characteristics of a modern economy which consumers are demanding more variety of products and focusing attention on the level of product safety. Consumers are naturally inclined to switch to products with higher quality and more secure when their income increases.
Implementation of the increasingly massive Non-Tariff Measures does not only reflect the shift in consumer preferences also shows that regulators want to minimize the risks related to safety and the environment on products traded. The effect of trade liberalization has resulted in more variety of imported products related to the heterogeneity of product quality also are expected to increase.
Figure 2.2. Total Number of NTM on Cocoa in Export Destination Countries, 2016
Source: WITS - UNCTAD and WTO NTM Database
Meanwhile, at country level, it can be identified that the United States is a country that implements most of the Non-Tariff Measures for cocoa commodities compared to other countries with 926 instruments, followed by Australia (740 instruments), Japan (196 instruments) and the EU (459 instruments), and China (30 instruments). Dominance Sanitary and Phytosanitary is the instrument most widely implemented on imported cocoa products all over the country, followed by the Technical Barriers to Trade.
Europe became the largest market in the world with about 325 million consumers. In the single market, the European Economic Community (EEC or EU) applies a new approach to achieve harmonization and standardization. The new approach is to serve as a legal basis for setting European standards. Producers must observe and implement the safety requirements in each of the goods it produces. Each European country has national standards and technical regulations on their own. Cocoa exporters, including Indonesia if you want to access the European market should pay attention to the various requirements of EU governments. These requirements include quality standards usually associated with the environment, health, safety, labor, and ethics in business (PARLIAMENT, 2002).
Australia China European
Union Japan United
States
Others 96 0 0 11 13
Export-related Measures 228 0 0 26 53
TBT 160 15 105 58 110
SPS 256 15 354 101 750
0 100 200 300 400 500 600 700 800 900 1000
Instruments
2.2.2. Crude Palm Oil (CPO)
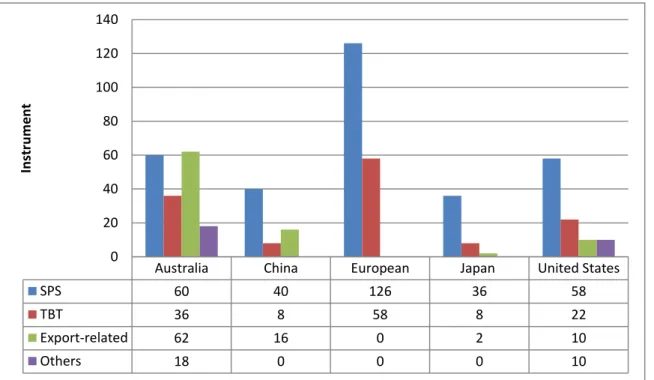
As shown in Figure 2.3, total NTM imposed on export destinations for commodities Crude Palm Oil that can be identified are as many as 570 instruments which are dominated by the Sanitary and Phytosanitary Measures (320 instruments), Technical Barriers to Trade (132 instruments), Export Related Measures (90 instrument) and others (28 instruments). The EU is the country with the greatest incidence of Crude Palm Oil Non-Tariff Measures. Some policies inhibit the entry of Crude Palm Oil to the EU with 184 instruments when compared with Australia (176 instruments), US (100 instruments), China (64 instruments), and Japan (46 instruments). Starting in 2021, the European Union is planning to ban the use of palm oil as a biofuel feedstock.
Figure 2.3. Total Number of NTM on CPO in Export Destination Countries, 2016
Source: WITS - UNCTAD and WTO NTM Database
Several other obstacles found to be associated with the policy of Non-Tariff Measures for Crude Palm Oil products are non-automatic licensing and technical requirements in fumigation procedure by Malaysia, the General Administration of Quality Supervision, Inspection and Quarantine to be free from viruses zika by the Chinese state, as well as food safety law set by the EU. In addition, the dispute between Indonesia and the European Union are still happening in the WTO's Dispute Settlement mechanism Biodiesel Products. Indonesian palm oil companies
Australia China European Japan United States
SPS 60 40 126 36 58
TBT 36 8 58 8 22
Export-related 62 16 0 2 10
Others 18 0 0 0 10
0 20 40 60 80 100 120 140
Instrument
affected by the dumping margins ranging from 8.8% to 20.5%. Basic lawsuit Indonesia as the complainant is:
• EU uses cost adjustment in the calculation of the dumping margin for Indonesia
• EU to apply the amount of profit that is considered high
• Europe concludes biodiesel product from Indonesia has cheaper rates when compared to the products of biodiesel from other materials, such as soybean oil. It is considered improper and discriminatory because the productivity of palm oil is higher than other vegetable oil crops.
2.2.3. Nutmeg
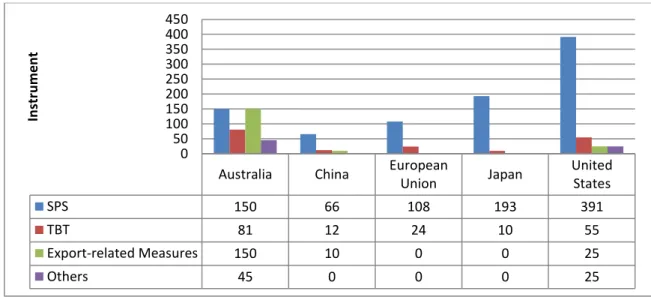
Based on Figure 2.4, total Non-Tarif Measures imposed on export destinations for nutmeg in 2016 that can be identified are as many as 1,345 instruments which are dominated by the Sanitary and Phytosanitary Measures (908 instruments), Technical Barriers to Trade (182 instruments), Export Related Measures (185 instruments) and others (70 instruments).
Meanwhile, if the analysis of inventory Non-Tarif Measures performed, can be identified that the United States is a country that implements most of the non-tariff measures to nutmeg be compared with other States with 496 instruments, followed by Australia (426 instruments), Japan (203 instruments) and the EU ( 132 instruments), and China (88 instruments). Sanitary and Phytosanitary Dominance is an instrument of the most widely implemented in products imported nutmeg whole country followed by the Technical Barriers to Trade.
Figure 2.4. Total Number of NTM on Nutmeg in Export Destination Countries, 2016
Source: WITS - UNCTAD and WTO NTM Database
Australia China European
Union Japan United
States
SPS 150 66 108 193 391
TBT 81 12 24 10 55
Export-related Measures 150 10 0 0 25
Others 45 0 0 0 25
0 50 100 150 200 250 300 350 400 450
Instrument
2.2.4 Mango and Mangosteen
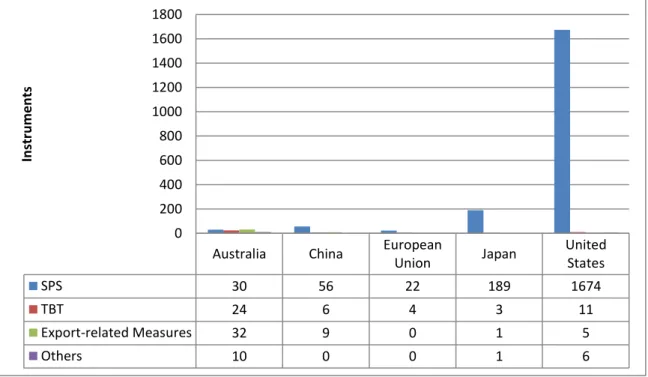
In Figure. 2.5, total non-tariff measures imposed on export destinations for mango and mangosteen in 2016 are as many as 2,083 instruments which are dominated by the Sanitary and Phytosanitary Measures (1,971 instruments), Technical Barriers to Trade (48 instruments), Export-related Measures (47 instruments) and others (17 instruments). Meanwhile, it can be identified that the United States is a country that implements most of the non-tariff measures for commodities mango and mangosteen be compared other countries with 1696 instruments, followed by Japan (194 instruments), Australia (96 instruments), China (71 instruments), and the EU (26 instruments). Sanitary and Phytosanitary Dominance is an instrument of the most widely implemented in products imported mango and mangosteen whole country followed by the Technical Barriers to Trade.
Figure 2.5. Total Number of NTM on Mango and Mangosteen in Export Destination Countries, 2016
Source: WITS - UNCTAD and WTO NTM Database
Australia China European
Union Japan United
States
SPS 30 56 22 189 1674
TBT 24 6 4 3 11
Export-related Measures 32 9 0 1 5
Others 10 0 0 1 6
0 200 400 600 800 1000 1200 1400 1600 1800
Instruments
In May 2013, China suspended the import of mangosteen from Indonesia because the Indonesian mangosteen fruit does not meet health requirements. Chinese quarantine agency The General Administration of Quality Supervision, Inspection, and Quarantine (AQSIQ) suggested that the Indonesian mangosteen fruit found any intruder organism of plants (OPT) and heavy metal content that does not comply with the provisions in China. The refusal threatened areas that became the center of the mangosteen fruit producer in Indonesia, such as Tasikmalaya District, Sawahlunto / Sijunjung, Tapanuli, and Agam City.
Indonesian mangosteen exports cannot directly to China, but can be exported via Thailand, Vietnam, and Malaysia. The Government of Indonesia and China have discussed the regulations and import requirements mangosteen for a long time. However, the Chinese side has always postponed the agreement deal because there are still some rules that need to be revised by the Chinese government. In late October 2016, Indonesia has finally taken legal action against China to the World Trade Organization (WTO) since the signing of the protocol has been stalling the import of mangosteen. Indonesian government to enter into the case Specific Trade Concern (STCs). This case is related to the specific regulations or procedures applied by import countries that are inhibited the tariff, as a rule, SPS, and technical barriers to trade.
2.2.5. Premium Rice
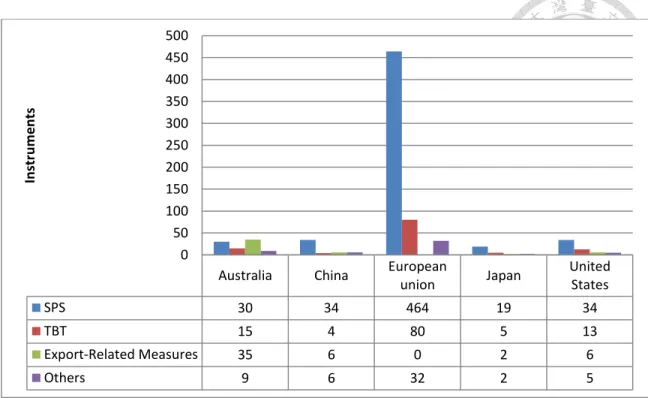
Based on Figure 2.6, total Non-Tariff Measures imposed on export destinations for commodities of premium rice in 2016 that can be identified are as many as 801 instruments which are dominated by the Sanitary and Phytosanitary Measures (581 instruments), Technical Barriers to Trade (117 instruments), Export Related Measures (49 instruments) and the others (54 instruments). Meanwhile, if the Non-Tariff Measures inventory analysis performed at the State level, it can be identified that the EU is a country that implements most of the Non-Tariff Measures for premium rice commodity be compared other countries with 576 instruments, followed by Australia (89 instruments), the US (58 instruments), China (50 instruments), and Japan (28 instruments). Sanitary and Phytosanitary (SPS) Dominance is the instrument most widely implemented on premium rice imported products all over the country, followed by the Technical Barriers to Trade.
Figure 2.6. Number of NTM in Premium Rice in Export Destination Countries, 2016
Source: WITS - UNCTAD and WTO NTM Database
Non-Tariff Measures coverage includes all instruments other than tariffs, ranging from labeling requirements to macro coverage that can affect trade policy. It has grown and developed as a fairly massive tariff reduction effort and sometimes eliminated through several comprehensive and preferential trade agreements, such as WTO and earlier, and regional trade agreements (RTA). Within the scope of Non-Tariff Measures, specifically for SPS and TBT have been proliferated/developed. These actions have similarities regarding standard actions, which can affect the costs and potential of demand by attempting to overcome market imperfections and external influences (Beghin, 2013).
Australia China European
union Japan United
States
SPS 30 34 464 19 34
TBT 15 4 80 5 13
Export-Related Measures 35 6 0 2 6
Others 9 6 32 2 5
0 50 100 150 200 250 300 350 400 450 500
Instruments
CHAPTER 3 LITERATURE REVIEW
This chapter consists of 2 parts, which are the literature of Non-Tariff Measures related to frequency ratio and coverage ratio analysis of papers.
3.1. Non-Tariff Measures
The non-tariff measures related articles reviewed in this section that particular technical measures have become a prominent feature in the regulation of international trade in goods. The papers present a review of recent work of both theoretical and the impact of non-tariff measures with a focus on technical regulations.
Fugazza (2013) used a variable data description analysis method to analyze technical regulation, while it was imposed on tariff lines from 1999 to 2010. The bulk of technical regulations are grouped into two major categories, namely sanitary or phytosanitary measures and technical barriers to trade. The former includes regulations and restrictions to protect human, animal or plant life and health, while the latter addresses all other technical regulations, standards, and procedures. SPS measures and TBTs are the objects of two WTO agreements that impose disciplines to trade that go beyond the usual non-discrimination. The objective and legal framework, SPS measures, and TBTs can have important effects on international trade. In terms of incidence, TBTs are by far the most used regulatory measures, with the average country imposing them on about 30 percent of products and trade. Countries also impose SPS measures on an average of approximately 15 percent of trade. The large incidence of TBTs and SPS measures raises concerns for developing country's exports.
Each country involved in trade aim at protecting its economic interests (Anggoro &
Widyastutik, 2016). For example, regarding non-tariff barriers and factors affecting Indonesian cocoa exports in the European Union, problems were discovered when Indonesian commodities entered the European Union region, non-tariff barriers in the form of cocoa quality and quality standards being a factor that became an obstacle, this known as Non-Tariff Measures in the form of Sanitary and Phytosanitary policies and Technical Barriers Trade. The research found that GDP per capita of exporting and importing countries, the economic distance between exporting and importing countries, the exchange rate of exporting countries to importing countries, and
tariffs have a significant effect on Indonesian cocoa export (Anggoro & Widyastutik, 2016). The most influential variable on Indonesian cocoa exports from the estimated gravity model is economic distance with the largest estimated coefficient value. The calculation result of the non- tariff barrier value shows that the highest in Bulgaria.
In addition, Azizah (2015) mentioned that Indonesian crude palm oil exports to the European Union in the 2000-2011 period, had fluctuated for nearly eleven years, therefore the research tried to see what factors influenced the decline in crude palm oil export volume. The export destination countries are Germany, Italy, the Netherlands, Russia, Spain, and Ukraine with the highest number of crude palm oil exports from Indonesia. The commodity of interest in the research was crude palm oil with HS (Harmonized System) code 15111000, the research used panel data secondary data source in the form of the cross-section of six export destination countries in the European Union during the period 2000-2011 (Azizah, 2015). The results showed that the GDP and production variables had a positive and significant effect on the volume of Indonesian crude palm oil exports to the European Union while the price, exchange rate, and RED09 (Renewable Energy Directive 2009) variables did not appear to have a significant effect on the volume of Indonesian crude palm oil exports in the European Union.
The average non-tariff barriers contribute 70% of trade barriers originating from tariffs, while the contribution of non-tariff barriers to trade barriers in general is greater than tariff barriers and protection in the agricultural sector greater than the manufacturing sector. This shows that countries whose export composition depends on agricultural products tend to find greater market access problems when compared to countries that specialize in manufactured products. The study uses the calculation of Trade Restrictiveness Indices as a tool for conducting analysis (Fakhrudin, 2008).
3.2. Frequency Ratio and Coverage Ratio Analysis
The difficulty in analyzing technical regulations essentially originates from the fact that it is measured can have contrasting effects on exports and consumption, and ultimately on welfare.
From the manufacturer's point of view, the big difference between the steps falls into technical regulations types, and other more standard non-tariff measures are the existence of untranslated compliance costs directly becomes changes in production costs and final prices. From a consumer's perspective, however, a technical action is possible to increase import demand if this step is informative (Maskus et al., 2000). A similar analysis applies to non-tariff measures such as variable tax on imports, government procurement regulations or any other activity whose primary purpose is to intentionally limit imports of certain goods through the imposition of world prices according to Baldwin (1991) and Deardorff & Stern (1997).
However, Non-Tariff Measures can generate categories of economic effects that are not prima facing as trade cost effects although they translate into similar impacts on trade prices and quantities (Beghin et al., 2008). This applies to measures as technical barriers to trade and sanitary and phytosanitary measures or anything with technical regulatory content. The rationale or Political reasons or intentions for such measures maybe not necessary protection of local/domestic industries. These categories of Non-Tariff Measures have administrative objectives designed to regulate the domestic market.
The simplest aggregate indicator of Non-Tariff Measures is the frequency ratio and coverage ratio (Fugazza, 2013). The frequency ratio is a share of the total tariff lines containing one or more Non-Tariff Measures. The coverage ratio is the percentage of imports affected by one or more Non-Tariff Measures to total imports. This inventory measure allows summarizing information about Non-Tariff Measures collected at the level of disaggregation in one indicator.
The frequency ratio accounts only for the presence or absence of a Non-Tariff Measures and summarizes the percentage of products to which one or more Non-Tariff Measures is applied. A measure of the importance of Non-Tariff Measures on overall imports is given by the coverage ratio which measures the percentage of trade subject to Non-Tariff Measures for the importing country. The immediate advantage of the instrument is the relative ease that can be collected, in essence not much more difficult than compiling tariff schedules. Inventories of non-tariff measures do represent valuable information that could, if updated regularly, help track of the
evolution of the relative occurrence of various types of non-tariff measures on the flow of trade in goods, and about the evolution of events relative to tariffs.
Disdier et al. (2008) found that non-tariff measures have negative or insignificant impacts of technical barriers to trade and sanitary and phytosanitary measures on agricultural and food aggregate trade amongst the Organization for Economic Cooperation and Development (OECD) countries. However, they also find that trade from developing countries towards OECD countries does see a significant reduction because of non-tariff measures. The originality of their approach lies in the fact that they investigate the impact of non-tariff measures using different proxies for the incidence of the latter. Fontagne et al. (2005) and others further underline that the direction and the significance of trade effects of technical measures appear to differ considerably across product groups and trading partners.
Referring to Fugazza (2013), this study analyzed the change in Indonesian trade cooperation with trading partner countries (European Union, US, Japan, China, and Australia) in order to demonstrate the importance of technical measures in policy using the Frequency Ratio and Coverage Ratio. This study applied trade data for the following year: 2000, 2002, 2003, 2005, 2007, 2010, 2011, 2012, 2013, 2014 and 2015. The years selected are to explore the impact and changes in Indonesian trade cooperation. Their trade cooperation shall be discussed in the later chapter of this study.
CHAPTER 4 METHODOLOGY
This study analyzes the trade cooperation which is now followed by Indonesia with trading partner countries. Referring to Fugazza (2013), the frequency ratio is intended to calculate the presence or absence of non-tariff measures and the percentage of the frequency of one or more products applied by non-tariff measures. The coverage ratio is a percentage of the trade-in a product that is subject to non-tariff measures in the importing country and provides a measure of the importance of non-tariff measures on imports as a whole. The frequency ratio is calculated with the proportion of a 4-digit HS (Harmonize System) applied to the total number of commodities. Whereas the Coverage Ratio is a calculation that considers the import value of the commodity (UNCTAD, 2013).
Both indicators are represented as the following equations:
Where:
Fijt : Frequency ratio the exporting country i to the importing country j in year t (%) Cijt : Coverage ratio exporting country i to importing country j in year t (%)
Dkt : Dummy variable that indicates whether or not one or more Non-Tariff Measures (NTM) product k in year t
MkT : The number of products k with a total year from the amount imported VkT : The value of product k with the total year from the amount imported j : The importing country, j = 1,..., 5
i : The exporting country, i = 1,..., 5 k : Products imported, k = 1,..., 5
t : Year of enactment of NTMs, t = 2000, 2002, 2003, 2005, 2007, 2010, 2011, 2012, 2013, 2014 and 2015
T : Total years of quantities imported into the country of destination
( 1 )
( 2 )
The values of the frequency ratio and coverage ratio are in the range of 0 to 100. If the value of frequency ratio approaches to 0, it shows that a country uses less non-tariff measures.
Conversely, if the frequency ratio value approaches to 100, it shows that countries are using more non-tariff measures. It can be said if a country has a high-frequency ratio value, the country is very protective of its trade. While the coverage ratio value shows the coverage of the product affected by the policy, where if the value of the coverage ratio gets smaller.
This study aims to compared and explore the impact of trade relations between Indonesia and trading partner countries in 2000, 2002, 2003, 2005, 2007, 2010, 2011, 2012, 2013, 2014 and 2015. The year selected included total trade volume, thus resulting in the different numbers of observation data collected in each selected year. The study found that economic growth rate plays a crucial role in stimulating the trade flow, the most important findings of this study line on the results regarding the impact of trade agreements. This discussion applies the analysis of the implementation of SPS and TBT by using an inventory approach related to Table 4.1.
Table 4.1. Variable Description
No Data Source
1 Non-tariff measures (NTM) WITS (World Integrated Trade Solution), World Bank
2 Export/Import WITS (World Integrated Trade Solution) World Bank
3 SPS (sanitary and phytosanitary measures)
WITS (World Integrated Trade Solution), World Bank
4 TBT (Technical Barriers to Trade) WITS (World Integrated Trade Solution), World Bank
CHAPTER 5 RESULTS
This chapter has three parts which are data collection and processing. The first parts state the data sources and the method of data cleaning in the compilation of the data set. While the second part, present the results from using exports as the dependent variable and the independent variable consisting of sanitary and phytosanitary (SPS) frequency ratio and technical barriers to trade (TBT) frequency ratio. The third part shows the results on the effect of non-tariff policies consisting of sanitary and phytosanitary (SPS) and technical barriers to trade
(TBT) on the agricultural export of Indonesian to the trading partner. The results of each model were analyzed. Based on the results and analysis, policy recommendations will be raised for Indonesian in regards to trade cooperation with the European Union, US, Japan, China and Australia.
5.1. Data Sources and Cleaning Process
This section describes the data collection process and was divided into three parts: total trade data and the raw data list between two countries. The study used secondary data sourced from the World Integrated Trade Solution (WITS), the World Bank database and from the Ministry of Agriculture of the Republic of Indonesia to get the GDP of agricultural exports.
Total Trade Volume Data
The total trade volume is the sum of the importer's trade volume and exporter's trade volume. The database contains merchandise trade exports and imports by detailed commodity and partner countries data. Values are recorded in US dollars, along with a variety of quantity measures. The database includes information on more than 170 countries. The data are collected from the World Integrated Trade Solution (WITS) database. The data sample includes the import and export value of all trading partner countries in 2000, 2002, 2003, 2005, 2007, 2010, 2011, 2012, 2013, 2014, and 2015. Furthermore, adding up the data of export and import value of each country with each of their trading partners in each selected year were added up to become the total trade of each country with each of their trading partner in each selected year. However, sourcing from this database presented a problem, as it required that the data be selected one by one for further detailed information in order to be able to look at specific product non-tariff measures in each country. This problem was solved after all the data was collected through and merging it into the raw data list file.
5.2. Results of Frequency Ratio and Coverage Ratio
The results of these measurements are shown in Table 5.1 to Table 5.11 for different years. If the results show that a country has a high-frequency ratio value, it means that the country is very protective of its products. Meanwhile, the smaller value of the coverage ratio shows that the products affected by the policy are less.
In Table 5.1, frequency ratio for mango and mangosteen was 88.72% in Australia, indicating that Australia is very protective of the country's trade, while the coverage ratio in Australia was 35.43%, indicating the coverage of the product affected by the policy in 2020.
Table 5.1. Frequency Ratio and Coverage Ratio of NTM by Products and Export Destination Countries, 2000
Country Indicator Mangosteen and
Mango Nutmeg Rice CPO Cocoa
Australia Frequency Ratio 88.72 78.54 0.00 87.30 65.00
Coverage Ratio 35.43 38.34 0.00 4.76 12.31
China Frequency Ratio 0.00 0.00 0.00 0.00 0.00
Coverage Ratio 0.00 0.00 0.00 0.00 0.00
EU Frequency Ratio 0.00 0.00 0.00 0.00 0.00
Coverage Ratio 0.00 0.00 0.00 0.00 0.00
Japan Frequency Ratio 8.58 0.00 17.51 35.40 12.24
Coverage Ratio 0.02 0.00 0.43 0.42 0.35
US Frequency Ratio 22.60 0.00 29.47 31.62 35.57
Coverage Ratio 1.07 0.00 1.12 3.21 1.65
Source: WITS – UNCTAD Database and WTO NTM Database
In Table 5.2, frequency ratio for CPO was 37.30% in Australia, indicating the higher usage of non-tariff measures, while the coverage ratio in Australia was 0.38%, indicating the coverage of the product not affected by the policy.
Table 5.2. Frequency Ratio and Coverage Ratio of NTM by Products and Export Destination Countries, 2002
Country Indicator Mangosteen and
Mango Nutmeg Rice CPO Cocoa
Australia Frequency Ratio 8.33 23.74 0.00 37.30 19.25
Coverage Ratio 0.03 0.33 0.00 0.38 0.53
China Frequency Ratio 0.00 0.00 0.00 0.00 0.00
Coverage Ratio 0.00 0.00 0.00 0.00 0.00
EU Frequency Ratio 0.00 0.00 0.00 0.00 0.00
Coverage Ratio 0.00 0.00 0.00 0.00 0.00
Japan Frequency Ratio 0.00 0.00 0.00 0.00 0.00
Coverage Ratio 0.00 0.00 0.00 0.00 0.00
US Frequency Ratio 9.56 0.00 25.00 11.43 27.25
Coverage Ratio 0.07 0.00 0.02 0.06 0.85
Source: WITS – UNCTAD Database and WTO NTM Database
In Table 5.3, frequency ratio for crude palm oil was 14.22% in China, indicating the relative use of non-tariff measures., while the coverage ratio was 0.23%, indicating the coverage of the product not affected by the policy.
Table 5.3. Frequency Ratio and Coverage Ratio of NTM by Products and Export Destination Countries, 2003
Country Indicator Mangosteen and
Mango Nutmeg Rice CPO Cocoa
Australia Frequency Ratio 0.00 0.00 0.00 0.00 0.00
Coverage Ratio 0.00 0.00 0.00 0.00 0.00
China Frequency Ratio 0.00 0.00 0.00 14.22 0.00
Coverage Ratio 0.00 0.00 0.00 0.23 0.00
EU Frequency Ratio 0.00 0.00 0.00 0.00 0.00
Coverage Ratio 0.00 0.00 0.00 0.00 0.00
Japan Frequency Ratio 0.00 0.00 0.00 0.00 18.72
Coverage Ratio 0.00 0.00 0.00 0.00 0.55
US Frequency Ratio 0.00 0.00 0.00 10.22 0.00
Coverage Ratio 0.00 0.00 0.00 0.04 0.00
Source: WITS – UNCTAD Database and WTO NTM Database
In Table 5.4, frequency ratio for nutmeg was 41.09% in Australia, indicating a protective trading policy, while the coverage ratio in Australia was 1.78%, indicating the coverage of the product not affected by the policy.
Table 5.4. Frequency Ratio and Coverage Ratio of NTM by Products and Export Destination Countries, 2005
Country Indicator Mangosteen and
Mango Nutmeg Rice CPO Cocoa
Australia Frequency Ratio 15.34 41.09 0.00 33.00 38.87
Coverage Ratio 0.95 1.78 0.00 0.89 3.75
China Frequency Ratio 14.51 37.62 0.00 34.02 0.00
Coverage Ratio 0.87 1.34 0.00 1.23 0.00
EU Frequency Ratio 0.00 0.00 0.00 0.00 0.00
Coverage Ratio 0.00 0.00 0.00 0.00 0.00
Japan Frequency Ratio 0.00 0.00 0.00 0.00 0.00
Coverage Ratio 0.00 0.00 0.00 0.00 0.00
US Frequency Ratio 0.00 0.00 0.00 0.00 0.00
Coverage Ratio 0.00 0.00 0.00 0.00 0.00
Source: WITS – UNCTAD Database and WTO NTM Database
As shown in Table 5.5, frequency ratio for rice was 25% in the United State of America, indicating the protective policy, while the coverage ratio in Australia was 1.92%, indicating the coverage of the product not affected by the policy.
Table 5.5. Frequency Ratio and Coverage Ratio of NTM by Products and Export Destination Countries, 2007
Country Indicator Mangosteen and
Mango Nutmeg Rice CPO Cocoa
Australia Frequency Ratio 0.00 0.00 0.00 0.00 0.00
Coverage Ratio 0.00 0.00 0.00 0.00 0.00
China Frequency Ratio 0.00 0.00 0.00 0.00 0.00
Coverage Ratio 0.00 0.00 0.00 0.00 0.00
EU Frequency Ratio 0.00 0.00 0.00 0.00 0.00
Coverage Ratio 0.00 0.00 0.00 0.00 0.00
Japan Frequency Ratio 0.00 0.00 0.00 0.00 0.00
Coverage Ratio 0.00 0.00 0.00 0.00 0.00
US Frequency Ratio 5.14 0.00 25.00 28.00 21.76
Coverage Ratio 0.07 0.00 1.92 1.22 1.58
Source: WITS – UNCTAD Database and WTO NTM Database