1)Department of Forestry and Natural Resources, National Chiayi University, 300 Xuefu Rd., Chiayi 60004, Taiwan. ҴპဏτᏱීݔᄳՍดၦྜᏱقȂ60004პဏҀᏱۻၰ300ဵȄ
2)Corresponding author, e-mail:kyho@mail.ncyu.edu.tw ଊձȄ
Received August 2011, Accepted December 2011. 2011Ԓ8Уଛቸ 2011Ԓ12УႇȄ
Stand Adaptabilities in an Ecological Afforestion Study on the West Coast of Taiwan
Chun-Yao Cheng,
1)Kuen-Yih Ho
1,2)ȪSummaryȫ
The Taiwan Forestry Bureau initiated an ecological afforestation project on the west coast of Taiwan in 2004 in order to renew and improve existing windbreak forests there. To understand the influences exerted by adverse environmental stresses on the afforested costal stands, the sta- tus of stand adaptability was monitored by examining interrelationships among tree adaptability morphologies and environmental indicators. This study spanned the period from 2009 to 2011 and monitored a total of 15 plots in which stands were surveyed. To monitor growth measurements and tree morphological characteristics in the plots and collect soil and meteorological data, 17 param- eters were recorded. These data were then subjected to statistical multivariate analyses of variance.
The main factors and their factorial analysis in turn allocated the parameters into 5 categories of tree adaptation level indicators, including crown vitality, climatic influences, soil properties, tree growth, and blooming and fructification performance. These indicators were capable of explaining 80.7L of the total variability. Further application of discriminant functions to individual explana- tory indicators allowed adaptation levels of the stand trees to be ranked. Mos’s predictive grouping of stands produced a 90L fit; indicating a high degree of predictability based on these indicators.
The overall results indicated that presently the afforested stands had good adaptation levels, and 9 of them had reached a good adaptation level. Only the stands at Wutiaogang and Taixi had mod- erately poor adaptation levels. Furthermore, regression analyses of stand adaptation levels and environmental factors indicated that the precipitation amount showed a linear correlation with tree performance. Apparently, at present, forest tending practices should focus on maintaining soil moisture to enhance the adaptation level of the stands. Through quantification of this indicator and in combination with on-site observations, a basic reference for a rapid adaptability sorting evalua- tion of coastal ecological afforestation stands can be established.
Key words: evaluation monitoring, coastal windbreak forest, factor analysis.
Cheng CY, Ho KY. 2012. Stand adaptabilities in an ecological afforestion study on the west coast of Taiwan. Taiwan J For Sci 27(1):41-57.
ःفൣ֚
ѯᢋ՚ഌۭҢᄙആݔݔϸϟᎍᔗܓःف
โ߹൞
1)եۆઊ
1,2)ᄣ ्
ݔଡ଼Ս2004Ԓକܼѯᢋ՚ഌۭ௱ҢᄙആݔॏฬȂпًུ౫ԥ٪ॴݔϸȂ࣐ଇۭଜ ძᄈڐആݔݔϸϟኈȂစҦݔФᎍᔗםᄙᇅᕘძϟࡿዀӱષȂпଇڐആݔݔϸϟᎍᔗ౫ݸȄҐ
ःف֊Ս2009Վ2011Ԓଭᄈ၏ݔϸໍ።ࢦȂӔ೪ဋ15ኻୣȂစҦኻୣݔФҢߞ໕ขᇅݔФםᄙ ܓޒȂԞኻୣρІຬၦਠ๊17Ϯ໕ȂӕၦਠໍӼᡑ໕ᡑಜॏȂплԚϸϸݚІڐӱ ષϸݚȂѠܛԥϮ໕()ᘫԚ5ᆎݔФᎍᔗܓࡿዀȂєࢃᐚࠆࣁΩȃኈȃρܓ፵ȃݔФ Ңߞȃ߇๗ᄃߓ౫ȂѠ၍មᖃᡑޠ80.7LȂӕစᠧրϸݚϟڑᠧրړໍঐր၍មࡿዀϟ ᔯۢȂᡜᜍݔФᎍᔗࡿዀϟຠ๊ȂᒶᐆೄԓݳໍႲขᘫᕖூ90.0L֜Ӭ౦ȂᡘұࡿዀޠႲข౦
ାȂ๗ݏᡘұҭࠊҢᄙആݔݔϸϟᎍᔗًԂȂ9ঐኻୣϑႁᎍᔗঅпαȂ༊ݔᑫϥ෬Іѯ՚឵ܼ
Ϝ࡚ϛᎍᔗ઼๊ȇӕпݔϸϟᎍᔗܓڨژᕘძӱφޠኈՅໍଠᘫϸݚȂ๗ݏп७Ь໕֖౫ጤܓࣻ
ᜱȂᡘดҭࠊݔϸۤЬϸᆱៗձཿ๊ȂпණЁݔϸϟᎍᔗܓȄഇႇԫࡿዀޠ໕ϾȂ๗Ӭܼ౫ൠޠᢏ ขȂѠۭҢᄙആݔϟݔϸໍᎍᔗϸᠧրȂණٽץഁຠզϟՄٸᐄȄ
ᜱᗥມȈຠզᆀขȃۭ٪ॴݔϸȃӱષϸݚȄ
โ߹൞ȃեۆઊȄ2012Ȅѯᢋ՚ഌۭҢᄙആݔݔϸϟᎍᔗܓःفȄѯᢋݔཿऌᏱ27(1):41-57Ȅ
INTRODUCTION
Being an island surrounded by sea, coastal forests of Taiwan are subjected to variable marine climatic conditions. In the past, the founction of coastal stands was en- vironmental safety, hence tending, protection, and renewal practices were rarely carried out.
In addition, in the past, most coastal forests were planted with Casuarina spp. which grew rapidly and provided the capability of stabilizing wind-blown sand soon after estab- lishment. However, these trees are not prone to natural regeneration, are susceptible to infestion by insects, and have very short life spans when grown in adverse environments.
As a consequence, stands often degenerated within several a few decades. Since the 1980, research on the understory planting of various windbreak species was undertaken in order to
renew coastal forests. In Yunlin County coast- al areas of west-central Taiwan, afforestation of multiple-species mixed forests was quite successful (Gan and Chen 1987).
At present, coastal forests are narrowly distributed. It is unrealistic to expect them to provide long-term disaster-prevention func- tions, so this has become a daunting and chal- lenging task for the government. To effective- ly resist various forms of coastal erosion and tidal damage, establishing ecologically based coastal windbreak forests is an urgent issue.
In the meantime, the health of the forests has received increasing attention as well. Since 1990, the Forest Service and Environmental Protection Agency (EPA) of the US have mutually developed a monitoring program to meet the needs of enacting laws and setting
policies (USDA Forest Service 1992). The program deployed large-scale systematic sam- pling to conduct health monitoring of national forest ecosystems, and obtain information on the current status, variations, and long-term trends of forest ecosystems (Wang and Chen 2002). The Taiwan Forestry Bureau initiated an administrative program of ecological af- forestation along the west coast of Taiwan in 2004. The program aimed to renew and im- prove existing windbreak forests. Presently, these forests are gradually entering important tending periods, which reflect the need to implement various tending practices before the tree crowns of the stands close. In view of the long growth cycle of trees, particularly coastal forests which experience all kinds of adverse climatic conditions and environmen- tal stresses, it is imperative to apply tending practices in a timely manner to foster healthy stands and hasten crown closure while hoping the trees will be of good form and quality to provide enhanced protective functions.
In this study, we investigated the growth adaptability of stands in a coastal ecological afforestation program. Data on various influ- ential factors at the sites were collected, and their effects on the stands were analyzed. We hope that by surveying the status of the forest belts, proper tending measures can be estab- lished, and these should provide a method for stand health evaluation of ecologically affor- ested forests of Taiwan.
MATERIALS AND METHODS
Setups of the plots
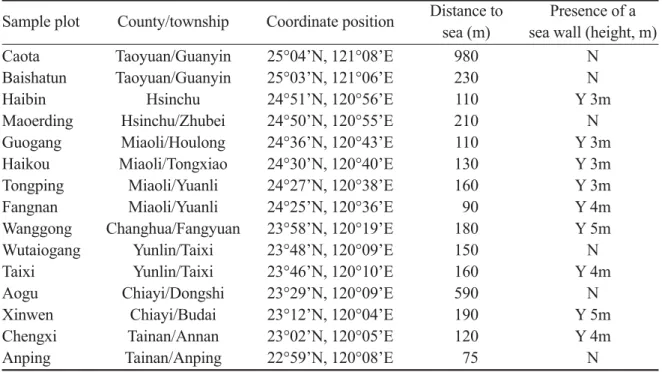
The west coastal stands of an ecological afforestation program implemented by the Taiwan Forestry Bureau in 2004 were stud- ied in 2009~2011. Permanent sample plots were selected 90~980 m from the first line of coastal windbreak forests at several locations (Caota, Baishatun, etc.) which are good rep- resentations of areal forests in general (Table 1). Each plot consisted of a tract of a stand 10
Table 1. Basic information on the permanent plots
Sample plot County/township Coordinate position Distance to Presence of a sea (m) sea wall (height, m) Caota Taoyuan/Guanyin 25°04’N, 121°08’E 980 N
Baishatun Taoyuan/Guanyin 25°03’N, 121°06’E 230 N
Haibin Hsinchu 24°51’N, 120°56’E 110 Y 3m
Maoerding Hsinchu/Zhubei 24°50’N, 120°55’E 210 N Guogang Miaoli/Houlong 24°36’N, 120°43’E 110 Y 3m Haikou Miaoli/Tongxiao 24°30’N, 120°40’E 130 Y 3m Tongping Miaoli/Yuanli 24°27’N, 120°38’E 160 Y 3m Fangnan Miaoli/Yuanli 24°25’N, 120°36’E 90 Y 4m Wanggong Changhua/Fangyuan 23°58’N, 120°19’E 180 Y 5m Wutaiogang Yunlin/Taixi 23°48’N, 120°09’E 150 N Taixi Yunlin/Taixi 23°46’N, 120°10’E 160 Y 4m Aogu Chiayi/Dongshi 23°29’N, 120°09’E 590 N Xinwen Chiayi/Budai 23°12’N, 120°04’E 190 Y 5m Chengxi Tainan/Annan 23°02’N, 120°05’E 120 Y 4m Anping Tainan/Anping 22°59’N, 120°08’E 75 N N, no; Y, yes.
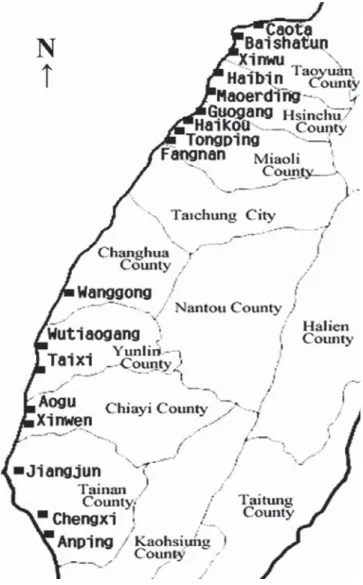
x 20 m, and 15 plots in total were established (Table 1, Fig. 1).
Growth survey
A survey of tree growth provides infor- mation on the growth vitality. The items of inventory survey included diameter at breast- height (DBH), basal diameter, tree height, and the below-crown height to the first live branch (HCB).
Soil analyses
At each plot, 4 soil sampling points were selected, and top soil (0~20 cm in depth) and
base soil (20~40 cm in depth) pedons were separately dug up. Each soil sample was thor- oughly mixed, air-dried, and sieved through a 20-mesh (0.84-mm holes) screen before analysis, in accordance with the procedures of Bouyoucos (1962). The soil salinity and pH were determined according to a grading rule of the USDA Salinity Lab (1954) using salin- ity and pH meters to measure saturated solu- tions (Table 2). In addition, the ammonium acetate method was also used (Rafahi 1982).
A Hitachi P-4010 inductively coupled plasma (ICP) atomic emission spectrometer (Tokyo, Japan) was used to measure the soluble and
Fig. 1. Locations of the permanent plots.
replacable calcium, magnesium, and sodium concentrations.
Collection of meteorological information Meteorological information was pro- vided by observation stations of the Central Weather Bureau (CWB) next to the plots.
These included the Guanyin, Hsinchu, Wanli, Lugang, Houanliao, Aogu, and Tainan Sta-
tions. Pertinent information was selected from the 2000~2011 period, including average temperature, precipitation, hours of sunshine, maximum instantaneous wind speed, etc.
Evaluation of the growth morphological characteristics of trees
The evaluation was done according to the Canadian Tree Growth Morphology method Table 2. Soil salinities and pH values
Plot Soil Depth Conductivity
Salinity level pH value Result
(cm) (mmhos/cm)
Caota 0~10 1.60ɲ0.09 Very low 6.63ɲ0.08 Neutral
10~20 1.30ɲ0.14 Very low 6.89ɲ0.19 Neutral
Baishatun 0~10 1.80ɲ0.02 Very low 7.51ɲ0.06 W. alkal.
10~20 1.90ɲ0.07 Very low 7.23ɲ0.08 Neutral
Haibin 0~10 1.40ɲ0.03 Very low 6.96ɲ0.28 Neutral
10~20 1.50ɲ0.03 Very low 7.29ɲ0.05 Neutral
Maoerding 0~10 3.20ɲ0.05 Low 7.71ɲ0.21 W. alkal.
10~20 3.60ɲ0.21 Low 7.11ɲ0.08 Neutral
Guogang 0~10 1.00ɲ0.12 Very low 8.01ɲ0.04 M. alkal.
10~20 0.15ɲ0.01 Very low 7.37ɲ0.23 W. alkal.
Fangnan 0~10 3.90ɲ0.25 Low 7.66ɲ0.13 W. alkal.
10~20 2.90ɲ0.08 Low 7.25ɲ0.02 Neutral
Haikou 0~10 1.10ɲ0.47 Very low 7.55ɲ0.15 W. alkal.
10~20 1.80ɲ0.23 Very low 7.32ɲ0.05 W. alkal.
Haikou 0~10 1.10ɲ0.04 Very low 7.33ɲ0.51 W. alkal.
10~20 1.60ɲ0.14 Very low 6.98ɲ0.04 Neutral
Wanggong 0~10 3.10ɲ0.10 Low 7.53ɲ0.07 W. alkal.
10~20 2.40ɲ0.34 Low 7.40ɲ0.06 W. alkal.
Wutaiogang 0~10 15.70ɲ0.17 High 7.65ɲ0.02 W. alkal.
10~20 19.20ɲ0.21 Very high 7.34ɲ0.21 W. alkal.
Taixi 0~10 41.00ɲ0.10 Very high 7.46ɲ0.12 W. alkal.
10~20 45.80ɲ1.27 Very high 7.02ɲ0.04 Neutral
Aogu 0~10 10.80ɲ0.36 High 7.78ɲ0.15 W. alkal.
10~20 12.20ɲ0.21 High 7.43ɲ0.02 W. alkal.
Xinwen 0~10 1.10ɲ0.15 Very high 7.43ɲ0.04 W. alkal.
10~20 1.60ɲ0.15 Very high 7.55ɲ0.16 W. alkal.
Chengxi 0~10 2.10ɲ0.25 Low 7.53ɲ0.04 W. alkal.
10~20 1.80ɲ0.45 Very low 7.20ɲ0.08 Neutral
Anping 0~10 4.00ɲ0.37 Medium 7.36ɲ0.15 W. alkal.
10~20 5.80ɲ0.18 Medium 7.31ɲ0.32 W. alkal.
W. alakl., weakly alkaline; M. alkal., moderately alkaline.
(USDA Forest Service 2002).
The crown diameter was measured, and the average width of the tree crown was de- fined by the lateral branch extensions in vari- ous directions.
The crown ratio is the ratio of the live crown to the living tree height, in other words, crown ratio = (tree height – height of the first live branch)/tree height.
The crown density is the areal ratio in percentage of the crown that is impenetrable to sunlight to the entire crown area.
The see-through degree of the crown is the areal ratio of the tree crown that allows light penetration, in percentage.
The crown branch tip dieback consists of horizontal branches of the tree crown that show persistent dieback toward the stem, or dieback from the tree top downward. It is often present in the upper portion of a tree crown and the outer portion of the middle- upper crown.
Statistical analyses
The variables monitored were analyzed using a statistical software package of SPSS 12 (Liu 2005, Shen 2007).
Main factor analysis
A correlation matrix of individual vari- ables was calculated to estimate their com- monality. The common factors with eigen- values of > 1, those with eigenvalues of < 0, and the extracted factors which could explain 75L of the variation were retained to deter- mine the number of factors, X’ = ( X1, X2,…, Xk).
Factor analysis
A factorial analysis examines a number of significant variables, in order to find common factors affecting the original dataset among a group of interrrelated information (Shen
2007). The functions are shown as follows:
X’ = (X1, X2,…, Xk), where X’ is the set of common factors for significant variables (X1, X2,…Xk);
Y’ = (Y1, Y2,…, Yk), where Y’ is the set of common factors for significant variables (Y1, Y2,… Yk);
σ’ = (σ1, σ2,…, σk), where σ’ is the set of in- terrelated information (σ1, σ2,… σk) common factors; and
A =
[
σσσ1121k1σσσ1222k2...σ...σ...σ1k2kkk .]
Upon axis rotation of the determinant factors of the stand adaptation level, the ex- planatory quantity of the eigenvalues were weighted, and weighted factor (x) scores were calculated. Normalization of these gave x’
values. Summing x’ values of the sample trees in each plot and dividing by the number of sample trees produced the average adaptation level indicator (y). Multiplying y by √n gave Z0 values; which when √n was subtracted be- came Z1 values; subtracting √n from Z1 gave Z2 which equaled Z0 - 2√n. Finally, a single- tail stand health determination was carried out in which a Z0 value of < 1.645 indicated a healthy stand; Z0 of > 1.645 denoted a slightly unhealthy stand; Z1 of > 1.645 indicated a moderately unhealthy stand; and when Z2 >
1.645, the stand was very unhealthy.
Discriminant analysis
The independent variables were screened step by step by re-evaluating the explana- tory capacity of each independent variable with regard to its discrimaint function so as to derive the significance of each variable. A forward stepwise discriminate analysis was carried out, and a set of optimal classification numerical variables was selected.
Regression analysis of environmental factors and adaptability
Climatic and soil data of the plots were normalized, then a regression was run with the stand adaptation levels of the plots. Corre- lations among environmental factors and tree adaptability of the plots were analyzed. The significance of the factor analysis and envi- ronmental factors was analyzed.
RESULTS
Growth analysis of trees
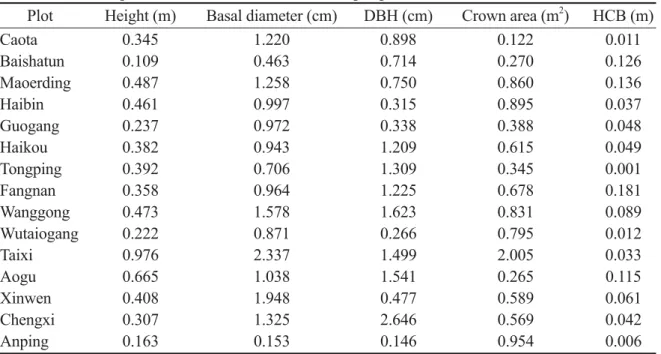
Results of the net tree growth survey are shown in Table 3. The Taixi plot showed the greatest net tree height growth of 0.98 m. The plot also showed the greatest basal diameter growth of 2.34 cm. The Chengxi plot, on the other hand, exhibited the greatest DBH growth of 2.65 cm. The greatest net area of crown growth was also observed at the Taixi plot, reaching 2.01 m2. Furthermore, the Fangnan plot had the greatest height to the first live branch of 1.81 m.
Analysis of soil factors
Salinity
Table 2 shows soil salinity determina- tions of the plots. The soil salinity of most plots was low. At Wutiaogang, Yunlin County, the base soil had the highest salinity, while Guogang, Miaoli County, had the lowest sa- linity. The topsoil at Wutiaogang was also ex- tremely saline. In contrast, the Guogang plot had the lowest topsoil salinity of 1.00ɲ0.12 mmhos cm-1.
Soil pH
Soil pH values of the test plots are also shown in Table 2. In general, soils of the plots were neutral to moderately alkaline, indicat- ing that soils of the coastal belt contained water-soluble salt ions. Among the plots, the Guogang topsoil had a moderately alkaline pH which was the highest among all plots.
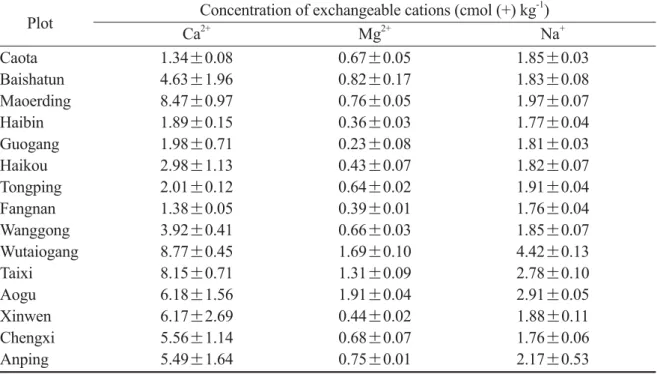
Exchangeable cations
The survey found that soil concentrations
Table 3. Growth performances of trees in the sample plots
Plot Height (m) Basal diameter (cm) DBH (cm) Crown area (m2) HCB (m)
Caota 0.345 1.220 0.898 0.122 0.011
Baishatun 0.109 0.463 0.714 0.270 0.126
Maoerding 0.487 1.258 0.750 0.860 0.136
Haibin 0.461 0.997 0.315 0.895 0.037
Guogang 0.237 0.972 0.338 0.388 0.048
Haikou 0.382 0.943 1.209 0.615 0.049
Tongping 0.392 0.706 1.309 0.345 0.001
Fangnan 0.358 0.964 1.225 0.678 0.181
Wanggong 0.473 1.578 1.623 0.831 0.089
Wutaiogang 0.222 0.871 0.266 0.795 0.012
Taixi 0.976 2.337 1.499 2.005 0.033
Aogu 0.665 1.038 1.541 0.265 0.115
Xinwen 0.408 1.948 0.477 0.589 0.061
Chengxi 0.307 1.325 2.646 0.569 0.042
Anping 0.163 0.153 0.146 0.954 0.006
DBH, diameter at breast-height; HCB, below-crown height to the first live branch.
of Ca2+ of the plots were between 1.38ɲ0.05 and 8.77ɲ0.45 cmol (+) kg-1 as shown in Table 4. Its concentrations in the sample plots were notably higher than those of other cat- ions. Concentrations at Taixi, Maoerding, and Wutiaogang were the highest. Soil concentra- tions of Mg2+ were between 0.23ɲ0.08 and 1.91ɲ0.04 cmol (+) kg-1. Aogu and Guogang had the highest and lowest Mg2+ concentra- tions, respectively. The highest salinity of 45.80ɲ1.27 mmhos cm-1 observed at Tasi belonged to the extremely high salinity class, while the 1.00ɲ0.12 mmhos cm-1 salinity of Guogang was the lowest.
Compilation of weather data
Weather data were collected from weath- er stations nearby the research sites. Among the items, those deemed to affect tree growth such as temperature, precipitation, maximum instantaneous wind speed, and hours of sun- shine were analyzed according to the latitudi- nal distribution of the plot sites. The weather information is presented in Table 5.
Evaluation of stand adaptability
By measuring tree growth and morpho- logical characteristics, and collecting soil and weather data, 17 parameters for the test plots were established. These were subjected to a main factor analysis, and factors were extract- ed through a factorial analysis. Accordingly, factors having a commonalty of < 0.01 (cor- relation coefficient < 1L) were rejected from further analysis (Table 6).
By turning the matrix axis, the main factor with higher weighting values were grouped together, and 5 indicators with sig- nificant effects on tree adaptability were ob- tained as shown in Table 7. Combining these indicators could explain 80.74L of the total variations, indicating they had good explana- tory capacity, and could render the adaptabil- ity factor of a majority of trees in the stands.
Thus, they were good forecasters of stand adaptation levels. When named according to their factor structural matrix, these indicators included crown vitality, climatic influences, soil properties, tree growth, and blossoming
Table 4. Cation concentrations in the soil
Concentration of exchangeable cations (cmol (+) kg-1)
Plot Ca2+ Mg2+ Na+
Caota 1.34ɲ0.08 0.67ɲ0.05 1.85ɲ0.03 Baishatun 4.63ɲ1.96 0.82ɲ0.17 1.83ɲ0.08 Maoerding 8.47ɲ0.97 0.76ɲ0.05 1.97ɲ0.07 Haibin 1.89ɲ0.15 0.36ɲ0.03 1.77ɲ0.04 Guogang 1.98ɲ0.71 0.23ɲ0.08 1.81ɲ0.03 Haikou 2.98ɲ1.13 0.43ɲ0.07 1.82ɲ0.07 Tongping 2.01ɲ0.12 0.64ɲ0.02 1.91ɲ0.04 Fangnan 1.38ɲ0.05 0.39ɲ0.01 1.76ɲ0.04 Wanggong 3.92ɲ0.41 0.66ɲ0.03 1.85ɲ0.07 Wutaiogang 8.77ɲ0.45 1.69ɲ0.10 4.42ɲ0.13 Taixi 8.15ɲ0.71 1.31ɲ0.09 2.78ɲ0.10 Aogu 6.18ɲ1.56 1.91ɲ0.04 2.91ɲ0.05 Xinwen 6.17ɲ2.69 0.44ɲ0.02 1.88ɲ0.11 Chengxi 5.56ɲ1.14 0.68ɲ0.07 1.76ɲ0.06 Anping 5.49ɲ1.64 0.75ɲ0.01 2.17ɲ0.53
and fructification performances.
Adaptation levels of the stands
Evaluation of adaptation levels of the stands was based on a synthetic indicator of
tree external morphological characteristics.
Thus, explanatory capacities of the eigenval- ues obtained upon axis rotation of the adapt- ability indicator causal factors matrix were weighted for the evaluation, and then the
Table 5. Weather data of the sample plots
Average Precipitation
Hours of sunshine Maximun instantaneous temperature (ʨ) (mm mo-1) wind speed (m s-1) Caota 16.4 72.1 73.1 12.1
Baishatun 16.3 71.0 83.3 12.4
Maoerding 16.5 58.1 76.5 17.5
Haibin 16.5 56.4 95.1 17.9
Guogang 16.6 46.4 162.0 14.9
Haikou 16.7 40.2 163.3 15.2
Tongping 16.6 37.3 164.0 15.5
Fangnan 16.8 36.2 165.5 15.8
Wanggong 17.2 17.9 166.9 16.1
Wutaiogang 17.8 16.6 162.5 18.3
Taixi 17.9 18.0 162.8 17.6
Aogu 17.5 29.8 159.1 14.2
Xinwen 17.2 24.6 160.8 12.3
Chengxi 18.6 21.5 165.2 18.1
Anping 18.7 20.7 165.6 18.7
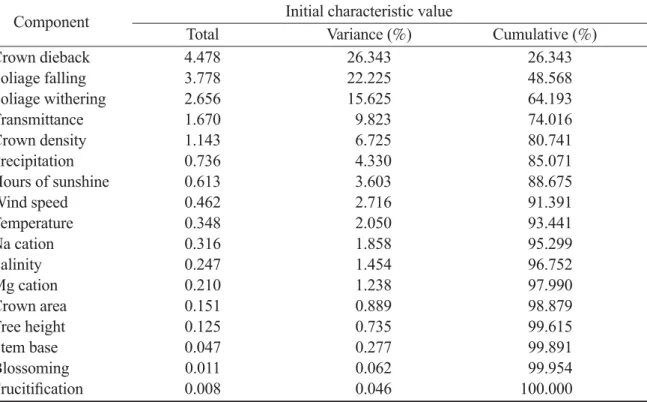
Table 6. Total variance explained
Component Initial characteristic value
Total Variance (L) Cumulative (L)
Crown dieback 4.478 26.343 26.343
Foliage falling 3.778 22.225 48.568
Foliage withering 2.656 15.625 64.193
Transmittance 1.670 9.823 74.016
Crown density 1.143 6.725 80.741
Precipitation 0.736 4.330 85.071
Hours of sunshine 0.613 3.603 88.675
Wind speed 0.462 2.716 91.391
Temperature 0.348 2.050 93.441
Na cation 0.316 1.858 95.299
Salinity 0.247 1.454 96.752
Mg cation 0.210 1.238 97.990
Crown area 0.151 0.889 98.879
Tree height 0.125 0.735 99.615
Stem base 0.047 0.277 99.891
Blossoming 0.011 0.062 99.954
Frucitification 0.008 0.046 100.000
health status of individual stands was evalu- ated accordingly. Four grades were obtained, with grade I denoting good adaptability (good); grade II, slightly maladapted (fair);
grade III, moderately maladapted (poor); and grade IV, heavily maladapted (very poor).
Grades of the test plots along the coast are shown in Table 8. From our observations of the health status of the west coast windbreak forests, stand adaptation levels varied from good to moderately poor (Table 8).
Most test plots showed good adapta- tion; whereas stands at Wanggong, Aogu, Chengxi, and Anping were graded as slightly maladapted. Wutiaogang and Taixi in Yulin County were moderately maladapted. Dur- ing our survey at the Taixi plot, we noted that the wind exerted tremendous influences. The dilapidated wind fence there had resulted in the demise of many trees. In addition, the 2 sites have extremely high-salinity soils which further hindered tree growth. The afforesta-
tion plot of Aogu is right next to the coast, and summertime inundations are frequent which also lead to high soil salinities and retarded tree growth. The slight maladapta- tion at Wanggong, Changhua County, was deemed to be due to strong monsoon winds in wintertime, coupled with the fact that the plot was next to a river without on embankment.
Whenever there are torrential rains, inunda- tions take place. Tree mortality at Baisatun, Taoyuan County was the lowest among all plots. There are intact wind fences which are supplemented by timely weeding practices.
The 6 species planted there all showed very good growth.
Discriminant analysis
When the stepwise regression discrimi- nating method was applied to the influential variables and stand adaptation levels, typical discriminant functions were derived. F-tests of the typical discrimiant functions all pro- Table 7. Matrix structure of axis factors
Composition
Factor 1 Factor 2 Factor 3 Factor 4 Factor 5 Crown dieback 0.912 -0.006 -0.025 0.001 -0.029 Foliage falling 0.875 0.029 0.052 0.039 -0.011 Foliage withering 0.870 0.035 -0.035 -0.017 -0.043 Transmittance 0.799 0.073 0.084 -0.318 -0.097 Crown density -0.783 -0.082 -0.045 0.361 0.105 Precipitation -0.103 -0.965 -0.131 -0.139 -0.021 Hours of sunshine 0.110 0.897 0.080 0.058 -0.010
Wind speed 0.090 0.795 -0.360 0.034 0.082
Temperature -0.145 0.727 0.259 0.287 0.007
Na cation 0.042 0.107 0.972 0.104 -0.017
Salinity 0.099 0.091 0.943 0.077 -0.040
Mg cation -0.034 -0.053 0.887 0.103 0.105
Crown area -0.088 0.098 0.066 0.910 0.026
Tree height -0.088 0.128 0.080 0.893 0.154
Stem base -0.212 0.227 0.186 0.803 0.142
Blossoming -0.118 -0.021 0.085 0.013 0.840
Fructification -0.041 0.083 -0.051 0.239 0.751
duced F-values of < 0.05, indicating a signifi- cant level for the influential variables. Thus, all influential variables have an explanatory capacity. Subsequently, the typical discrimi- nant functions derived from the 17 variables were tested for their Wilks’ lambda values, all of which had p values of < 0.05, indicat- ing that all the coefficient of the discriminant functions had significant explanatory power.
Subsequently, a Fisher linear discriminant function was applied to observe the discrimi- nating capacity of individual variables of the stand health status. Coefficients of the func- tions are shown in Table 9.
In this study, Mos’s method of predict- ing classification was applied and compared to the original classification as shown in Table 10. In the original grading probabilities, the average fit was 90.0L; upon the cross- validation in which each observed value was classified according to a function of all other
observed values, a 88.8L correct ratio was obtained.
Regression analysis of environmental factors and stand adaptability
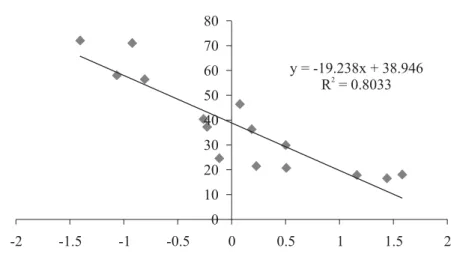
In our investigation of stand tree adapt- ability, in addition to the conditions of tree crown growth and stress damage, influential factors of the ecological environment should also be included. Thus, regressions between environmental factors (climatic and soil) and stand adaptation levels were run, and their coefficients of determination (R2) are shown in Table 11. Among the factors, precipitation showed the highest linear correlation with the normalized adaptation scores, while Ca cation and wind speed showed the lowest (Fig. 2).
DISCUSSION
Evaluation of stand tree adaptability is an abstract concept; as a consequence, its Table 8. Adaptation levels of the plots
Plot No. of
Mortality x’ Y √n Z0 Z1 Z2 Grade
trees (n)
Caota 39 0.33 -54.7 -1.40 6.24 -8.76 -15.01 -21.25 I Baishatun 130 0.03 -119.5 -0.91 11.40 -10.48 -21.89 -33.29 I Maoerding 45 0.08 -47.7 -1.06 6.71 -7.12 -13.83 -20.53 I Haibin 57 0.21 -45.8 -0.80 7.54 -6.06 -13.61 -21.16 I Guogang 88 0.27 6.8 0.07 9.38 0.73 -8.64 -18.02 I Haikou 84 0.20 -21.6 -0.25 9.16 -2.35 -11.52 -20.68 I Tongping 97 0.34 -21.9 -0.22 9.84 -2.22 -12.07 -21.92 I Fangnan 45 0.31 8.5 0.18 6.71 1.26 -5.43 -12.14 I Wanggong 71 0.11 82.3 1.15 8.42 9.76 1.34 -7.08 II Wutaiogang 53 0.22 76.3 1.44 7.28 10.48 3.21 -4.07 III Taixi 34 0.26 53.7 1.58 5.83 9.21 3.38 -2.44 III Aogu 45 0.06 22.5 0.50 6.71 3.35 -3.35 -10.05 II Xinwen 93 0.22 -10.3 -0.11 9.64 -1.07 -10.71 -20.36 I Chengxi 72 0.31 16.5 0.23 8.48 1.95 -6.53 -15.01 II Anping 59 0.10 29.9 0.51 7.68 3.89 -3.78 -11.46 II Y, average of indicator; n, number of sample trees; Z0 < 1.645 denotes “good” adaptability (grade I);
Z0 > 1.645 denotes “fair” adapatability (grade II); Z1 > 1.645 denotes “poor” adaptability (grade III) and Z2 > 1.645 denotes “very poor” adaptability (grade IV).
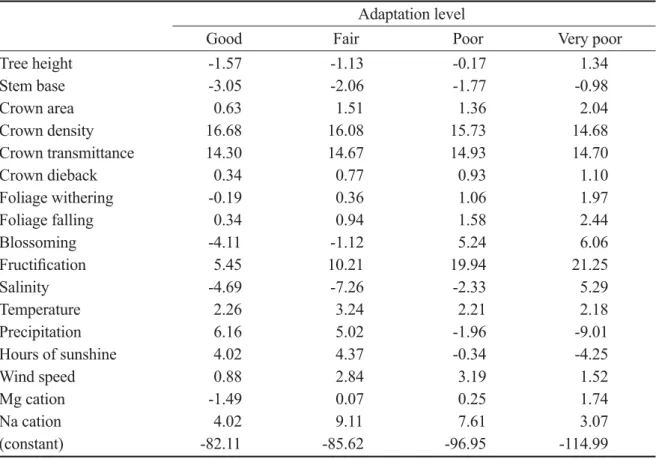
embodiment must adopt visual observa- tions of various morphological features and minimize the influence of subjective factors (Ho and Tsai 2011). Therefore, in this study, a main factor analysis was conducted with regards to morphological characteristics of stand trees. Then through a factor analysis, Table 9. Coefficients of the Fisher linear discriminant function
Adaptation level
Good Fair Poor Very poor
Tree height -1.57 -1.13 -0.17 1.34
Stem base -3.05 -2.06 -1.77 -0.98
Crown area 0.63 1.51 1.36 2.04
Crown density 16.68 16.08 15.73 14.68
Crown transmittance 14.30 14.67 14.93 14.70
Crown dieback 0.34 0.77 0.93 1.10
Foliage withering -0.19 0.36 1.06 1.97
Foliage falling 0.34 0.94 1.58 2.44
Blossoming -4.11 -1.12 5.24 6.06
Fructification 5.45 10.21 19.94 21.25
Salinity -4.69 -7.26 -2.33 5.29
Temperature 2.26 3.24 2.21 2.18
Precipitation 6.16 5.02 -1.96 -9.01
Hours of sunshine 4.02 4.37 -0.34 -4.25
Wind speed 0.88 2.84 3.19 1.52
Mg cation -1.49 0.07 0.25 1.74
Na cation 4.02 9.11 7.61 3.07
(constant) -82.11 -85.62 -96.95 -114.99
Table 10. Results of adaptation levels of the cross-validated classification
Adaptation level Prediction
Total
Good Fair Poor Very poor
Original probability Good 94.5 5.5 0.0 0.0 100.0
Fair 0.4 88.6 11.0 0.0 100.0
Poor 0.0 16.8 77.9 5.3 100.0
Very poor 0.0 0.0 21.8 78.2 100.0
Cross-validation probability Good 93.7 6.3 0.0 0.0 100.0
Fair 0.9 88.2 11.0 0.0 100.0
Poor 0.0 18.9 73.7 7.4 100.0
Very poor 0.0 0.0 23.6 76.4 100.0
Table 11. R2 values of environmental factors
Climatic factors R2 Soil factors R2 Temperature 0.455 Salinity 0.390 Precipitation 0.803 pH value 0.220 Hours of sunshine 0.667 Ca cations 0.206 Wind speed 0.223 Mg cations 0.251
Fig. 2. Dspersal diagram of precipitation and adaptation factor scores.
factors reflecting the status of stand tree adaptability were extracted. Through axis turning of the factor matrix, factors with high- er weighting scores were grouped together to derive 5 indicators of stand tree adaptation levels. These indicators were capable of ex- plaining 80.74L of the total variation; sug- gesting that they were fairly self-explanatory and were representative factors of stand tree adaptation levels. They were also deemed capable of forecasting growth adaptation of trees. Based on the factor structural matrix, these indicators were named accordingly and included crown vitality, climatic influences, soil properties, tree growth, and blossoming and fructification performance.
The aforementioned adaptability indica- tors for ecological afforestation of Taiwan’s west coast, of which crown density, transmit- tance, crown dieback, foliage falling, and foliage wither belonged to the crown vitality indicator, reflected the growth vigor and vari- ation of tree crowns. Soil inundation and sa- linity directly or indirectly affect tree crowns and growth of foliage. Liu (2005) used a tree crown coverage factor as an important indica- tor of plantation tree growth conditions. Thus, damage due to environmental stresses is re- flected by the degree of vitality which a tree crown exhibits, and the status of tree growth
is directly or indirectly reflected by the growth of crowns; particularly the condition of branch tip dieback. This often appeared on the upper portion of a crown or the ends of lateral branches. Withering of foliage and early falling of foliage also portend decreases in crown growth vigor which also leads to de- creased crown area percentages.
Factors represented in the climatic influ- ences indicator included 4 items of average precipitation, average hours of sunshine, maximum instantaneous wind speed, and av- erage temperature. Influenced by different en- vironmental climatic conditions, tree growth tends to differ. Lee et al. (1993) mentioned the climatic conditions of their experimental site, in which except for June, transpiration rates were greater than precipitation. The condition was particularly serious during the northeasterly monsoon season. Wind speeds were higher during the period from October to March which also adversely affects tree growth conditions. In view of these situations, the indicator was named climatic influences.
The soil property indicator was based on soil salinity possibly affecting the soil status and the dynamics of soil nutrient variations.
Exchangable cations in the soil, which are also effective nutrients usable to plants, and a lack of some ions often lead to dysfunction
in nutrient uptake. Chen et al. (1996, 1998) pointed out that old-growth sandy coastal for- ests often gradually become enriched along with tree growth. An increase in tree age is accompanied by accumulation of litter on the ground, and mineralization of the forest bed organic matter often produces humic acid upon its decomposition, causing pH values of the top layer of soil to decrease (Horng and Cheng 1993, 1996). Hence, this indicator was named soil properties. Our survey also indicated that pH values of the plots were be- tween 6.63ɲ0.08 and 8.01ɲ0.04 and there was no distinctive difference between the top and bottom soils. We surmised that this was because the soils were supporting newly planted trees with scanty sapling cover, and there were still large amounts of accumulated litter on the ground. The low humus content of the surface soil caused there to be only minor differences between the soil layers (Table 2). Thus, the soils were lacking humic substances, and tree growth might have been adversely affected at this stage. In addition, soil conditions were not conducive to retain- ing water and nutrients. Upong further tree growth, however, the soil environment should gradually improve.
The tree growth indicator included 3 factors of crown area, tree height, and basal diameter. Basic tree growth status informa- tion is directly reflected by height growth, di- ameter growth, and crown area. Lin and Tang (1999) in their investigation noted that due to impacts of the northeasterly monsoon, the windward basal diameters and tree heights of plantation species were inferior to those of leeward ones. Accumulation of litter was also less on the windward side than on the leeward side. Thus, the status of tree growth is also an important indicator. In addition, the blossom- ing and fructification performance indicator which encompassed the appearance of flowers
and fruits was mainly influenced by the innate flowering and fruiting seasons. However, in littoral regions, where trees are subjected to immense environmental stresses, and when faced with decline or demise, trees often un- dergo large-scale flowering and fruiting as a mechanism to produce progeny. In addition, Lin et al. (2009) also noted that these planta- tions have flowering or fruiting phenomena, indicating that these endemic species-based plantations have a self-regeneration capabil- ity. In choosing afforestation species, such species should be prioritized.
Summation of the weighted factor scores from the factor analysis gives an indicator of individual stand adaptability. And the dis- criminant analysis provides grading of their status differentiation. When factors were extracted with a commonality of > 0.01 in the factor analysis (i.e., with a maximum cor- relation coefficient of > 1L), then using the varimax function of the discriminant analysis obtained by turning the matrix axis, the inter- factor explanatory power was increased, and the turned factor matrix has each indicator pegged to one or a few factors. The complex- ity among the indicators was simplified, and the quantities of explanation were simplified as well. The correlations between factors and hidden factors became more prominent in the meantime. In addition, the relative importance of the monitored items was directly reflected in the coefficients of the discriminant func- tions.
In using a typical discriminant method to conduct statistical models and test explana- tory variable hypotheses, the discriminating power of individual explanatory variables are weighted, and ones with the grestest explana- tory power are chosen. These are used to establish a predictive probability function and are subjected to a cross-validation process to assess their accuracy. Usually the degree of
fit is evaluated. The higher the degree of fit, the greater is the predictive capacity. In this study, Mos’s method was employed to gener- ate predictive grading and original grading. In the original grading, the average degree of fit was 90.0L; while for cross-validation, each observation was graded according to a func- tion of all other observations; and an 88.8L cross-validation degree of fit was obtained.
Hence, Chiou (2003) also concluded that the adaptability of stand trees should belong to a graded reaction variable, using a discrimi- nant analysis to examine influential factors and find related variables. In evaluating tree vitality differentiation of a coastal protective forest, in addition to monitoring all risk fac- tors of the existing stand, its potential adapta- tion performance should also be predicted.
Furthermore, through the use of Fisher’s method to grade the observation data, or to predict to which grade the observations be- long, the observation data are pegged to the grading function of the adaptation grades and compared to the function values. The greater the function value is, the better is the observations’ adaptation. The equation can provide a rapid grading of stand conditions during coastal forest surveys. When used in conjunction with stand adaptation level grades established earlier, a stepwise regres- sion procedure can be used to obtain typical discriminant functions. Chiou (2003) was the first researcher to apply typical discriminant functions and found good predictive capabil- ity for west-coast forests of Taiwan. Chiou (2003) studied stand tree adaptability grading based on original observational variables, and obtained a good fit between the predictive grading and actual grading. Hence, discrimi- nant functions have good predictive capabil- ity to effectively differentiate health grades of afforested saplings in the west littoral regions of Taiwan. Through establishing discriminant
functions, valuable evaluation information on coastal forest stand health can be constructed.
These will be helpful in the future to provide a basis for tree growth adaptability evalua- tions by overseeing organizations. In view of the limitations of fieldwork capability and funding, we can gradually apply the concept of discriminant analysis to select indicators with good differentiating ability and reduce the number of survey items in fieldwork so as to increase efficiency of manpower while still attaining accurate predictions.
Stand adaptability evaluation adopts a synthetic indicator based on the external mor- phological features of trees. Therefore when the causal factor matrix was turned along its axis, the resulting eigenvalues served as a weighting of the explanatory power. These in turn were used to deduce the adaptability of the stand in each plot and its adaptation level.
The interrelationship among environmental factors and stand adaptability indicated that precipitation exerted a linear effect with R2
= 0.803. Because of the extended range of coastal forests and the predominant sandy soils of the plots, drainage is rapid, and water retention is problematic. Figure 2 shows that the amount of precipitation was linearly corre- lated to the y-axis (adaptation levels); in other words, the heavier the rainfall, the healthier the stand became. The rainfall amount thus has a certain importance to a newly planted forest. On the west coast of Taiwan, northern parts have more precipitation. The plant com- munities are consistently battered by mon- soons, high temperature in summertime, and salty fogs. The health of stands suffers severe challenges there.
In our observation of the health status of west-coast windbreak forests, the stand adap- tation levels were from good to moderately poor (Table 8). Most test plots showed good adaptation; whereas stands at Wanggong,
Aogu, Chengxi, and Anping were graded as slightly maladapted. Wutiaogang and Taixi in Yunlin County were moderately maladapted.
During our survey at the Taixi plot, we noted that wind exerts tremendous influences. The dilapidated wind fence there had caused the demise of many trees. In addition, the 2 sites have extremely high-salinity soils which fur- ther hindered tree growth. The afforestated plot at Aogu is right next to the coast, and summertime inundations are frequent which also lead to high soil salinities and retarded tree growth. The slight maladaptation at Wanggong, Changhua County, was deemed due to strong monsoon winds in wintertime coupled with the fact that the plot was next to a river without an embankment. Whenever there are torrential rains, inundations take place. Tree mortality at Baishatun, Taoyaun County was the lowest among all plots. There are intact wind fences which are supplement- ed by timely weeding practices. The 6 species planted there all showed very good growth.
CONCLUSIONS
Since 2004, the Taiwan Forestry Bureau has implemented an ecological afforestation program on the west coast of Taiwan. By surveying tree growth and morphological fea- tures, collecting soil and weather information in the test plots, we carried out a main factor analysis of a multivariate analysis of variance and factor analysis to group all parameters into 5 stand tree adaptability indicators, in- cluding crown vitality, climatic influences, soil properties, tree growth, and blossoming and fructification performance. The results in- dicated that at present, most of the ecological afforestation tracts have adapted well, with 9 plots showing scores above an adequate ad- aptation level; only the Wutiaogang and Taixi plots were moderately maladapted. A further
discriminant analysis generated typical dis- criminant functions to test individual explana- tory indicators, and ascertained the adaptation level grading. Then Mos’s method was select- ed and indicated that the predictive grading had a 90.0L fit, suggesting that the indicators had high predictive accuracies. Regression analyses among stand tree adaptation levels and environmental factors indicated a linear correlation between precipitation and adapta- tion levels. Thus, at present, water retention practices for stands are critical for enhancing stand adaptability. In addition, quantifica- tion of the 5 indicators combined with field observations should enable proper grading of coastal afforestation sites and provide a basis for the rapid evaluation of a stand’s status.
LITERATURE CITED
Bouyoucos, GJ. 1962. Hydrometer method improved for making particle size analysis of soils. Agron J. 54:464-465.
Chen TH, Sheu BH, Chang CT. 1996. Nu- trient contents and inputs of precipitation, stemflow and throughfall in Shihu coastal Casuarinas stands, central Taiwan. Taiwan J For Sci 14(4):419-35. [in Chinese with English summary].
Chen TH, Sheu BH, Chang CT. 1998. Inves- tigation on the nutrition amount for Casuarina forest at the coast of Sihhu. Taiwan J For Sci 13(3):225-35. [in Chinese with English sum- mary].
Chiou PY. 2003. The four county’s Casuarina forest health monitoring in the south of Tai- wan. [master thesis]. National Pingtung Univ.
of Science and Technology. 76 p.
Gan WH, Chen TF. 1987. The management of windbreak forest in Taiwan. Modern Silvi- cult 3(1):3-25.
Ho K, Tsai WJ. 2011. Adaptations of Casu- arina windbreak stands to land subsidence on
the southwestern coast of Taiwan. Taiwan J For Sci 26(1):71-86.
Horng FW, Cheng WE. 1993. Environmental survey for silviculture in Peng Huɯsoil sur- vey. Q Res Rep 8(2):109-27.
Horng FW, Chang WE. 1996. Soil nutrient pool and available nutrient dynamics in the Fushan mixed hardwood forest ecosystem. Tai- wan J For Sci 11(4):465-73. [in Chinese with English summary].
Lee HD, Chiou WL, Wang SH. 1993. The studies of eological reforestation in Peng Huɯ the adaptation of 25 Heng Chen indigenous tree species in Sa Kang, Peng Hu. Q Res Rep 8(3):209-18.
Lin KC, Tang SL. 1999. Early growth of Pit- tosporum pentandrum, Ficus microcarpa and Nerium indicum in a western coastal area of Taiwan. Taiwan J For Sci 14(3):247-54.
Liu LH. 2005. The assessment methods of health indicators for coastal protection for- estɯa study in northern and central Taiwan.
National Pingtung University of Science and Technology. 68 p. [in Chinese with English summary].
Lin MY, Ou SW, Lee TM, Hsu LT. 2009.
Study of afforestation tree species in Penghu archipelago. Hwa Kang J Agric 23:9-20.
Rafahi H. 1982. Soil chemical characteristics and proton buffer systems. In: Bowen GD and Nambiar EKS, editors. Nutrition of plantation forests. London: Academic Press. 104 p.
Shen ML. 2007. Applied multivariate analysis.
Taipei City, Taiwan: Jeou Chou Book Co. 608 p.
USDA Forest Severice. 1992. National forest health monitoring assessing the condition of our forest resources. United States Department of Agriculture (USDA) Forest Service. Wash- ington, DC: United States Environmental Pro- tection Agency National Association of State Foresters. 160 p.
USDA Forest Severice. 2002. Forest inven- tory and analysis national core field guide.
Washington, DC: United States Department of Agriculture (USDA)1: Phase 3 field guide- crowns: measurements and sampling. 21 p.
USDA Salinity Laboratory. 1954. Diagnosis and improvenment of saline and alkali soils.
Washington, DC: United States Department of Agriculture (USDA) Handbook. 160 p.
Wang ZH, Chen ZY. 2002. Creation for as- sessment method of forest health indices - examples from the old mature trees in Chilan.
No. 91-6 Study series. Taipei, Taiwan: Forestry Bureau, Council of Agriculture, Executive Yuan. 47 p.