國立交通大學
機械工程學系
博士論文
質子交換膜燃料電池中陰極層汽液界面位置對
性能之影響
Effects of the Gas-Liquid Interface Location in the Cathode
Layer on the Performance of a PEM Fuel Cell
研 究 生 : 李純怡
指導教授 : 陳俊勳 教授
曲新生 教授
質子交換膜燃料電池中陰極層汽液界面位置對
性能之影響
Effects of the Gas-Liquid Interface Location in the Cathode
Layer on the Performance of a PEM Fuel Cell
研 究 生 : 李純怡 Student : Chun-I Lee
指導教授 : 陳俊勳、曲新生 Advisor: Chiun-Hsun Chen
Hsin-Sen Chu
國 立 交 通 大 學
機 械 工 程 學 系
博 士 論 文
A Thesis
Submitted to Department of Mechanical Engineering National Chiao Tung University
in partial Fulfillment of the Requirements for the Degree of
Doctor of Philosophy in
Mechanical Engineering
June 2007
Hsinchu, Taiwan, Republic of China
質子交換膜燃料電池中陰極層汽液界面位置對性能之影響
研究生 : 李純怡 指導教授 : 陳俊勳、曲新生
摘 要
本論文主要是探討三維、多物種、二相混合模式下之質子交換膜燃料電池 中,其陰極增濕、陰極氣體擴散層的孔隙度、電池溫度以及增濕溫度的變化對燃 料電池的傳輸現象及電池性能之影響。本研究中主要是利用沿著流道方向之汽液 界面的位置來說明在這些操作條件下,液態水出現的位置對電池性能的影響。在 研究過程中,首先先建立描述質子交換膜燃料電池內部各種傳輸及電化學現象之 數學模式,其中以質量、動量、物種、能量及電流守恆方程式做為模式的主要方 程式。在電化學反應中,主要的驅動力是利用活化過電位來作為陰極觸媒層中電 子相電位與質子相電位的聯繫。而且當電池發生電化學反應時會產生熱能,其熱 能的來源包括因電化學反應所造成之不可逆的熱及熵、因質子和電子傳輸所造成 的焦耳熱以及因水的蒸發及凝結所產生的潛熱。因為本論文中有考慮二相流動的 傳輸,因此在此部分是利用M2模式來說明其各物種之間的相互關係。 本研究探討的議題分為二個部份:第一部份是以等溫系統為主,即是不考慮 能量方程式。主要是探討在陰極的流道及擴散層中,陰極的增濕情況以及陰極氣 體擴散層的孔隙度改變時對汽液界面位置的影響。數值模擬的結果顯示當陰極的 增濕程度逐漸增加以及電池的操作電壓逐漸降低時,汽液界面的位置會逐漸往流道的入口方向移動。這是因為當陰極增濕度增加時,會有較多的液態水產生,而 液態水會造成多孔隙材質中的孔穴被液態水佔據,造成燃料氣體傳輸的阻礙,因 此電池性能降低。相同的,當電池電壓降低時,即是電流密度較大時,電化學反 應較為快速,因此汽液界面的位置也會逐漸往流道的入口方向移動因而造成相同 的情況。再者,當陰極的氣體擴散層孔隙度逐漸增加時,無論是水或是燃料氣體, 皆較容易通過多孔隙材質,因此,當陰極氣體擴散層的孔隙度增加時,電池性能 較佳。另外,沿著流道方向之氧氣分率、水分率以及液態水在陰極流道及擴散層 中的分佈及變化也一併提出及探討。 第二部份主要是以非等溫系統為主,因為液態水的蒸發與凝結皆與操作溫度 有著密切的關係,因此本部分考慮在不同的操作溫度時其對汽液界面位置的影 響。操作溫度主要是分成電池溫度以及增濕溫度來探討。數值模擬的結果顯示當 增濕溫度等於或大於電池溫度時,其汽液界面的位置會隨著電池溫度的降低而逐 漸往流道的入口處移動,進而造成電池性能的降低。另外也分別探討在薄膜內的 溫度分佈、在流道入口處陰極氣體擴散層內溫度以及液態水的分佈。並且清楚的 指出燃料氣體在氣體擴散層中是利用擴散方式由流道往勒條的方向移動,反之, 液態水在氣體擴散層中則是利用毛細作用力由肋條往流道出口處移動。
Effects of the Gas-Liquid Interface Location in the Cathode Layer on
the Performance of a PEM Fuel Cell
Student: Chun-I Lee Advisor: Chiun-Hsun Chen
Hsin-Sen Chu
ABSTRACT
This dissertation presents a three-dimensional, multi-component, two-phase
model to investigate the transport phenomena and performance of proton exchange
membrane fuel cell as the liquid water forms under various cathode humidification
conditions, gas diffusion layer porosities, cell temperatures, and humidification
temperatures. In this study, the location of the gas-liquid interface along the channel
direction is extracted to explain the effects of liquid water appearance that cause the
cell performance change. A mathematical model, coupled with the electrochemical
process, two-phase flows, species transfer, and heat transfer is developed at first. In
the electrochemical reaction of the cathode catalyst layer, the solid phase potential and
the electrolyte phase potential is connected by the activation overpotential.
Furthermore, thermal energy release and transport is accompanied with the
electrochemical reaction and is considered in modeling. The sources of thermal
energy accounts for irreversible heat and entropic heat generated due to
latent heat of water condensation and/or evaporation. The multiphase mixture
formulation (M2 model) is adopted as it is particularly suitable for two-phase flow
modeling in PEM fuel cells.
Our quest to the effects of the liquid-water interface location involves the
following two parts in the dissertation. First, we considered the isothermal system in
the PEM fuel cell, namely the energy conservation equation is not included in it. The
objective of this part is to investigate the effects of the location of the gas-liquid
interface along the channel direction under various cathode humidification conditions
and gas diffusion layer porosities in the conventional flow field. Numerical simulation
results indicate that the gas-liquid interface location approaches to the gas flow
channel inlet region and cell performance declines gradually as the relative humidity
of the cathode is increased. This is because of liquid water may occupy the pores in
the porous media, reducing the amount of fuel gas that can reach the cathode catalyst
layer to cause the cell performance diminished. Meanwhile, when the cell operating
voltage decreases and the current density gets larger, the electrochemical reaction
becomes more quickly. Hence, the gas-liquid interface location also moves to the
channel inlet region to cause the same consequence. Furthermore, as the gas diffusion
layer porosity is increased, the transport of liquid water and fuel gas becomes easier
fraction, the water fraction and the liquid water saturation field along the flow channel
direction in the flow channel and the gas diffusion layer are presented.
The investigation of the location of the gas-liquid interface along the channel
direction at various operating temperatures is conducted in the second part of the
dissertation, owing to the consideration that the condensation and/or evaporation of
the water is related with operating temperature. The effects of two model parameters,
namely cell temperature (Tcell) and humidification temperature (Th), on the
gas-liquid interface location and cell performance are presented. Simulation results
indicate that when the anode and cathode humidification temperatures are equal to or
higher than the cell temperature, the gas-liquid interface location moves toward the
flow channel inlet region and the cell performance decreases as the temperature is
decreased. Additionally, the membrane temperature distribution and the distributions
of the liquid water and temperature in the cross-section of the cathode gas diffusion
layer in the inlet region are presented. Simulation results indicate that gas-phase fluid
diffuses from the channel to the land and that the capillary-driven liquid water is
誌 謝
在交大的求學過程中,首先先感謝恩師 曲新生及陳俊勳博士,
恩師除了在學術上悉心的指導我之外,在待人處世方面更是值得我學
習的榜樣。其次,感謝顏維謀、陳發林、宋齊有及鄭金祥博士在台大
讀書會時給予我莫大的幫助,使我的博士論文能進行的更加順利。也
很感謝口試委員陳朝光、洪哲文、楊文美及顏維謀諸位教授對於論文
的建議及指導,使得本論文更加的嚴謹及完整。
此外,特別感謝木勝、輝忠及弘祥學長不厭其煩的幫助我修正論
文及解決疑惑。也感謝研究室的學長及學弟們為我的生活帶來了許多
歡樂的回憶。
最後,感謝我的家人-老爸、老媽、大哥、大嫂、二哥以及我的
丈夫 Francis,在我求學的過程中,陪伴我經歷了許多挫折及挑戰,
也給予我許多的幫助及鼓勵,使我能更堅定要完成學業的決心,僅以
此論文獻給所有關心、愛護及幫助我的人,非常非常的感謝!
TABLE OF CONTENTS
ABSTRACT (in Chinese) ………... i
ABSTRACT (in English)……… iii
LIST OF TABLES……….. ix
LIST OF FIGURES……… x
NOMENCLATURE……… xiv
CHAPTER 1 INTRODUCTION………... 1
1.1 Background……….. 1
1.1.1 Transport Phenomena in a PEMFCs……….. 2
1.2 Literature Survey………. 4
1.3 Objectives………... 14
1.4 Outlines………. 15
CHAPTER 2 MATHEMATICAL MODELING……….. 20
2.1 Model Description……… 21 2.2 Basic Assumptions……… 22 2.3 Governing Equations……… 23 2.4 Boundary Conditions………..…. 30 2.5 Numerical Procedures………..… 32 2.5.1 Numerical Method….………... 32 2.5.2 Calculation Procedure………. 33 2.5.3 Model Validation………... 33
CHAPTER 3 EFFECTS OF CATHODE HUMIDIFICATION AND POROSITY OF THE GDL ON THE GAS–LIQUID INTERFACE LOCATION IN A PEM FUEL CELL…….… 40
3.1 Introduction………..…… 40
3.2 Effects of cathode humidification scheme ……….. 41
3.3 Effects of cell operating voltage………..……. 43
3.4 Three-dimensional species field……….….. 44
3.5 Two-phase mixture velocity field………..….….. 47
3.6 Effects of the cathode gas diffusion layer porosity………..… 47
3.7 Summary………... 51
CHAPTER 4 EFFECTS OF TEMPERATURE ON THE LOCATION OF THE GAS–LIQUID INTERFACE IN A PEM FUEL CELL………... 67
4.1 Introduction……….. 67
4.2 Effects of temperatures scheme………..………. 68
4.3 Effects of cell temperatures scheme………..……….. 69
4.4 Three-dimensional species field………..………… 71
4.5 Temperature field in the membrane………... 73
4.6 Summary……….. 74
CHAPTER 5 CONCLUSIONS AND FUTURE PERSPECTIVES ... 84
5.1 Concluding Remarks………... 84
5.2 Future Perspectives..……… 87
LIST OF TABLES
LIST OF FIGURES
Fig. 1.1. Basic components of a single PEMFC……….. 17 Fig. 1.2. Operating principle of a single PEMFC……… 18 Fig. 1.3. The dominant mechanisms of cell performance……… 19 Fig. 2.1. Physical and computational domains considered in this study……. 36 Fig. 2.2. Numerical flow diagram of the solution procedure.………….…… 37 Fig. 2.3. Comparison of predictions on the three different grid systems..…... 38 Fig. 2.4. Comparison of the predicted I–V curve and the experimental data
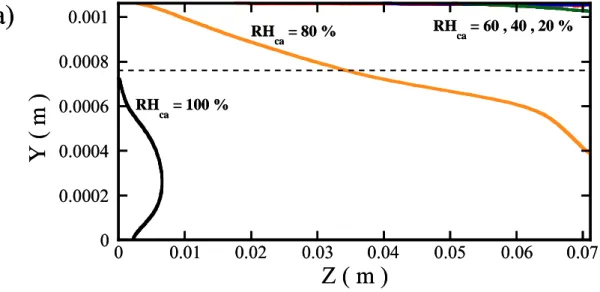
of Squadrito et al. [44]………... 39 Fig. 3.1. Effects of relative humidity of cathode on the location of the
interface where liquid water begins to condense along the conventional flow channel at a cell operating voltage of 0.7 V. (a) RHca = 20~100 % and (b) RHca = 20~60 %... 53
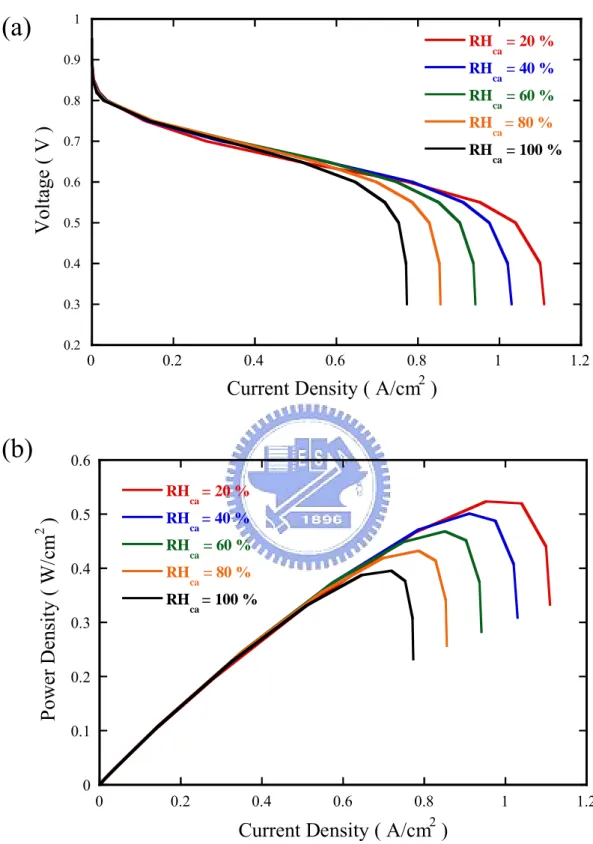
Fig. 3.2. Effect of relative humidity of the cathode on cell performance with conventional flow fields. (a)I-V curves and (b) I-P curves... 54 Fig. 3.3. Effect of cell operating voltage on the location of the interface
where liquid water begins to condense along the conventional flow channel at a relative humidity of the cathode of 80 %. (a) V= 0.5~0.9 (b) V= 0.8~0.9……….………. 55 Fig. 3.4. Oxygen fraction in the cathode gas channel and gas diffusion layer
along the conventional flow channel at a cell voltage of 0.7 V and cathode relative humidity of 80%.………..…... 56 Fig. 3.5. Water fraction in the cathode gas channel and the gas diffusion
and cathode relative humidity of 80%... 57 Fig. 3.6. Liquid water saturation field in the cathode gas channel and gas
diffusion layer along the conventional flow channel at a cell voltage of 0.7 V and cathode relative humidity of 80 %... 58 Fig. 3.7. Oxygen mass fraction contours at the gas diffusion layer at the
cathode humidification of (a) 20% (b) 60% (c) 100% for cell voltage of 0.4 V... 59 Fig. 3.8. Water mass fraction contours at the gas diffusion layer at the
cathode humidification of (a) 20% (b) 60% (c) 100% for cell voltage of 0.4 V... 60 Fig. 3.9. Liquid saturation contours at the gas diffusion layer at the cathode
humidification of (a) 20% (b) 60% (c) 100% for cell voltage of 0.4 V... 61 Fig. 3.10. Two-phase mixture velocity field in the gas diffusion layer and
flow channel of the cathode at the cell voltage of 0.7 V and cathode relative humidity of 80%... 62 Fig. 3.11. Effect of porosity of the gas diffusion layer on the location of the
interface where liquid water begins to condense along the conventional flow channel at a cell voltage of 0.7 V and cathode relative humidity of 80%... 63 Fig. 3.12. Effect of porosity of the gas diffusion layer on cell performance
with conventional flow fields at cathode relative humidity of 80%. (a) I-V curves and (b) I-P curves... 64 Fig. 3.13. Oxygen fraction at various porosities of the gas diffusion layer at
%... 65 Fig. 3.14. Water fraction at various porosities of the gas diffusion layer at an
operating voltage of 0.7 V and cathode relative humidity of 80 %... 66 Fig. 4.1. Polarization curves at various cell temperatures with equal
humidification temperature……… 76 Fig. 4.2. Effect of cell temperature on the location of the interface where
liquid water begins to condense along the flow channel at a cell operating voltage of 0.7 V……….……..…….. 77 Fig. 4.3. Polarization curves for various cell temperatures at (a) Th = 323 K
(b) Th = 343 K.……….…… 78 Fig. 4.4. Effects of cell temperature on the location of the interface where
liquid water begins to condense along the flow channel at a cell operating voltage of 0.7 V and a humidification temperature of 343 K. (a) Z = 0 to 7.112 cm, (b) Z = 0 to 0.08 cm…………...…… 79 Fig. 4.5. Liquid water saturation field in the cathode gas channel and
diffusion layer along the flow channel at a cell voltage of 0.7 V and a humidification temperature of 343 K. (a) Tcell = 323 K, (b) Tcell = 333 K, (c) Tcell = 343 K………..…. 80 Fig. 4.6. Liquid water saturation distributions in a cross-section of the
cathode gas diffusion layer in the inlet region at a cell voltage of 0.7 V and a humidification temperature of 343 K. (a) Tcell = 323 K, (b) Tcell = 333 K, (c) Tcell = 343 K.……….… 81 Fig. 4.7. Temperature distributions in a cross-section of the cathode gas
humidification temperature of 343 K. (a) Tcell = 323 K, (b) Tcell = 333 K, (c) Tcell = 343 K.……….…………. 82 Fig. 4.8. Temperature contours in the membrane at a cell voltage of 0.7 V
and a humidification temperature of 343 K. (a) Tcell = 323 K, (b) Tcell = 333 K, (c) Tcell = 343 K.……….…….. 83
NOMENCLATURE
A specific electrochemically active area
a water activity
C molar concentration (mol m−3)
CF quadratic drag factor
CP constant-pressure heat capacity (J kg−1 K−1)
Dc capillary diffusion coefficient
Dij binary diffusion coefficient (m2 s−1)
F Faraday constant (C mol−1)
g gravitational acceleration (m s−2)
h enthalpy (J kg−1)
i current density (A m−2)
j transfer current density (A m−3)
K permeability (m2)
k thermal conductivity (W m−1 K−1)
M molecular weight (Kg mol−1)
Pc capillary pressure
R universal gas constant (J mol−1 K−1)
r rate constant
S source term
s liquid water saturation
T temperature (K)
Tcell cell temperature (K)
Th humidification temperature (K) uK fluid velocity (m s−1) w mass fraction x molar fraction Greek α transfer coefficient ε porosity φ phase potential (V) η overpotential (V) κ proton conductivity (S m−1) λk mobility of phase k μ dynamic viscosity (N s m−2)
ν kinematic viscosity (m2 s−1)
θc contact angle
ρ density (kg cm−3)
ρκ kinetic density (kg m−3)
σ electrical conductivity (S m−1)
τ tortuosity of the porous medium
ξ stoichiometric flow ratio
ψ membrane water content
ζ surface tension (N m−1) Subscripts a anode c cathode con condensation e electron eva evaporation
eff effective value
g gas phase
p proton
sat saturation value
w water
Superscripts
CHAPTER 1
INTRODUCTION
1.1 Background
The depletion of fossil fuels and the degradation of the environment are key
issues in modern society. There is an urgent need to substitute fossil fuels by
renewable fuels and at the same time find new energy conversion methods that
preserve the environment. Because of these problems, much effort has been devoted
in recent years to the development of different types of fuel cells [1]. Among them,
the polymer electrolyte membrane fuel cells (PEMFCs) have attracted much attention.
Proton exchange membrane fuel cell is a type of lower-temperature fuel cells
and has been regarded as promising candidate of future power sources for both
stationary and automotive applications. Especially for automotive applications, it is
one of the most probable types of fuel cells which are able to replace conventional
power conversion devices such as internal combustion engines because of its many
distinctive features such as high energy efficiency, low noise, low emission, and
especially low operating temperature (i.e., quick startup under environmental
this system becomes commercially available.
1.1.1 Transport Phenomena in a PEMFC
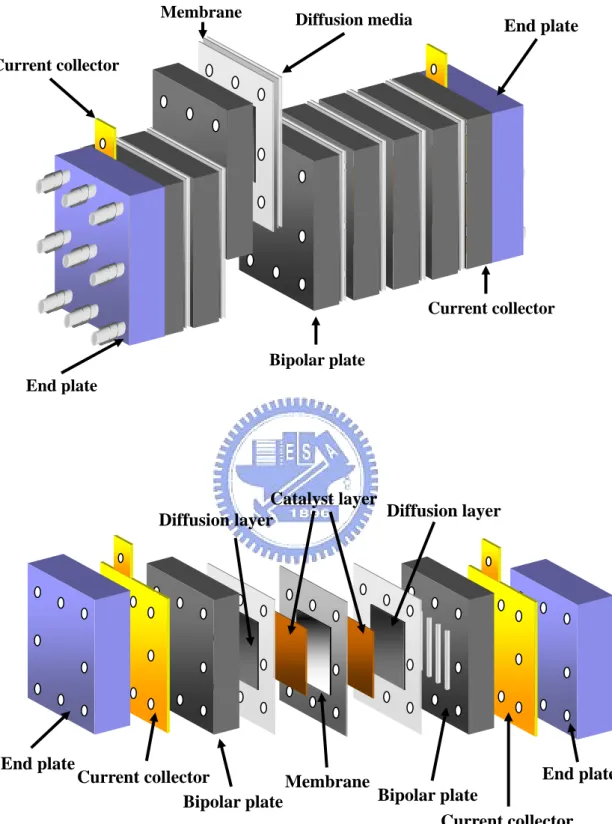
Figure 1.1 shows the geometry of a single fuel cell, which consists of a
membrane, two catalyst layers, two gas diffusion layers, two gas channels, and two
collector plates. The major functions and characteristics of these components are:
collector plates with flow channels are used for reactants and products transport,
electron conduction and heat removal; gas diffusion layers are for reactant
distributions, electron conduction, and liquid water removal; catalyst layers are used
to promote electrochemical reactions where reactants are consumed, and products and
heat are generated; and the membrane is used to conduct protons from the anode
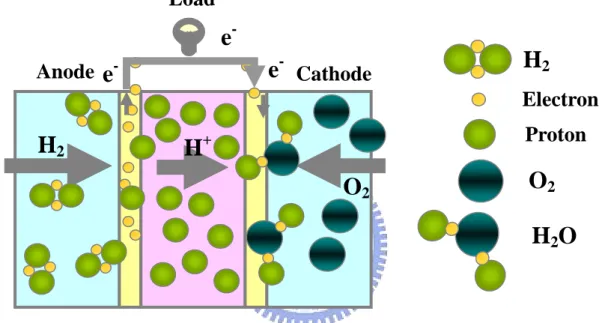
catalysts layer to the cathode catalyst layer. The electrochemical reaction occurring in
the PEMFC is illustrated in Fig. 1.2. At the anode catalyst layer, hydrogen is
consumed to produce protons and electrons, i.e.,
2H2 → 4H+ + 4e− (1.1)
Electrons pass through an external circuit to the cathode thus providing electrical
power, while the protons transport through the membrane to the cathode. At the
cathode catalyst layer, oxygen combines with the protons and electrons to produce
water, i.e.,
Although chemical reaction principles are rather simple, the transport processes inside
a fuel cell are quite complex. First, the reactant species must be able to effectively
transfer to different parts of the catalyst layers. Second, the electrical resistance to
both protons and electrons must be low. And third, the product water and heat must be
removed out of the fuel cell from the catalyst layers through the gas diffusion layers
and other cell components. Further complications come from the duel effects of
temperature and water.
A PEM fuel cell simultaneously involves electrochemical reactions, current
distribution, hydrodynamics, multi-component transport, and heat transfer. Hence, a
comprehensive mathematical model is needed to gain a fundamental understanding of
the interacting electrochemical and transport phenomena. Nevertheless, polarization
occurs during operation of PEM fuel cells and this influences dramatically both the
performance and the commercialization of the technology. Accordingly, the
development of a theoretical model of the PEM fuel cell, as well as corresponding
analyses, are crucial to gain a good understanding of the effect of the operating
conditions on the cell potential so that the polarization level can be well controlled.
Performance of a fuel cell is determined by several factors, including the
geometry and morphology of transport components, and the operating conditions such
by its current-voltage relation (i.e., the polarization curve), as shown in Fig. 1.3. At a
particular current, the voltage drop is mainly caused by (i) overpotentials of
electrochemical reactions (mainly on the cathode), (ii) the ohmic drop across the
ionomeric membrane, and (iii) the mass transport limitations of reactants and products.
At high current densities of special interest to vehicular applications, excessive water
is produced within the cathode in the form of liquid, thus leading to a gas-liquid
two-phase flow in the porous electrode. The ensuing two-phase transport of gaseous
reactants to the reaction surface becomes a limiting mechanism for cell performance,
particularly at high current densities.
1.2 Literature Survey
Water and thermal management is essential for proper operation of PEM fuel
cells. The polymer membrane in the PEM fuel cell must be in a highly hydrated state
to facilitate proton transport. If there is not enough water, the membrane becomes
dehydrated and its resistance to proton conduction increases sharply. On the other
hand, if too much water is present, flooding may occur resulting in the pores of the
gas diffuser filled by liquid water, which will block the transport of reactants to the
reaction sites. In practice, humidification of anode fuels and/or cathode oxidants is
cathode catalyst layer and water also tends to migrate from the anode side to the
cathode side under the electro-osmotic drag, it becomes a key issue to avoid flooding
in the cathode in the design and operation of PEM fuel cells.
The influence of temperature on fuel cell operation has two important
consequences. On one hand, higher temperature is favorable for electrochemical
reactions. On the other hand, higher temperature also leads to a reduction in reactant
partial pressure, cell open circuit voltage, and water activity, which results in an
increase of membrane ionic resistance. In addition, non-uniform temperature
distributions cause transient effects and create hot spots that may lead to cell failures.
If the temperature or temperature gradient is too high, the fragile membrane could be
damaged.
Modeling and computer simulation of PEM fuel cell began with the pioneering
work of Bernardi and Verbrugge [2, 3] and Springer et al. [4, 5], whose models are
essentially one-dimensional that provided good preliminary foundations for PEM fuel
cell modeling. Bernardi and Verbrugge [2, 3] presented a one-dimensional model that
included water transport. However, their model did not account for surface tension
forces on the transport of the liquid phase. Also, the model was isothermal, and did
not take into account energy interactions due to phase change. Springer et al. [4, 5]
flux ratio across the membrane in PEM fuel cells. However, the one-dimensional
model cannot simulate the decrease of reactants and the accumulation of products in
the flow direction. In the pseudo two-dimensional model proposed by Fuller and
Newman [6] and Nguyen and White [7], the effects of reactant consumption along the
flow channels were considered. Nguyen and White [7] developed a two-dimensional
PEM fuel cell model with one-dimensional heat transport in the flow direction. The
model considered phase change of water in the flow channel as the only heat source.
Both of these models assumed a well-mixed concentration in the flow channel,
diffusion was the only mechanism for oxygen transport, the interaction of the flow
with the species field in the channel and gas diffusion layer was not included.
Subsequently, Yi and Nguyen [8] modified the previous models to include both the
liquid and gas phase along the flow channel of both anode and cathode sides of PEM
fuel cell. The results indicated that anode humidification improved the conductivity of
the membrane, and that the cell performance is enhanced by the injection of liquid
water and the increase in humidification temperature. Gurau and Liu [9] presented a
two-dimensional model by coupling the flow and transport governing equations in the
flow channel and the gas diffusion layer, but the density change due to species
consumption appeared to be neglected. Yi and Nguyen [10] developed a
cathode. However, this model is valid only in the absence of liquid water, and it does
not account for water condensation and evaporation phase change within porous
electrodes.
Several models have been developed to demonstrate the influence of liquid
water on water management. Wang et al. [11] first studied two-phase flow and liquid
water transport on the cathode side of a PEM fuel cell based on the multiphase
mixture model (M2 model) originally developed by Wang and Cheng [12].The model
encompassed both single- and two-phase regimes corresponding to low and high
current densities and was capable of predicting the transition between the two regimes.
The half cell domain including the gas channel, gas diffusion, and catalyst layer on
the cathode side of a PEM fuel cell was considered in the article. Later, this model
was further developed to include a complete cell by You and Liu [13]. They presented
a two-dimensional two-phase mixture model to analyze flow and transport in the
cathode of the PEM fuel cell, and to predict phase change and water/oxygen
distribution in both the flow channels and the porous diffusion layer. Also, such a
two-phase model provides actual characteristics of the flow and the transport of
reaction gas for thermal/water management design in the future. In Refs. [14, 15],
Mazumder and cole developed a three-dimensional model to predict the effect of the
polarization behavior was overestimated, based on the assumption that no liquid water
was formed. In contrast, when liquid water was present, the condensation and/or
evaporation of water via equilibrium phase transformation proceeded as described in
Ref. [15]. They presented a numerical study, also based on the M2 model of Wang and
Cheng. Since water condensation can obstruct pores and reduce cell performance, the
polarization behaviors of PEM fuel cell must be accurately predicted to investigate
such a situation. Pasaogullari and Wang [16] developed a model to explore the
two-phase flow physics in the cathode gas diffusion layer. The simulations revealed
that flooding of the porous cathode reduced the rate of oxygen transport to the cathode
catalyst layer. Furthermore, they indicated that the humidification level and the flow
rate of reactant streams are key parameters controlling PEM fuel cell performance and
two-phase flow and transport characteristics. He et al. [17] proposed a
two-dimensional, two-phase, multi-component transport model for PEM fuel cell with
interdigitated flow field, in which they included capillary transport of liquid water in a
completely wetted gas diffusion layer. They studied the effects of various electrode
and flow field design parameters on the performance of the cathode of a PEM fuel cell.
Natarajan and Nguyen [18] published a two-dimensional model that considered the
dimension normal to the reactive surface and the electrode width. In this work, gas
while Darcy’s law was adapted to model liquid water transport in unsaturated porous
gas diffusion layers. Here the effect of liquid water accumulation in the diffusion
layer was accounted for in terms of gas transport restrictions and reactive surface
coverage. Meng and Wang [19] improved their three-dimensional computational fluid
dynamics model based on recent visualization experiments, more accurately
investigated the two-phase behavior under different gas utilizations. Their model was
applied to successfully predict liquid water flooding dynamics although the energy
transport was ignored. Zhang et al. [20] experimentally and theoretically studied the
liquid water transport and removal from the gas diffusion layer and gas channel of the
PEM fuel cells. In situ observations of the distribution of liquid water on the gas
diffusion layer surface and inside the gas channel were made. They characterized the
formation and emergence of liquid water from the gas diffusion layer surface and
identified two modes of liquid water removal from the gas diffusion layer surface.
Thermal management in a PEM fuel cell is inherently coupled with water
management, and the two factors combine to ensure high performance and durability
of a PEM fuel cell. It is thus of paramount importance to understand the thermal
behavior under various design and operating conditions and furthermore develop a
capability to accurately predict the temperature distribution in PEM fuel cells. Rowe
Including entropic, irreversible, and phase change heats, they further took account of
Joule heating in the membrane and anode/cathode catalyst layers. This work predicted
the temperature variation in the through-membrane direction under the various current
densities and electrode thermal conductivities. A major drawback of this model is the
fact that the cathode catalyst layer is assumed to be fully hydrated and the membrane
water content is linearly interpolated, indicating inapplicability of the model in low
humidity operation. Baschuk and Li [22] developed a mathematical model with
variable degrees of water flooding in the PEMFC. Physical and electrochemical
processes occurring in the membrane electrolyte, the cathode catalyst layer, the
electrode backing layer and the flow channel were considered. Compared with
experimental results, they found that when air was used as the cathode fuel, the
flooding phenomena are similar at different operating conditions of the pressures and
temperatures. When cell pressure is increased significantly, the water flooding in the
electrode becomes serious and leads to a noticeable reduction in the power output. To
examine the effects of temperature and gas pressure gradients on fuel cell
performance and water management, a one-dimensional, non-isothermal model was
proposed by Djilali and Lu [23]. It was found that the temperature distribution in the
PEM fuel cell is affected by the water phase change in the electrode. Simpalee and
temperature distribution inside a straight channel PEMFC and to study the effect of
heat produced by the electrochemical reactions on fuel cell performance. Source terms
for transport equations, heat generation, and a phase change model were presented to
facilitate their modeling work. They treat the liquid water as a component of the gas
mixture, transported by convection by gas pressure and density gradients. The results
showed that the temperature profiles depend on heat generation produced by
electrochemical reactions and phase change of water inside the fuel cell. Further, the
cell performance does not merely influenced by the inlet humidity condition, cell
voltage, and membrane thickness but also by the temperature rise inside fuel cells.
Natarajan and Nguyen [25] developed a pseudo three-dimensional model by
extending a two-dimensional isothermal model for conventional flow fields. Their
results indicated that water removal by evaporation increases with higher temperature
and higher stoichiometric flow rates, which results in better cell performance.
However, if the water produced by the electrochemical reaction could not effectively
removed from the cathode side, then flooding of the electrode will occur, reducing
access of the reactants to the catalyst layer. Yang et al. [26] reported the mechanics of
the liquid water transport, starting from emergence on the gas diffusion layer surface,
droplets grow and move toward the main stream flow in gas channels. Furthermore,
channel walls and the subsequent channel clogging affects cell performance.Liu et al.
[27] experimentally studied the two-phase flow of reactants and products as well as
water flooding situation in the gas flow channel of a cathode in a PEM fuel cell with
three flow fields. Their study addressed the effects of flow field, cell temperature,
cathode gas flow rate, operation time on water build-up, and cell performance. The
results indicated that liquid water forms in columns that accumulate in the cathode
flow channels and clogs the porous media, liming mass transfer, resulting in degraded
cell performance. Further, the amount of water in flow channels at high temperature is
much less than that at low temperature. Ju et al. [28] presented the first work that
systematically derived mathematical model of the energy equation from
thermodynamics. The thermal model is further coupled with the electrochemical and
mass transport to deal with the heat and water management in PEM fuel cell. Later,
Wang and Wang [29] expanded the M2 model to investigate the interaction between
the two-phase flow and thermal transport by non-isothermal effect. The results reveal
that the vapor-phase diffusion enhances water removal and provides a new
mechanism for heat removal through a phase change process. This new heat removal
mechanism is similar to the heat pipe effect.
Much effort has been expended in recent years upon development of
complexities. Current development in PEM fuel cell modeling is in the direction of
applying computational fluid dynamics (CFD) to solve the complete set of transport
equations governing mass, momentum, species, energy, and charge conservation.
Dutta et al. [30, 31] developed a complete three-dimensional simulation of PEM fuel
cell using Fluent, a commercial CFD package. Their modeled domain covered the
entire fuel cell sandwich employing conventional gas distributors on both the anode
and the cathode sides. This model treats the MEA as an interface without thickness
and ignores the membrane water storage capability; thus this model cannot be used to
simulate transient phenomena. However, they fail to account for liquid water in the
gas diffusion layers. Yan et al. [32] conducted a numerical study of the effects of fuel
channel width and GDL porosity on the cross-cell transport of reactant gas and the
performance of a PEM fuel cell. They [33, 34] subsequently presented a
two-dimensional numerical model to carry out the reactant gas transport phenomena
and cell performance with baffle effects in the flow channel of bipolar plate. Effects of
the baffle width are explored. Additionally, the effects of liquid water formation on
the reactant gas transport are taken into account in the modeling and examined in the
analysis. A comprehensive non-isothermal, three-dimensional computational model of
a PEM fuel cell has been developed by Berning et al. [35, 36]. The model
channels. With the exception of phase change, the model accounts for all major
transport phenomena. The model is implemented in a CFD code, and simulations are
presented with an emphasis on the physical insight and fundamental understanding
afforded by the detailed three-dimensional distributions of reactant concentrations,
current densities, temperatures and water fluxes. Um and Wang [37] presented a
computational fuel cell dynamics model to elucidate three-dimensional interactions
between mass transport and electrochemical kinetics in polymer electrolyte fuel cells
with straight and interdigitated flow fields, respectively. The model results indicate
that forced convection induced by the interdigitated flow field substantially improves
mass transport of oxygen to, and water removal from, the catalyst layer, thus leading
to a higher mass-transport-limiting current density as compared to that of the straight
flow field. Chiang and Chu [38, 39] presented a three-dimensional, multi-species and
two-phase model by CFD code to investigate the effects of temperatures,
humidification levels, channel aspect ratio and gas diffusion layer thickness on the
cell performance.
1.3 Objectives
The above literature review clearly indicates that water and thermal
formation of liquid water depends on the saturation vapor pressure, which is a strong
function of temperature. Therefore, the temperature factor is inevitable in water
management investigation because the phase change of water such as condensation
and/or evaporation closely relates to the corresponding saturation pressure. However,
the discussions of the effect of gas-liquid interface location on the cell performance
and transport process are rarely seemed. Therefore, this study investigates the
formation and influence of the gas-liquid interface location along the flow channel
direction at various operation conditions with a three-dimensional, multi-component,
and two-phase model of a PEM fuel cell.
1.4 Outlines
The scope of this dissertation is mainly focused on four parts. Chapter 2
introduces the homogeneous model of the multiphase mixture formulation (M2 model)
development as it is particularly suitable for two-phase flow modeling and applying
computational fluid dynamics (CFD) to solve the complete set of transport equations
governing mass, momentum, species, energy, and charge conservation in a PEM fuel
cell. Furthermore, the proposed model incorporates the basic assumptions is also
presented. Chapter 3 investigates the effects of cathode humidification and gas
condense along the flow channel of a PEM fuel cell; its contribution to the cell
performance is also discussed. Additionally, the resulting oxygen and water fraction
distributions and liquid water saturation fields at fixed cathode humidity are obtained
to validate the simulation results. Chapter 4 reports the formation and influence of the
gas-liquid interface location along the flow channel direction at various cell
temperatures and humidification temperatures with a non-isothermal,
three-dimensional, multi-component, and two-phase model of a PEM fuel cell. The
temperature distribution in the cell domain membrane and the distributions of
temperature and liquid water saturation in the cross-section of the cathode gas
diffusion layer in the inlet region are investigated. In Chapter 5, the conclusions of
Figure 1.1 Basic components of a single PEMFC End plate Current collector Bipolar plate Diffusion media Membrane Current collector End plate Current collector Bipolar plate Diffusion layer Catalyst layer Membrane Diffusion layer Bipolar plate Current collector End plate End plate
Figure 1.2 Operating principle of a single PEMFC
Load
e
-H
+H
2e
-e
-Anode
Cathode
O
2H
2Electron
Proton
O
2H
2O
Figure 1.3 The dominant mechanisms of cell performance Open-circuit potential
Electrode Kinetic Dominate
Ohmic Polarization Dominate
Mass Transport Dominate
Cell V
oltage
CHAPTER 2
MATHEMATICAL MODELING
Traditionally, macroscopic problems of two-phase flow and transport in
porous media have been modeled using a two-fluid approach. However, this approach
results in a large number of primary variables for each phase, and highly nonlinear
equations. Therefore, exact solutions of two-phase problems with two-fluid models
are limited to a very limited number of problems with many simplifying assumptions.
Furthermore, the two-fluid models require explicitly tracking the irregular and moving
interface between two phases, increasing the numerical complexity of the problem.
Particularly in PEM fuel cells, the gas-liquid interfaces, i.e., the condensation and
evaporation fronts, are expected as well as the coexistence of single- and two-phase
regions. Therefore, a convenient model capable of describing both single- and
two-phase regions without a need to track the irregular, a priori unknown interface is
required. For these reasons, the multiphase mixture (M2) formulation of Wang and
Cheng [12] is particularly suitable for two-phase PEM fuel cell modeling. The
multiphase mixture model is a mathematical reformulation of the classical two-phase
the multiphase flow is then described in terms of a mass-averaged mixture velocity
and diffusive flux, representing the difference between the mixture velocity and
individual phase velocity. One major advantage of the M2 model over the classical
two-fluid models is that it eliminates the need for tracking phase interfaces, thus
simplifying the numerical complexity of two-phase flow and transport modeling.
Another salient feature of the M2 model for PEM fuel cell is that all model equations
are valid in all three types of regions possible in a PEM fuel cell: single-phase (gas),
liquid-gas (two-phase), and single-phase (liquid). Finally, the M2 model is
mathematically equivalent to two-fluid models without invoking any additional
approximations. These aforementioned advantages render the M2 model to be a
suitable and widely adopted two-phase flow and transport modeling framework for
PEM fuel cells [11, 13, 15].
In this chapter, a three-dimensional, two-phase, multi-component model of a
PEM fuel cell is presented and the present analytical study focus on two-phase
transport taking place in the cathode due to the production of water in the cathode
catalyst layer.
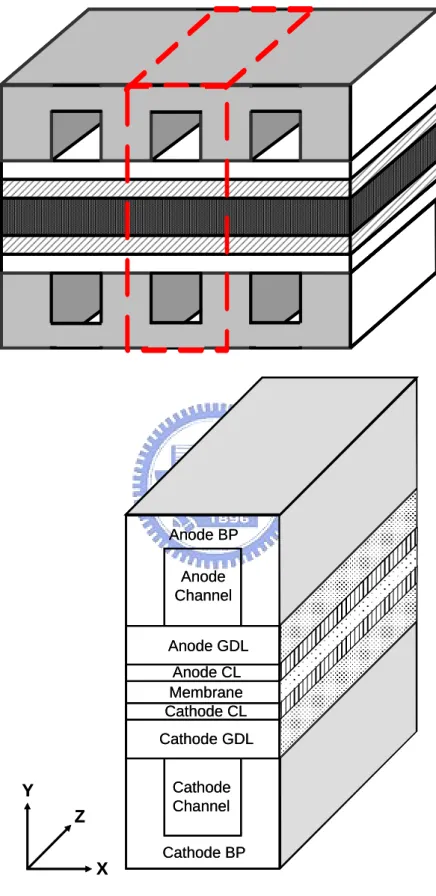
2.1 Model Description
bipolar plates, gas flow channels, gas diffusion layers, and catalyst layers on both the
anode and cathode sides, and a polymer membrane that is sandwiched between them,
as illustrated in Fig. 2.1. Symmetry is assumed, and a single straight flow channel is
therefore considered herein.
2.2 Basic Assumption
Utilizing the homogeneous model of M2 formulation for two-phase transport,
the proposed model incorporates the following assumptions. These basic assumptions
are made to simplify actual cell conditions in the theoretical model and thus facilitate
the modeling approach of transport component influence on transport phenomena and
cell performance.
z The gaseous phase of the working fluid behaves as an ideal gas and the liquid
water is incompressible;
z The Reynolds number of the fluid is below 100 because the velocity of the
mixture is low, and the flow is considered to be laminar;
z The properties of the porous medium are isotropic and homogeneous.
z The system operates in a steady state;
2.3 Governing Equations
The three-dimensional, multi-component, and two-phase model of a PEM fuel
cell includes five nonlinear coupled conservation equations of mass, momentum,
energy, species, and charge, which are described as follows.
Mass conservation equation
Since the gaseous and liquid water are present simultaneously in the control
volume, the conservation equation of mass for a multiphase mixture is:
(
)
=0 ⋅∇
ε
effρ
uK (2.1)where ρ represents the density of the mixture and is defined as the volume-weighted
average of the phase mass concentration in two-phase flow [11]. When the liquid
water is present, the effective porosity is given by
ε
eff = 1ε
(
−s)
.Momentum conservation equation
The general form of the Navier–Stokes equation is used with source terms that
describe the drag forces in the porous medium. The equation is:
(
effuu)
= − eff∇P+∇⋅(
eff eff∇u)
+ eff kg+Sm⋅
∇
ρε
KKε
ε
μ
Kε
ρ
(2.2)where μeff is the effective viscosity of the mixture, ρk is the kinetic density, and Sm is the sum of the Darcy and the Forchheimer drag forces,
)
( Darcy Forch
m F F
S =− G + G (2.3)
Darcy drag force =
K u
FDarcy eff eff
G
G
ε
2μ
= (2.4)
Forchheimer drag force = uu
K C
FGForch
ε
eff Fρ
G G3
= (2.5)
The parameters CF andK represent the quadratic drag factor and the permeability.
Species conservation equation
The species conservation equation for the gas mixture is
(
effuCk)
=∇⋅(
Dkeff∇Ck)
+Sc⋅
∇
ε
G , (2.6)where k represents the chemical species, including hydrogen, oxygen, nitrogen, and
water. Dk,eff =
D
kε
τrepresents the effective diffusion coefficient of the k-th componentof the fuel reactant [17]. The exponent τon the porosity ε is the tortuosity of the
porous medium. The source term Sc defines the production or consumption of the k-th
species in the gas phase and is given by:
a a j FC H 2 1 : 2 − (2.7) c c j FC O 4 1 : 2 − (2.8) c c j FC O H 2 1 : 2 (2.9)
The terms jaand jcare defined as,
( ) ( ) ⎥⎦⎤ ⎢⎣ ⎡ − ⎟ ⎟ ⎠ ⎞ ⎜ ⎜ ⎝ ⎛ = α F/RT η α F/RT η ref H H ref a a c e e C C Aj j 1 2 2 0
(2.10)
( ) ( ) ⎥⎦⎤ ⎢⎣ ⎡ − ⎟ ⎟ ⎠ ⎞ ⎜ ⎜ ⎝ ⎛ = α F/RT η αF/RT η ref O O ref c a c e e C C Aj j 1 2 2 0
(2.11)
The above conservation equations of mass, momentum, and species are derived on
the basis of the M2 model. The constitutive relationships of mixture parameter and
variables are all dependent on the liquid saturation, defined as the ratio of the liquid
volume to the pore volume:
pore l V V s= (2.12) Density:
ρ
=ρ
ls+ρ
g(
1−s)
(2.13) Concentration:ρ
C =ρ
lCls+ρ
gCg(
1− s)
(2.14)Effective porosity:
ε
eff = 1ε
(
−s)
(2.15)Kinetic density:
ρ
k =ρ
lλ
l( )
s +ρ
gλ
g( )
s (2.16) Effective viscosity:(
)
(
(
)
)
g rg l rl g l eff k k s sν
ν
ρ
ρ
μ
+ − + = 1 (2.17) Relative permeability:(
)
phase phase gas liquid s k s k rg rl ⎪⎩ ⎪ ⎨ ⎧ − = = 3 3 1 (2.18) Relative mobility:( )
( )
( )
phase phase gas liquid s s k k k s l g g rg l rl l rl l ⎪ ⎩ ⎪ ⎨ ⎧ − = + =λ
λ
ν
ν
ν
λ
1 (2.19)Liquid water transport
water vapor exceeds the saturation vapor pressure. The liquid water thus formed may
occupy the pores and thereby prevent the diffusion of fuel, causing mass transport
overpotential in the porous medium. Hence, the effect of liquid water is taken into
account. Additionally, capillary forces dominate the transport of liquid water on the
hydrophilic surfaces because the pores in the porous medium are extremely small.
Therefore, the generalized Richards equation, developed by Wang and Beckermann
[12, 40] to elucidate the two-phase flow transport in capillary porous media, is
applied:
( )
(
)
(
)
l l rg g rl g l rg rl c eff l eff S k k g k Kk s D s u ⎟⎟+ ⎠ ⎞ ⎜ ⎜ ⎝ ⎛ + − − ∇ ⋅ ∇ = ⋅ ∇ν
ν
ρ
ρ
ε
λ
ρ
ε
K (2.20)whereDcandPcrepresent the capillary diffusion coefficient and the capillary pressure,
respectively:
(
)
l rg g rl c rg rl c k k ds dP k Kk Dν
ν
+ − = (2.21)( )
s J K Pc c eff 2 1 cos ⎟⎟ ⎠ ⎞ ⎜⎜ ⎝ ⎛ =ς
θ
ε
(2.22)and where J(s) is the Leverett function, which takes the following form [41, 42]:
( )
(
)
(
)
(
)
⎭ ⎬ ⎫ ⎩ ⎨ ⎧ > < + − − + − − − = 2 3 00 3 2 90 90 263 . 1 12 . 2 417 . 1 1 263 . 1 1 12 . 2 1 417 . 1 c c s s s s s s s Jθ
θ
(2.23)In Eq. (2.22), the contact angle, θc, of the gas diffusion layer is dependent upon the
hydrophilic (0° < θc < 90°) or hydrophobic (90° < θc < 180°) nature of this layer, and
varies with the Teflon content. We assume here that the gas diffusion layer is a
hydrophilic medium. Further, the surface tension, ζ, for the liquid water-air system is
taken as 0.0625 N/m [41].
The source term Sl is a simplified switch function between condensation
and/or evaporation of liquid water under these non-equilibrium conditions [15]. When
the partial pressure of water vapor exceeds the saturation pressure of water, liquid
water may form and occupy the pores in the porous medium. Conversely, the liquid
water will evaporate if the partial pressure of water vapor is less than the saturation
pressure of water: ⎪ ⎩ ⎪ ⎨ ⎧ < − > − = sat w O H w l eff eva sat w sat w w eff con l l P P x if P P x s r P P x if P P x RT x r M S ), ( , ) ( 2
ρ
ε
ε
(2.24)where rcon and reva are the condensation and evaporation rate constants, respectively;
w
x is the molar fraction of water vapor, and Psatis the saturation pressure of water,
which varies with the temperature [4].
3 7 2 5 10 2.1794 0.02953 9.1837 10 1.4454 10 log Psat =− + T − × − T + × − T (2.25)
The heat generation sources in a PEM fuel cell account for the irreversible
heat and entropic heat that is generated by electrochemical reactions, Joule heating
that arises from proton/electronic resistance, and the latent heat of water condensation
and/or evaporation. A generalized energy conservation equation is:
(
)
T n i n j i j ij eff p eff S i i S h w D T k T u C ⎟⎟− + ⋅ + ⎠ ⎞ ⎜⎜ ⎝ ⎛ ∇ + ∇ ⋅ ∇ = ⋅ ∇∑∑
= − =σ
ρ
ρ
ε
η 1 1 1 G (2.26)where k represents the effective thermal conductivity. On the right-hand side of eff
the equation, the first two terms represent the conduction energy and the reactant
enthalpy flux; the third and fourth terms represent electrical-related thermal effects,
and the last term is a source term, associated with the phase change.
Charge conservation equation
In a fuel cell, the potential gradient effect causes electrons and protons to
move along individual paths. Solid phase potential controls the movement of electrons.
Electron transport generally occurs only in the bipolar plates, the diffusion layers, and
the catalyst layers. However, ionomer phase potential controls the motion of protons,
which occurs in the catalyst layer and the membrane. Potential fields in these two
media are described as follows.
(
∇)
+ =0 ⋅ ∇σ
effφ
e Sφe (2.27) c a j j Sφe =− (2.28) For protons:(
∇)
+ =0 ⋅ ∇κ
effφ
p Sφp (2.29) c a j j S p − = φ (2.30)where σeff , κeff , φe , φp,
e
Sφ and
p
Sφ denote electron conductivity, proton
conductivity, electronic phase potential, electrolyte phase potential, and consumption
rates of charge and product in the electrochemical reaction in the catalyst layer,
respectively.
The membrane conductivity is strongly related to the temperature and the
water content λ . It is defined as the ratio of the number of water molecules to the
number of charge sites [4]:
(
)
⎥ ⎦ ⎤ ⎢ ⎣ ⎡ ⎟ ⎠ ⎞ ⎜ ⎝ ⎛ − − = T T eff 1 303 1 1268 exp 00326 . 0 05139 ) (ψ
κ
(2.31)The water content of the membrane surface depends on the activity of the water vapor,
which also depends on the partial pressure of the water. Therefore, the empirical
relationship between them can be applied: At anode At cathode
At anode At cathode
⎩ ⎨ ⎧ ≤ < − + ≤ ≤ + − + = 3 1 ) 1 ( 4 . 1 14 1 0 0 . 36 85 . 39 81 . 17 043 . 0 2 3 a a a a a a
ψ
(2.32) sat w P P x a= (2.33) 2.4 Boundary ConditionsBoundary conditions are necessary and crucial for solving the above equations.
They describe the operating conditions as well as the model geometry characteristic of
the PEM fuel cell. Due to the single-domain formulation, boundary conditions are
required only at the external surfaces of the computational domain. The most
important ones are as follows.
Inlet boundaries: The fuel and oxidant flow rates along the flow channel can be
described by a stoichiometric flow ratio,
ξ
, which is defined as the ratio of theamount of reactant supplied to the amount of reaction to generate the specified
reference current density Iref. [37]. At the gas channel, the temperature and gas species
concentrations are assumed to be uniform. The inlet velocities are specified by
ch O in a in a m ref a in a A x P RT A F I u 1 1 2 2 , , , =
ξ
(2.34) ch H in c in c m ref c in c A x P RT A F I u 1 1 4 , 2 , , =ξ
(2.35)respectively. Am is the geometrical area of the membrane and Ach is the cross-sectional
area of the gas channel.
Outlet boundaries: Fully developed flow is applied. At the outlets, both anode and
cathode channels assumed sufficiently long so that velocity and species concentration
fields are fully developed.
Walls:Neumann conditions and no-slip conditions are applied.
Symmetric boundaries:Mass flux or momentum flux have zero gradients.
Electronic phase potential boundaries: Fixed total cell overpotential at the outer
boundary of the cathode is specified.
plate plate bipolar bipolar otherwise cathode anode at at y e cell e e ⎪ ⎪ ⎩ ⎪ ⎪ ⎨ ⎧ = ∂ ∂ = = 0 0
φ
η
φ
φ
(2.36)The cell potential can be obtained from the following expression
tot oc l ce V
V = +η (2-37)
where ηtot andVocare total cell overpotential and pen circuit voltage, respectively
[17]. T 0025 . 0 2329 . 0 Voc = + (2-38)
2.5 Numerical Procedures
2.5.1 Numerical Method
The solution to the governing equations is performed by employing a finite
volume scheme with the model domain divided into a number of cells as control
volumes. The governing equations are numerically integrated over each of these
computational cells or control volumes. The method exploits a collocated
cell-centered variable arrangement with the local or cell-averaged values of the
physical quantities evaluated and stored at each cell center.
The governing equations can be expressed in the form of a generalized
convection-diffusion type of transport equation:
(
ρ
uϕ
−Γ
ϕ∇ϕ
)
=Sϕ⋅
∇ (2-39) where ϕ denotes the general dependent variable, Γ the exchange coefficient, ϕ S ϕ
the source term, uG velocity vector, and ρ the density. With the discretization of the governing equations, the coupled finite-difference equations can be expressed in
the form of φ ϕ ϕ ϕ ϕ ϕ a a a a S aP P = E E + W W + N N + S S + (2-40)
where ϕ is the value of ϕ at the current point P, P ϕ …E ϕ stand for the values of S
the grid points adjacent to the point P, and aP…aS are known as the link
2.5.2 Calculation Procedure
The governing equations with their related boundary conditions are solved
using a commercial code based on the SIMPLE algorithm for convection-diffusion
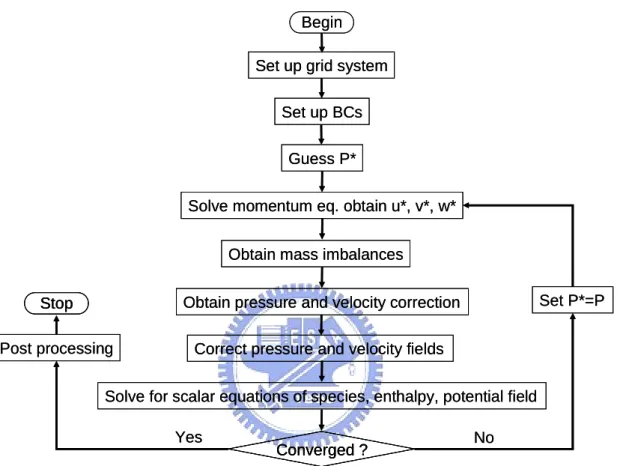
problems. The numerical flow diagram of present investigation is shown in Fig. 2.2.
As a convergence criterion it is imposed that the normalized residual for each model
variable is smaller than 10−4 [43].
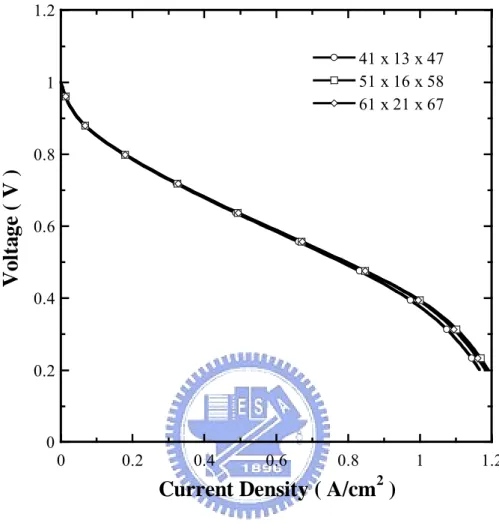
2.5.3 Model Validation
In the simulation, a uniform grids distribution is used to calculate the complex
electrochemical reaction and physical phenomena in the fuel cell. Three mesh
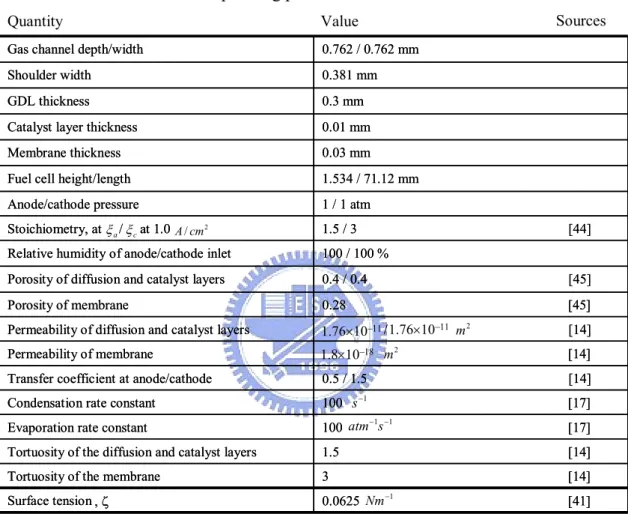
systems- 41 x 13 x 47, 51 x 16 x 58, and 61 x 21 x 67 are constructed to explore
numerical result dependence on computational cell numbers. Table 2.1 presents
geometrical and operating parameters of the base model in the PEM fuel cell. The
results of the polarization curve by the base model under different grid systems are
shown in Fig. 2.3. Considering both accuracy and economics, the grid system of 51 in
the z-direction, 16 in the x-direction, and 58 in the y-direction was selected for present
research.
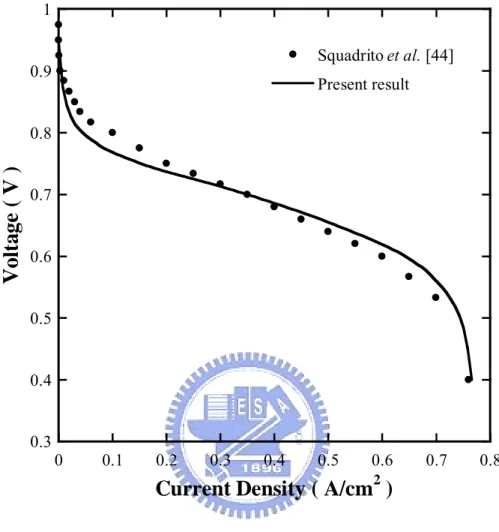
To further check the adequacy of the numerical scheme, it is clearly seen from
Fig. 2.4 that the present predictions agree reasonably with the experimental data of
the numerical method used are generally appropriate in analysis of the present
3 [14] Tortuosity of the membrane
0.0625 [41] Surface tension, ζ
100 [17] Evaporation rate constant
1.5 [14] Tortuosity of the diffusion and catalyst layers
0.5 / 1.5 [14] Transfer coefficient at anode/cathode
100 [17] Condensation rate constant
1 / 1 atm Anode/cathode pressure
1.534 / 71.12 mm Fuel cell height/length
0.03 mm Membrane thickness
0.01 mm Catalyst layer thickness
0.3 mm GDL thickness
0.381 mm Shoulder width
0.762 / 0.762 mm Gas channel depth/width
100 / 100 % Relative humidity of anode/cathode inlet
1.5 / 3 [44] Stoichiometry, at / at 1.0
0.28 [45] Porosity of membrane
0.4 / 0.4 [45] Porosity of diffusion and catalyst layers
[14] Permeability of membrane
/ [14] Permeability of diffusion and catalyst layers
Table 2.1. Geometrical and operating parameters
Quantity Value 11 10 76 . 1 × − 1.76×10⁻¹¹ 18 10 8 . 1 × − 2 / cm A a ξ ξc 2 m 2 m 1 − s 1 1 − −s atm Sources 1 − Nm
Cathode BP Anode BP Cathode Channel Anode Channel Cathode GDL Cathode CL Membrane Anode CL Anode GDL X Y Z Cathode BP Anode BP Cathode Channel Anode Channel Cathode GDL Cathode CL Membrane Anode CL Anode GDL X Y Z
Begin
Solve momentum eq. obtain u*, v*, w*
Obtain pressure and velocity correction Guess P*
Set P*=P Stop
Solve for scalar equations of species, enthalpy, potential field Obtain mass imbalances
Correct pressure and velocity fields
Converged ?
Yes No
Set up grid system
Set up BCs
Post processing
Begin
Solve momentum eq. obtain u*, v*, w*
Obtain pressure and velocity correction Guess P*
Set P*=P Stop
Stop
Solve for scalar equations of species, enthalpy, potential field Obtain mass imbalances
Correct pressure and velocity fields
Converged ? Converged ?
Yes No
Set up grid system
Set up BCs
Post processing
0 0.2 0.4 0.6 0.8 1 1.2 0 0.2 0.4 0.6 0.8 1 1.2 41 x 13 x 47 51 x 16 x 58 61 x 21 x 67
Vo
lt
a
g
e (
V
)
Current Density ( A/cm
2)
0.3 0.4 0.5 0.6 0.7 0.8 0.9 1 0 0.1 0.2 0.3 0.4 0.5 0.6 0.7 0.8 Squadrito et al. [44] Present result
Vo
lt
a
ge (
V )
Current Density ( A/cm
2)
Figure 2.4 Comparison of the predicted I–V curve and the experimental data of Squadrito et al. [44].
CHAPTER 3
EFFECTS OF CATHODE HUMIDIFICATION AND POROSITY OF THE GDL ON THE GAS–LIQUID INTERFACE LOCATION IN A PEM FUEL CELL
3.1 Introduction
A PEM fuel cell is prone to gas-liquid two-phase formation due to its low
operating temperature, particularly under highly humidified or high current density
conditions. When the gas diffusion layer and the catalyst layer become saturated with
water vapor, the product water starts to condense and block open pores, reducing the
available paths for oxygen transport. This phenomenon is termed “flooding” and
becomes a major limiting factor of PEM fuel cell performance. Hence, it is critical to
understand the two-phase flow and transport in a PEM fuel cell, and a mathematical
model is useful to improve this understanding. In practice, humidification of anode
fuels and/or cathode oxidants is often used to provide sufficient membrane hydration.
Since water is generated in the cathode catalyst layer from electrochemical reaction
and it also tends to migrate from the anode side to the cathode side by the
electro-osmotic drag, it becomes a key issue in the design and operation of PEM fuel