TEAM 2013, Sep. 9 - 12, 2013, Keelung, Taiwan
Assessment of Critical Fatigue Crack Length Considering the Fracture Failure of Ship Longitudinal Members
Yann Quemener1*, Huang Chien-Hua1., Lee Chi-Fang1 1) Surveyor
Research department,
China Corporation Register of Shipping,
8th Fl., No.103, Sec. 3, Nanking E. Rd., Jhongshan Dist., Taipei, 104, Taiwan R.O.C.
*) e-mail: [email protected]
Abstract
This study investigates the fracture failure of ship longitudinal members constituted of a stiffener and its attached plate, in which a crack has propagated by fatigue from the stiffener flange or from the fillet weld. During the ship life, fatigue cracks may initiate in the structure. Owing to the difficulty to detect every small crack during ship surveys, some of them may propagate by fatigue till a length that can be critical in view of the fracture, when the ship meets extreme loading conditions. This study proposes a quantitative evaluation of the critical crack length.
Specifically, this study employs the failure assessment diagram methodology to assess the conditions of failure at the crack tip. Based on various crack configurations, this study establishes the analytical formulations of the crack-tip condition that are validated using finite element analyses. The material toughness is expressed in terms of crack-tip opening displacement. The failure assessment diagram allows then to evaluate the failure stress of cracked longitudinal members as a function of the crack length. This enables determining critical fatigue crack lengths corresponding to the maximum longitudinal stresses derived from extreme loads. For ship longitudinal members, the critical crack lengths are found to be very large, so that regular ship surveys are very likely to be sufficient to prevent fatigue cracks from propagating beyond this critical limit.
Keyword: Fracture, Longitudinal member, FAD, CTOD
1. INTRODUCTION
During the ship's lifetime, fatigue cracks may initiate in the ship's structure. These cracks may propagate to a length that can be critical in view of the fracture when the ship encounters extreme loading conditions. This level of crack length is hereafter named the critical crack length.
It is well accepted that ship design and fabrication provides sufficient fracture resistance to the structure. IACS [1]
states that, in ships, inherent redundancy prevents the local loss of a structural member from immediately endangering the global structural integrity. Steel toughness is also finely controlled to ensure that fatigue cracks do not result in extensive brittle fractures, as it has occurred in the past for the Liberty ships.
However, the newly adopted goal based ship construction standards (GBS) [2] provide that the actual redundancy in ship design must be demonstrated. Researchers have proposed various approaches to address this problem. Guedes Soares et al. [3] analyzed the effects of fatigue crack growth on the ship global strength, yet neglected the fracture as the governing mode of component loss. Dinovitzer et al. [4] analyzed the fracture toughness of typical longitudinal members in the ship structure using the failure assessment diagram (FAD) methodology of the British Standard [5].
The European fitness-for-service network (FITNET) [6] developed also a structural integrity assessment procedure (SINTAP) to determine the significance of cracks in terms of fracture. Within SINTAP project, Wallin et al. [7]
proposed a material fracture toughness estimation scheme.
Thus, for typical longitudinal members, this study presents a quantitative evaluation of the critical fatigue crack lengths.
This article consists of three sections. The first section presents the scope of the study. The second section establishes, for various crack configurations, the fracture assessment point analytical expressions. Finally, the third section evaluates the critical fatigue crack length.
2. SCOPE OF THE STUDY
2.1 Longitudinal members including fatigue cracks
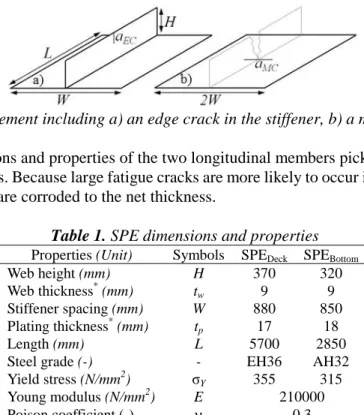
The ship considered in this study is a Capesize bulk carrier in full loading condition. Two longitudinal members in the midship area have been selected from the deck and the bottom region. Indeed, the high level of stresses in these regions leads to greater material toughness requirements [8] than other locations. The considered longitudinal member called a stiffened plate element (SPE) by the ultimate capacity assessment methodology of IACS [1], consists of a stiffener and its attached plating. This study represents the stiffener as a flat bar. Figure 1 shows the SPE geometry, where H is the stiffener’s web height, W is the stiffener’s spacing, and L is the longitudinal member’s span between two transverse webframes.
Fig 1. Stiffened plate element including a) an edge crack in the stiffener, b) a middle crack in the plate Table 1 presents the dimensions and properties of the two longitudinal members picked up from the deck (SPEDeck) and bottom (SPEBottom) regions. Because large fatigue cracks are more likely to occur in the end of the ship's life, this study considers that the SPE are corroded to the net thickness.
Table 1. SPE dimensions and properties Properties (Unit) Symbols SPEDeck SPEBottom
Web height (mm) H 370 320
Web thickness* (mm) tw 9 9
Stiffener spacing (mm) W 880 850 Plating thickness* (mm) tp 17 18
Length (mm) L 5700 2850
Steel grade (-) - EH36 AH32
Yield stress (N/mm2) σY 355 315 Young modulus (N/mm2) E 210000
Poison coefficient (-) ν 0.3
* Net thickness
The studied cracks initiate from the stiffener's free edge or from the fillet weld, and grow into the base material by fatigue. This study considers two crack configurations:
An edge crack propagates from the stiffener’s free edge through the web height, whereas the plating remains uncracked. This crack configuration is called a stiffened plate element including an edge crack in the stiffener.
Figure 1a shows a representation of this crack configuration where aEC is the edge crack length.
The previous cracked stiffener fails, and the crack then propagates to the plating by fatigue. This crack configuration is called a stiffened plate element including a middle crack in the plating . Figure 1b shows this crack configuration where aMC is the full length of the middle crack.
The middle crack in the plating affects the entire width of the plating between the two adjacent stiffeners. Therefore, for the middle crack configuration, the plating width corresponds to twice the stiffener spacing (2W; see Fig. 1b), whereas a plating width corresponding to one time the stiffener spacing (W; see Fig. 1a) has been retained for the edge crack configuration.
Under the action of the hull girder vertical bending moment, the hull bending curvature imposes a uniform displacement (∆) on the SPEs with an amplitude directly proportional to its vertical location in the hull cross-section.
The material behaviour is set as linear-elastic with an elasticity modulus (E), leading to the expression of the longitudinal stress in the SPE in Eq. (1).
LE
σSPE = ∆ (1)
This study assesses the condition of fracture for those longitudinal members.
2.2 Fracture mechanics
The fracture mechanics field of interest is the analysis of the mechanisms of the crack propagation in materials.
Usually, two categories are identified: the linear-elastic fracture mechanics (LEFM) and the elastic-plastic fracture
mechanics (EPFM). The LEFM theory, which is governed by brittle fracture, is reasonably well established, and the stress intensity factor (SIF or K) approach is the most widely employed (e.g.: fatigue assessment). However, the steel employed in ship construction is carefully controlled to ensure that fractures occur in a ductile manner. The ductile fracture cannot be assessed accurately by methods purely based on LEFM theory. Thus, some situations require the use of the EPFM using approaches such as the crack-tip opening displacement (CTOD).
The applicability of each field of fracture mechanics is not clearly defined. Thus, the failure assessment diagram (FAD) methodology is a very practical approach because it encompasses the full range of fracture behaviour.
2.3 Failure Assessment Diagram
This study is based on the FAD methodology proposed by the British Standard [5]. A sounder theoretical background of this approach can be found in [8]. The British Standard proposes three levels of fracture assessment.
The choice of the level depends on the amount of input data available and the desired degree of precision of the results. This study uses the “Level 2”, defined as the “normal assessment”.
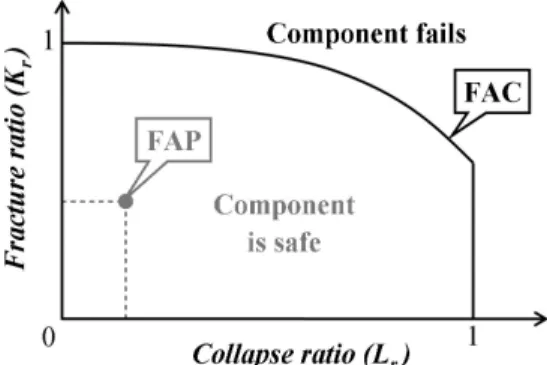
The failure assessment diagram principle is based on the interaction between fracture and collapse in a structural component including a crack. Figure 2 presents the failure assessment diagram corresponding to the Level 2.
In the ordinate, the fracture ratio (Kr) is the ratio of the applied crack driving force to the fracture toughness of the material. In the abscissa, the collapse ratio (Lr) is the ratio of the applied load to the limit load of the structural member.
Fig 2. Failure assessment diagram
The failure assessment curve (FAC) represents the predicted limit conditions of the modes of failure, from a brittle to a ductile fracture. Equation (2) provides the Level-2's FAC expression for Lr from zero till unity. If Lr is greater than unity, Kr is simply set to zero, because this study does not consider the failure by collapse that occurs beyond Lr=1.
(
1 014 2r) [
03 07exp(
065 6r) ]
r . L . . . L
K = − ⋅ + − (2)
A failure assessment point (FAP) can be determined for a given loaded cracked component. If the FAP is included in the area below the FAC (see Fig.2), the considered component is not supposed to fail. An FAP above the FAC represents an unacceptable level of crack which may cause the component failure. In addition, an FAP close to the vertical axis means that the potential fracture is brittle. However, an FAP in the vicinity of a collapse ratio equal to unity indicates that the potential failure is characterized by the global yielding of the considered structural member.
The fracture ratio expression (see Eq. (3)) is a ratio of the crack driving force represented by the Mode I stress intensity factor (KI) to the material toughness Kmat, which is derived from the measured CTOD (δmat).
δ E' σ X
K K
K K
mat Y
I mat
I
r = = ⋅ ⋅2 ⋅ (3)
where σY is the material yield stress and E' is the elastic modulus corrected for constraint conditions (E'=E for plane stress, E'=E/(1 – ν2) for plane strain). The term X is set to 1 as proposed by the British Standard [5] for the case in which X is not quantified by structural analyses. Equation (4) defines the stress intensity factor (KI).
πa σ Y
KI = ⋅ (4)
where σ is the applied stress, Y is a dimensionless function related to the crack configuration, and a is the crack length.
Equation (5) provides the collapse ratio expression.
P0
Lr = P (5)
where P is the applied load and P0 is the limit load at which the cracked structural member's yield strength is reached.
The FAD approach classifies stresses based on their nature. The primary stresses σp are defined as the loads applied to the structure, whereas other stresses, including the residual stress, coming from the fabrication process, are categorized as secondary stresses σs. A significant property of secondary stresses is that they cannot by themselves cause plastic collapse because they arise from stress/displacement limited phenomena. However, they contribute to the severity of the local condition at the crack tip. Their contribution adds to the primary stress in the KI expression (see Eq.(4)) by replacing σ with σp+σs.
Finally, if the structure is loaded with a combination of primary and secondary stresses, the resulting plasticity effects cannot be evaluated by a simple linear addition of the effects resulting from the two independent stress systems. The FAD includes a term ρ in the definition of the fracture ratio to cover the interaction between these two stress systems. The British Standard [5] proposes a simplified formulation of ρ when secondary loads are small, as given in Eq.(6).
( )
( )
<
<
−
⋅
⋅
=
≤
=
<
=
05 1 8
0 for 05
1 4
8 0 for
then , 4 if
1 1
. L . L
ρ . ρ
. ρ L
ρ
L K χ K
r r
r r
p I s I
(6)
Here, KI is the stress intensity factor. Its exponents s and p indicate that KI is computed, from the secondary or the primary stress respectively. The parameter ρ1 can be calculated using the expression provided in Eq. (7)
5 5 2
714 0
1 0.1 χ 0.007 χ 310 χ
ρ = ⋅ . − ⋅ + ⋅ − ⋅ (7)
Employing the FAD methodology to assess the conditions of fracture, the failure stress (σf) can be evaluated related to the crack length. As a limitation of the FAD level 2, if the fracture conditions are met, the element is assumed to fail without consideration for the subsequent crack propagation behaviour.
3. FRACTURE ASSESSMENT POINT 3.1 Formulation
This section presents an analytical formulation of the FAP for each crack configuration presented in section 2.1.
First, the collapse ratio (Lr) formulation has been presented in Eq. (5) as the ratio of the applied load P onto the limit load P0. The applied load is the product of the applied stress (σSPE) multiplied by the cross-sectional area of the SPE (see Eq. (8)).
(
P S)
SPE A A
P=σ + (8)
where AP and AS respectively represent the cross-sectional area of the uncracked plating and stiffener.
The limit load P0 of the SPE is the sum of the individual limit load of the plating and the stiffener. If the individual component does not include cracks, Eq. (9) can provide the limit load expression for this component.
(orS)
P YA σ
P0 = (9)
Anderson [8] provided limit load formulations for a flat plate including an edge crack (see Eq. (10)) and a flat plate including a middle crack (see Eq. (11)).
S EC EC
EC EC
EC Y
,EC A
H a b
a b
. a σ
P
−
−
+
= 1072 1 1
2
0 (10)
(
MC)
PY
,MC σ a W A
P0 = 1− 2 (11)
where the uncracked ligament length bEC corresponds to H-aEC.
The fracture ratio (Kr) expression (see Eq.(3)) is related to the longitudinal stress in the cracked component. Thus, Anderson [8] provided load line compliance solutions for a flat plate including an edge crack and a flat plate including a middle crack. These solutions resulted in expressions of the actual stress in a cracked stiffener (σS ; see Eq. (12)) and its attached cracked plating (σP ; see Eq. (13)).
+
= H
.V a a L
∆E
σS 4 EC EC EC (12)
⋅
− +
= W
.V a a
∆E L
σP MC MC MC
1 ν2 2 (13)
By substituting Eq. (1) into Eqs. (12) and (13), the actual stress in the cracked stiffener and that in its attached cracked plating can be expressed in terms of longitudinal stress in the SPE (σSPE) as provided in Eqs. (14) and (15).
+
= L
H .V a
σ a
σS SPE 1 4 EC EC EC (14)
( )
+
= − L
W .V a
ν a
σP σSPE 1 MC MC MC2
1 2 (15)
Based on the load line compliance solutions provided in [8], Eqs. (16) and (17) can compute cracked member's dimensionless elongation along the centerline, in the case of an edge crack (VEC) and that of a middle crack (VMC), respectively.
+
−
×
−
−
−
=
2
2 0.99 1 1.3 1.2 0.7
1 H
a H
a H
a H a
H a H a H
V a EC EC EC EC
EC EC EC
EC (16)
−
−
+
−
+
− +
−
=
W a W
a . W
. a ...
W . a W . a W . a W . a .
W V a
MC
MC MC
MC MC
MC MC
MC MC
1 2 2 ln 071 1 008 2
0
047 2 2 0
121 2 0
357 2 0
25 0 071 1
2 5
4 3
2
(17)
Finally, for each crack configuration (see Fig. 1), the dimensionless functions Y required to evaluate the stress intensity factor (see Eq. (4)) is assessed by FEA as presented in the next section.
3.2 FE-determination of dimensionless functions Y
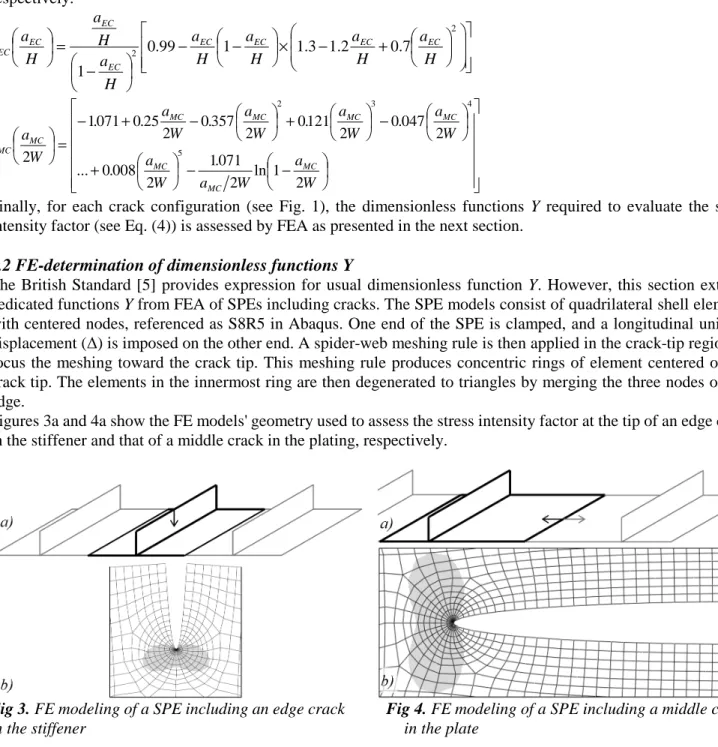
The British Standard [5] provides expression for usual dimensionless function Y. However, this section extracts dedicated functions Y from FEA of SPEs including cracks. The SPE models consist of quadrilateral shell elements with centered nodes, referenced as S8R5 in Abaqus. One end of the SPE is clamped, and a longitudinal uniform displacement (∆) is imposed on the other end. A spider-web meshing rule is then applied in the crack-tip region, to focus the meshing toward the crack tip. This meshing rule produces concentric rings of element centered on the crack tip. The elements in the innermost ring are then degenerated to triangles by merging the three nodes of one edge.
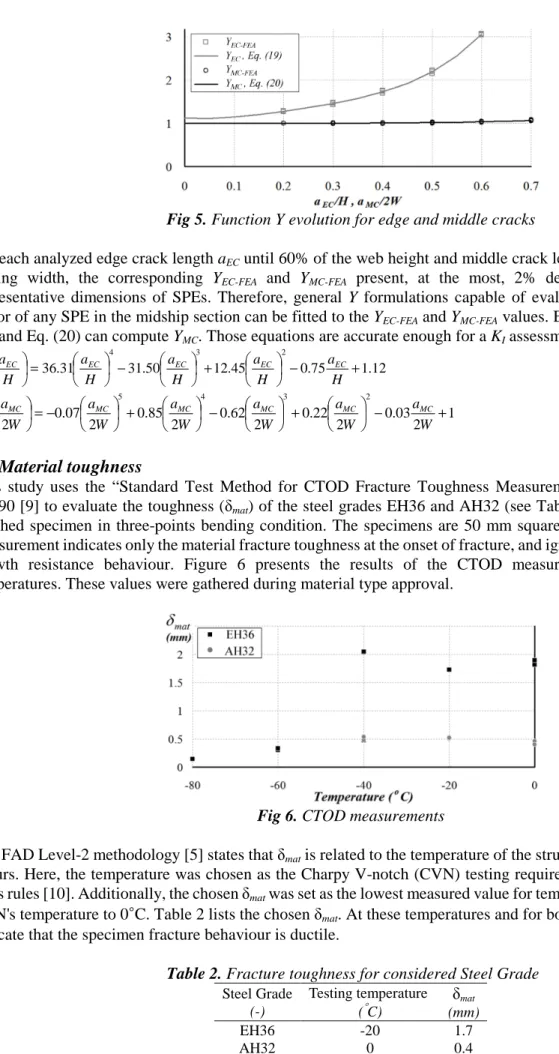
Figures 3a and 4a show the FE models' geometry used to assess the stress intensity factor at the tip of an edge crack in the stiffener and that of a middle crack in the plating, respectively.
Fig 3. FE modeling of a SPE including an edge crack Fig 4. FE modeling of a SPE including a middle crack
in the stiffener in the plate
In Figs. 3a and 4a, the structural members represented with thick lines are modeled with finite elements, whereas the effects of the adjacent structural members (thin lines) are considered through symmetry boundary conditions applied to the edges of the finite element model. The stiffener previously cracked in Fig. 3a has been removed in Fig. 4a because it is supposed to have failed (see Fig. 1b). Figures 3b and 4b also provide a view of the crack-tip meshing.
For the edge crack configuration (see Fig. 3) and for the middle crack configuration (see Fig. 4), FEA can assess the stress intensity factor (KI) for various crack lengths. These FEAs have been performed for various SPE's plating width (W) and stiffener web height (H) representative of the considered bulk carrier's midship section scantling.
Thus, Eq. (18) can compute the corresponding YEC-FEA and YMC-FEA using the FEA results KI,EC-FEA and KI,MC-FEA, respectively.
π a σ YFEA KI,FEA
= ⋅ (18)
where, a corresponds to aEC and σ to σS (see Eq. (14)) for the edge crack configuration, whereas a corresponds to 0.5aMC and σ to σP (see Eq. (15)) for the middle crack configuration.
Figure 5 presents YEC-FEA and YMC-FEA as extracted using FEA (see Eq. (18)).
Fig 5. Function Y evolution for edge and middle cracks
For each analyzed edge crack length aEC until 60% of the web height and middle crack length aMC until 70% of the plating width, the corresponding YEC-FEA and YMC-FEA present, at the most, 2% deviations between all the representative dimensions of SPEs. Therefore, general Y formulations capable of evaluating the stress intensity factor of any SPE in the midship section can be fitted to the YEC-FEA and YMC-FEA values. Equation (19) can compute YEC and Eq. (20) can compute YMC. Those equations are accurate enough for a KI assessment.
12 . 1 75 . 0 45
. 12 50
. 31 31
. 36
2 3
4
+
−
+
−
=
H a H
a H
a H
a H
YEC aEC EC EC EC EC (19)
2 1 03 . 2 0
22 . 2 0
62 . 2 0
85 . 2 0
07 . 2 0
2 3
4 5
+
−
+
−
+
−
=
W a W
a W
a W
a W
a W
YMC aMC MC MC MC MC MC (20)
3.3 Material toughness
This study uses the “Standard Test Method for CTOD Fracture Toughness Measurement” provided by ASTM E1290 [9] to evaluate the toughness (δmat) of the steel grades EH36 and AH32 (see Table 1). This test involves a notched specimen in three-points bending condition. The specimens are 50 mm square cross-sectional bars. The measurement indicates only the material fracture toughness at the onset of fracture, and ignores the subsequent crack growth resistance behaviour. Figure 6 presents the results of the CTOD measurement at various testing temperatures. These values were gathered during material type approval.
Fig 6. CTOD measurements
The FAD Level-2 methodology [5] states that δmat is related to the temperature of the structure at which the fracture occurs. Here, the temperature was chosen as the Charpy V-notch (CVN) testing required temperature depicted in class rules [10]. Additionally, the chosen δmat was set as the lowest measured value for temperatures ranging from the CVN's temperature to 0°C. Table 2 lists the chosen δmat. At these temperatures and for both steel grades, the results indicate that the specimen fracture behaviour is ductile.
Table 2. Fracture toughness for considered Steel Grade Steel Grade
(-)
Testing temperature (°C)
δmat
(mm)
EH36 -20 1.7
AH32 0 0.4
The results of this test are directly related to the specimen geometry because the stress triaxiality effect at the crack tip increases with the thickness [8]. However, using specimen thicker than any structural members in the ship, the crack-tip condition in the specimen is at least as much severe as the crack-tip condition in the real structure.
Therefore, transferring the measured δmat to the real structure leads to a conservative assessment of the failure conditions.
4. CRITICAL CRACK LENGTH ASSESSMENT
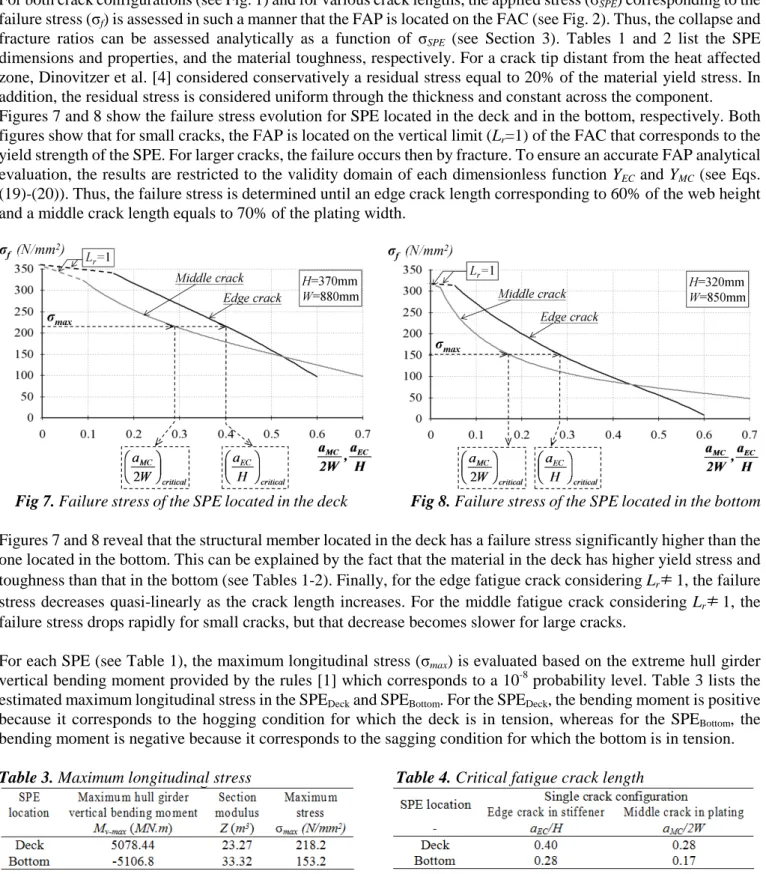
For both crack configurations (see Fig. 1) and for various crack lengths, the applied stress (σSPE) corresponding to the failure stress (σf) is assessed in such a manner that the FAP is located on the FAC (see Fig. 2). Thus, the collapse and fracture ratios can be assessed analytically as a function of σSPE (see Section 3). Tables 1 and 2 list the SPE dimensions and properties, and the material toughness, respectively. For a crack tip distant from the heat affected zone, Dinovitzer et al. [4] considered conservatively a residual stress equal to 20% of the material yield stress. In addition, the residual stress is considered uniform through the thickness and constant across the component.
Figures 7 and 8 show the failure stress evolution for SPE located in the deck and in the bottom, respectively. Both figures show that for small cracks, the FAP is located on the vertical limit (Lr=1) of the FAC that corresponds to the yield strength of the SPE. For larger cracks, the failure occurs then by fracture. To ensure an accurate FAP analytical evaluation, the results are restricted to the validity domain of each dimensionless function YEC and YMC (see Eqs.
(19)-(20)). Thus, the failure stress is determined until an edge crack length corresponding to 60% of the web height and a middle crack length equals to 70% of the plating width.
Fig 7. Failure stress of the SPE located in the deck Fig 8. Failure stress of the SPE located in the bottom Figures 7 and 8 reveal that the structural member located in the deck has a failure stress significantly higher than the one located in the bottom. This can be explained by the fact that the material in the deck has higher yield stress and toughness than that in the bottom (see Tables 1-2). Finally, for the edge fatigue crack considering Lr≠ 1, the failure stress decreases quasi-linearly as the crack length increases. For the middle fatigue crack considering Lr≠ 1, the failure stress drops rapidly for small cracks, but that decrease becomes slower for large cracks.
For each SPE (see Table 1), the maximum longitudinal stress (σmax) is evaluated based on the extreme hull girder vertical bending moment provided by the rules [1] which corresponds to a 10-8 probability level. Table 3 lists the estimated maximum longitudinal stress in the SPEDeck and SPEBottom. For the SPEDeck, the bending moment is positive because it corresponds to the hogging condition for which the deck is in tension, whereas for the SPEBottom, the bending moment is negative because it corresponds to the sagging condition for which the bottom is in tension.
Table 3. Maximum longitudinal stress Table 4. Critical fatigue crack length
According to Figs. 7 and 8, the critical crack lengths can be evaluated corresponding to the maximum longitudinal stress (σmax) defined in Table 3. Table 4 lists the critical fatigue crack lengths.
Table 4 reveals that although the applied maximum stress (σmax) in the bottom is approximately 30% lower than that on the deck, the critical crack lengths for the SPEBottom are significantly (~30-40%) smaller than that for the SPEDeck. It can be concluded that the low material yield stress and toughness in the bottom affects significantly the resistance capacity to fracture of the structural member located in that region.
CONCLUSION
This study evaluates the critical fatigue crack length of ship longitudinal members considering the fracture failure of those members including fatigue crack. Specifically, this study adopts the failure assessment diagram (FAD) methodology to assess the condition of fracture failure at the tip of various crack configurations. This study establishes the analytical formulations of the crack-tip condition that are validated using finite element analyses.
First, for each crack configurations, the failure stress evolutions are assessed as a function of the fatigue crack length. Then, the critical crack lengths are evaluated as they relate to a maximum axial stress derived from the extreme hull girder vertical bending moments:
For a single edge crack initiating from the free edge of a “flat bar” stiffener, the critical edge crack length corresponds to approximately 40% of the web height for a stiffener located in the deck and 28% for a stiffener located in the bottom.
For a single middle crack initiating from the fillet weld at the connection with the stiffener, the critical middle crack length corresponds to approximately 28% of the plating width for a panel located in the deck and 17% for a panel located in the bottom.
Finally, this study shows that for typical cracked longitudinal members, the ship design and fabrication provide sufficient redundancy against fracture to the cracked structure. Therefore, regular ship surveys are very likely to be sufficient to prevent fatigue cracks from propagating beyond this critical limit. This study also provides analytical formulations of crack-tip stress intensity factor that could be employed for fatigue crack growth assessment.
NOMENCLATURE
aEC , aMC Edge crack and middle crack lengths
AP, AS Cross sectional area of the plating and stiffener of a SPE KI Mode I stress intensity factor
Kr Fracture ratio
Lr Collapse ratio
Mv-max Maximum hull girder vertical bending moment
P Applied load
P0 Limit load
Y Dimensionless function (see Eq. (3))
∆ Structural member's longitudinal displacement
δmat Material toughness, crack-tip opening displacement (CTOD)
σf Failure stress
σmax Maximum stress
σP, σS Actual stresses in the cracked plating and stiffener σSPE Applied longitudinal stress in the SPE
REFERENCES
[1] CSR-H, Common Structural Rules for Bulk Carriers and Oil Tankers, IACS, (2012).
[2] IMO, Adoption of the international goal-based ship construction standard for Bulk Carriers and Oil Tankers, MSC.290(87), Maritime Safety Committee (MSC) , (2010).
[3] Guedes Soares, C. and Garbatov, Y., Fatigue reliability of the ship hull girder accounting for inspection and repair, Reliability Engineering and System Safety, 51(2) , (1996), pp. 341-351.
[4] Dinovitzer, A.S. and Pussegoda, N., Fracture toughness of a ship structure, SSC-430, Ship Structure Committee (SSC), Washington DC, (2003).
[5] BS7910, Guide to methods for assessing the acceptability of flaws in metallic structures, British Standard Institute (BSI), (2005).
[6] FITNET, Structural integrity assessment procedure, (1999).
[7] Wallin, K., Bannister, A. and Nevasmaa, P., New Unified Fracture Toughness Estimation Scheme for Structural Integrity Assessment, SINTAP background document, FITNET, (1999).
[8] Anderson, T.L., Fracture mechanics - Fundamentals and Applications, Taylor & Francis, Boca Raton, (2005).
[9] ASTM E1290, Standard Test Method for Crack-Tip Opening Displacement (CTOD) Fracture Toughness Measurement, American Society for Testing and Material, (2010).
[10] CR, Rules for the Construction and Classification of Steel Ships, China Corporation Register of Shipping (CR), (2009).