Jenn-Ming Song, Fang-I Li, Truan-Sheng Lui, and Li-Hui Chen
Department of Materials Science and Engineering, National Cheng Kung University, Tainan 701, Taiwan
(Received 28 January 2004; accepted 27 May 2004)
This study investigated the vibration fracture properties of Sn–Ag–Cu alloys with various Cu contents. Results show that the microstructure becomes finer with a higher Cu content. This leads to a lower damping capacity, higher deflection amplitude, and thus inferior vibration fracture resistance under a constant vibration force. It is of interest that when the Cu content reaches 1.5 wt%, the specimen possesses the highest damping capacity and greatest vibration life. The presence of massive primary Cu6Sn5
intermetallics probably accounts for this phenomenon.
I. INTRODUCTION
The Sn–Ag alloy system has been recognized as one of the best choices for industrial applications nowadays be-cause Sn–Ag alloys have excellent fatigue and creep properties. Nevertheless, the Sn–Ag eutectic alloy has a somewhat higher melting temperature and poorer wetta-bility compared to the traditional Sn–Pb solders. Accord-ing to previous studies,1–3adding Cu to the Sn–Ag solder can slightly decrease the melting temperature, increase the tensile strength, and most important of all, improve the wetting behavior. Thus, Sn–Ag–Cu alloys are con-sidered one of the most favorable systems as a lead-free solder.
Given that failure may occur due to vibration when solder joints are assembled, e.g., in vehicles and air-craft,4,5the vibration fracture resistance should be taken into consideration in alloy design for lead-free solders. Previous studies6–10have demonstrated that striated de-formation in the primary Sn-rich phase plays an impor-tant role in absorbing vibration energy and crack growth in Sn base solder alloys. Also, second phases dispersed in the Sn matrix, for instance, Pb-rich phase in Sn–Pb al-loys,7,8
Zn needles in Sn–Zn alloys,9
and Ag3Sn in
Sn–Ag alloys10
also influence the vibration fracture be-havior of solders.
The goal of this study was to investigate the vibration fracture behavior of Sn–Ag–Cu alloys, including crack propagation morphology and the ability to absorb vibra-tion energy. The effect of copper content on the micro-structure and vibration properties is the main concern.
II. EXPERIMENTAL PROCEDURES
The Sn–Ag–Cu alloys investigated were Sn– 3.5wt%Ag alloys with Cu content of 0, 0.5, 1.0, and 1.5 wt% (referred to as 0Cu, 0.5Cu, 1.0Cu, and 1.5Cu, respectively). All the samples were cast using a Y-shaped graphite mold. All the specimens were naturally aged at room temperature for 20 days to stabilize the microstruc-ture before testing. The microstructural characteristics were analyzed quantitatively with an image analyzer. Each datum represents the average of 15 observations.
The thermal behavior of the alloys was investigated using differential scanning calorimetry (DSC) analysis.
DOI: 10.1557/JMR.2004.0354
FIG. 1. (a) Vibration apparatus (1. vibration controller, 2. acceleration sensor, 3. vibration shaker, 4. specimen clamp, 5. specimen, 6. deflec-tion sensor, 7. recorder). (b) Dimension of test specimens (unit: mm).
The specimens were heated up to above 300 °C and then cooled to the ambient temperature, with a constant rate of 1°/min.
To collect tensile data for reference, rectangular speci-mens (gauge length section: 20 × 5 × 2 mm), were also prepared to perform tensile tests (initial strain rate: 7.5 × 10⁻⁴
s−1
). Each datum was the average of three tests or more.
A simple cantilever beam vibration system, as shown schematically in Fig. 1(a), was used for the vibration experiment. The rectangular test specimens [Fig. 1(b)], with dimensions 20 × 100 × 4 mm and two V-notches near the clamp, were clamped on end to the vibration shaker. The resonant vibration tests were conducted with
a fixed vibration force (3.5 G, where G denotes the ac-celeration due to gravity, 9.8 m/s2) at the resonant frequency. The resonance frequency, which was taken as the frequency leading to the largest deflection, was determined by varying the vibration frequency continu-ously. The variation in deflection amplitude against cyclic number was recorded. Each datum was the aver-age of results from more than 3 samples.
To understand the crack propagation due to vibration deformation, the crack tortuosity, defined as the ratio of the length of the main crack to the projected length of this crack along the transverse direction of the specimen, was quantified (Fig. 2). Each datum was the average of results from 5 samples.
Damping capacity was measured in terms of logarith-mic decrement (␦ value), which was derived from the deflection amplitude decay of a specimen under free vi-bration. Logarithmic decrement value is defined as fol-lows11
␦ ⳱ 1/n ln (Ai/Ai+n) ,
where Aiand Ai+nare the deflection amplitude of the ith
cycle and the (i+n)th cycle separated by n periods of oscillation.
III. RESULTS
Figure 3 shows the microstructure of the specimens investigated. As illustrated, the white dendritic region is
FIG. 2. Definition of crack tortuosity.
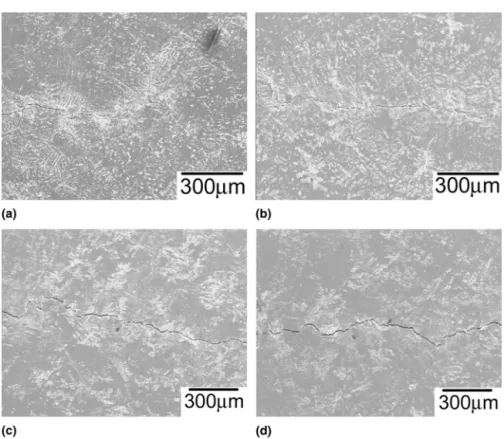
FIG. 3. Microstructures of the specimens: (a) 0 Cu, (b) 0.5Cu, (c) 1.0Cu, and (d) 1.5Cu.
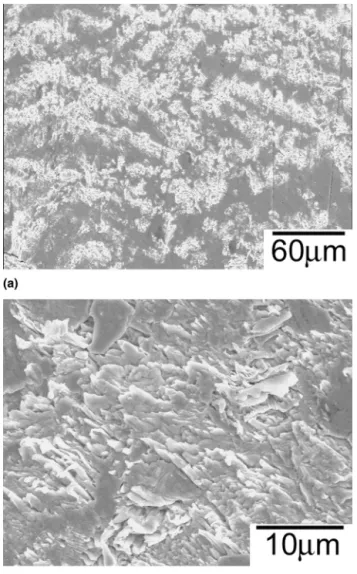
pro-eutectic Sn and the black region is eutectic structure, comprising Sn phase and fine granular Ag3Sn (as shown
in Fig. 4). It was also found that the proeutectic Sn den-drites became finer with an increased Cu content, while the Cu6Sn5compound particles could be clearly observed
when the Cu content reached 1.0 wt%. Figure 4 also shows that Cu6Sn5 dispersoids became numerous and
massive when the Cu content was 1.5 wt%. Notably, for the 1.0Cu sample, Cu6Sn5 particles were located in
eu-tectic regions, while most of the massive Cu6Sn5
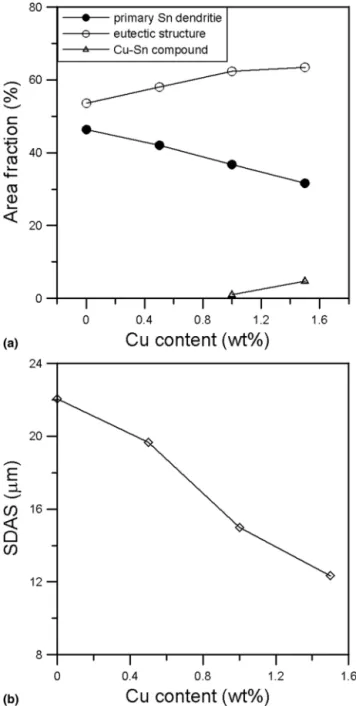
par-ticles in the 1.5Cu sample were found within proeutectic Sn dendrites. Quantitative data (Fig. 5) indicates that the area fraction of eutectic region and Cu6Sn5 increased,
and that of Sn dendrites decreased with a higher Cu content. Additionally, the second dendrite arm spacing (SDAS) diminished as the Cu content increased.
For further understanding the microstructural differ-ences caused by Cu additions, the thermal behavior of the
specimens was also examined. Figure 6 shows the DSC endothermic and exothermic peaks of the samples used upon heating and cooling respectively. Figure 6(a) re-veals that the whole peak obviously shifts to a lower temperature with a small amount of Cu additions, but this tendency reduces with a higher Cu content. Similarly, the exothermic peaks upon cooling also moved to a lower temperature when the Cu content was raised, except for the peak of the 1.5Cu sample, showing similar peak tem-perature with the 0Cu sample. The transition points for each specimen, including the peak temperatures and the onset temperatures of the endothermic peaks, regarded as the melting point, are shown in Fig. 7. It is worthy of
FIG. 4. Magnified microstructure of the specimens with high Cu con-tent: (a) 1.Cu and (b) 1.5Cu (Cu–Sn compounds are indicated by arrows).
FIG. 5. Variation in (a) area fraction of different phases and (b) in the secondary dendrite arm spacing (SDAS).
notice that there was an increase in the degree of under-cooling, the difference between peak temperatures of en-dothermic and exothermic peaks, when the Cu content increased from 0 to 1.0 wt%, but this tendency reverses when the Cu content exceeded 1.0 wt%.
Figure 8(a) shows that increase in Cu content led to a higher tensile strength. The total elongation [Fig. 8(b)] rose slightly with a higher Cu content while the uniform elongation remains almost constant.
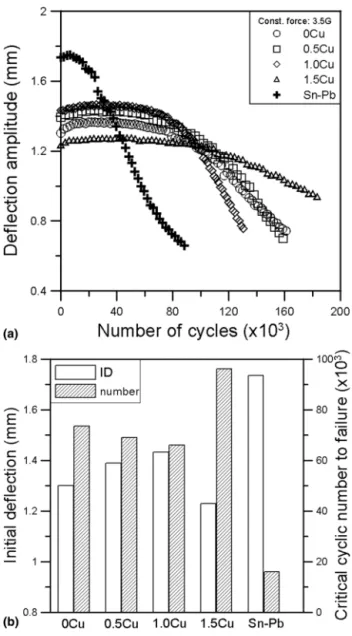
The dependence of deflection amplitude on the num-ber of vibration cycles (D-N curve) for a fixed vibration force of 3.5 G is shown in Fig. 9(a). The frequencies applied in each case are shown in Table I. The resonant frequency stayed at 75 Hz when the Cu content was 1.0 wt% or less. A Cu content of over 1.0 wt% results in
a slight increase in the resonant frequency. After a short initial ascending stage, the deflection amplitude re-mained nearly constant with increasing vibration cycles, but subsequently the deflection amplitude decreased with increasing vibration cycles due to the deviation of the actual vibration frequency from the resonant frequency caused by the inward propagation of major cracks.12,13
Therefore, the vibration life of a sample can be defined as the number of cycles at the beginning of descending deflection amplitude.
As illustrated in Fig. 9(b), initial deflection amplitude (ID) and decrease in vibration life (critical cyclic number to failure) increase with a higher Cu content, but these tendencies reverse when the Cu content exceeds 1.0 wt%. That is, the deflection amplitude in decreasing order was 1.0Cu, 0.5Cu, 0Cu, and 1.5Cu, which is in-versely proportional to the damping capacity (Table I) and vibration life [Fig. 9(b)]. This indicates that under constant-force conditions, a sample with a higher damping capacity possesses a lower initial deflection amplitude and a greater vibration fracture resistance. Compared to the commercial Sn–37Pb eutectic solder, Sn–Ag–Cu alloys investigated in this study possessed greater damping capacity and vibration life.
The crack propagation morphologies of the samples after vibration tests are shown in Fig. 10, revealing that the vibration-deformed structure dispersed on the sur-face, and the number of these white regions decreased when the Cu content was raised. It was also found that the distribution of the vibration-deformed zones did not significantly affect the propagation of the main crack.
FIG. 6. DSC analysis results: (a) upon heating and (b) upon cooling.
FIG. 7. Transition points and the degree of undercooling estimated from Fig. 6 (Tp-endothermic and Tp-exothermic are ultimate
tempera-ture value of the endothermic peaks upon heating and exothermic peaks upon cooling; Tonsetis the onset point of heat absorption upon
heating).
The crack tortuosity remained constant in all the speci-mens, except for the 1.5Cu sample, which had a rela-tively higher crack tortuosity (Table II). The magnified structure in Fig. 11 shows that a vibration-deformed structure was observed only within Sn-rich dendritic re-gions and exhibited a striated deformation pattern.
It is worthy of notice that in the 1.5Cu specimen bro-ken Cu6Sn5compound particles were found embedded in
the vibration-deformed regions in front of the crack tips (Fig. 12). These broken particles were also observed alongside the main crack (Fig. 13).
IV. DISCUSSION
It has been reported that the addition of Cu in Sn–Ag alloys results in a more homogeneous microstructure.14 Microstructural observation results (Figs. 3 and 5) also showed that with an increasing Cu content, the dendritic structure became finer. Additionally, Cu6Sn5 particles
could be found when the Cu content was 1.0 wt% or above.
TABLE I. Logarithmic decrements and resonant frequencies of the specimens.
Specimen ␦ Value Frequency (Hz)
0Cu 0.28 ± 0.01 75 ± 1
0.5Cu 0.25 ± 0.01 75 ± 1
1.0Cu 0.24 ± 0.01 75 ± 1
1.5Cu 0.29 ± 0.01 77 ± 1
FIG. 8. (a) Tensile strength and (b) elongation with respect to the Cu content (UTS, ultimate tensile strength; YS, yield strength; TE, total elongation; UE, uniform elongation).
FIG. 9. (a) D-N curves of the samples under a fixed vibration force of 3.5G and (b) initial deflection amplitude and vibration life estimated from (a).
It can be deduced that there are two kinds of binary eutectic structure; one is–Sn + Ag3Sn and the other is
–Sn + Cu6Sn5. According to the calculated liquidus
surface projection proposed by Tu et al.15and the ternary eutectic points, Sn–3.5Ag–0.9Cu and Sn–3.66Ag– 0.91Cu, reported in recent studies,16,17it can be deduced that the 1.0Cu specimen has the composition closest to the Sn–Ag–Cu ternary eutectic. Also, the 0.5Cu speci-men could be considered as hypoeutectic and the 1.5Cu is hypertectic with primary Cu6Sn5.
The Sn–Ag alloy with a eutectic composition of 3.5 wt% shows a hypoeutectic microstructure due to the unequilibrium crystallization feature.18,19 Also, Sn–Ag eutectic alloys exhibit a large undercooling phenom-enon,19measured in this study to be 18 °C. According to Fig. 7, the undercooling degree increases with an in-creased Cu content up to 1.0 wt%. This leads to finer Sn dendrites. Interestingly, the 1.5Cu specimen possesses a low undercooling, similar to that of the 0Cu specimen. This can be ascribed to the appearance of massive Cu6Sn5particles. In the case of the 1.0Cu specimens, the
Cu6Sn5embedded in the Sn–Ag3Sn eutectics is believed
to be the eutectic phase of the Sn–Cu6Sn5system.
How-ever, corresponding to the ternary phase diagram, the massive Cu6Sn5found within Sn dendrites of the 1.5Cu
samples can be regarded as the primary phase. These primary Cu6Sn5particles can serve as the heterogeneous
nucleation sites for Sn dendrites and lead to significant reduction in the undercooling and dendrite size.
Microstructural refinement and formation of massive Cu6Sn5caused by addition of Cu significantly affect the
vibration fracture properties of Sn–Ag–Cu alloys. As il-lustrated in Figs. 10 and 11, Sn–Ag and Sn–Ag–Cu al-loys, in which proeutectic Sn dendrites could be ob-served, exhibited a striated deformation pattern within the proeutectic Sn phase. The striated deformation of the Sn–rich phase is a characteristic feature that only appears under high-frequency repeated stress. Its formation is probably due to the extrusion-intrusion of the complex slip planes of the BCT Sn under cyclic stress.20Due to the unequilibrium crystallization feature and thus pro-duced off-eutectic structure, striated deformation occurs easily in the proeutectic Sn dendrites of Sn–Ag alloys. That is why Sn–Ag alloys possess better damping capac-ity than Sn–Pb alloys with lamellar eutectic structure.
Since larger grain promotes the occurrence of striated deformation, the refining of the Sn dendrites caused by Cu additions restrict the striated deformation and in-crease the resistance for dislocation to slip. Granato et al.21
suggested that vibrational energy can be absorbed
TABLE II. Crack tortuosity of the specimens (error value: ± 0.01).
Specimen Tortuosity
0Cu 1.12
0.5Cu 1.13
1.0Cu 1.10
1.5Cu 1.24
FIG. 10. Surface morphology of vibration-deformed specimens: (a) 0Cu, (b) 0.5Cu, (c) 1.0Cu, and (d) 1.5Cu.
and dissipated by dislocation motion. Easier dislocation movement will lead to a higher damping capacity and lower initial deflection amplitude. Therefore, as for the specimens with Cu content of 1.0 wt% or less, a higher Cu addition results in lower damping capacity, higher vibration deflection and thus reduced vibration life.
However, there was a dramatic increase in damping capacity and vibration fracture resistance when the Cu content was raised from 1.0 to 1.5 wt%. This is closely related to the primary Cu6Sn5 compounds discussed
above. In the case of the 1.5Cu specimen, striated defor-mation of Sn grain accompanies the breakup of brittle Cu6Sn5 within Sn dendrites. Broken Cu6Sn5 probably
contributes to higher internal friction between particle/Sn matrix and thus greater damping capacity. Figures 14(a) and 14(b) respectively reveal the relationships between Cu content, damping capacity and vibration life. As il-lustrated, when the Cu content was 1.0 wt% and below, striated deformation of Sn phase is the main mechanism for dissipation of vibration energy. On the other hand,
FIG. 11. (a) Vibration deformed structure with dendritic appearance. (b) Striated deformation of Sn dendrites in the case of the 0.5Cu specimen.
FIG. 12. Broken Cu–Sn compounds, indicated by arrows, in vibration deformed structure of the 1.5Cu specimen.
FIG. 13. (a,b) Broken Cu–Sn compounds alongside the main crack of the 1.5Cu specimen (indicated by arrows).
primary Cu6Sn5dominates when the Cu content exceeds
1.0 wt%. It can be also found that the vibration life has no relationship with the strength (Fig. 8). Figure 14(b) illustrates that vibration fracture resistance is propor-tional to the damping capacity and behaves inversely to initial deflection. From the change in the gradient of the two plotted lines, it can be deduced that a change in dominant damping mechanism also influences the vibra-tion life.
The breakup of massive Cu6Sn5 also affects crack
propagation path. The main crack tends to pass through
the broken compounds and results in subsequent higher crack tortuosity. As to other lead-free solder systems with massive intermetallics, our recent findings22 showed that primary Ag–Zn intermetallics of Sn–Zn-Ag alloys, located within Sn–Zn eutectic regions rather than proeutectic Sn dendrites, do not collapse when suffering vibration deformation. This implies that in addition to the difference in the nature of the intermetallics, the location of primary intermetallics may influence the vibration de-formation structure and subsequent properties.
V. SUMMARY AND CONCLUDING REMARKS Cu addition gives rise to microstructural changes in Sn–Ag eutectic alloys, namely, the refinement of Sn–rich dendrites and the appearance of Cu6Sn5 intermetallics.
When the Cu content was raised from 0 to 1.0 wt%, a decrease in dendrite size stunts the striated deformation of Sn phase and leads to reduced damping capacity and vibration fracture resistance. As for specimens with a higher Cu content (1.5 wt%), the primary Cu6Sn5within
proeutectic Sn dendrites collapses under vibration and results in higher damping capacity, tortuous crack propa-gation path, and thus greater vibration life.
ACKNOWLEDGMENT
This work was supported by the Chinese National Sci-ence Council (Contract No. NSC 92-2216-E-006-040), for which the authors are grateful.
REFERENCES
1. S.S. Kang and A.K. Sarkhel: Lead free solders for electronic pack-aging. J. Electron. Mater. 23, 701 (1994).
2. E. Bradley and J. Hranisavljevic: Characterization of the melting and wetting of Sn–Ag–X solders. IEEE Trans. Electron. Packag.
Manuf. 24, 255 (2001).
3. I. Shohji, T. Yoshida, T. Takahashi, and S. Hioki: Tensile prop-erties of Sn–3.5Ag and Sn–3.5Ag–0.75Cu lead-free solders.
Mater. Trans. 43, 1854 (2002).
4. Q.J. Yang, H.L.J. Pang, Z.P. Wang, G.H. Lim, F.F. Yap, and R.M. Lin: Vibration reliability characterization of PBGA assem-blies. Microelectronic Reliability 40, 1097 (2000).
5. Y. Zhao, C. Basaran, A. Cartwright, and T. Dishongh: Inelastic behavior of microelectronics solder joints under concurrent vibra-tion and thermal cycling. In The 7th Intersociety Conference on
Thermal and Thermechanical Phenomena in Electronic Systems,
edited by G.B. Kromann, J.R. Culham, and K. Ramakrishna. (IEEE, Piscataway, NJ, 2000), p. 349.
6. J.M. Song, T.S. Lui, L.H. Chen, and T.Y. Tsai: Resonant vibration behavior of lead-free solders. J. Electron. Mater. 32, 1501 (2003). 7. C.M. Chuang, T.S. Lui, and L.H. Chen: The effect of morphology coarseness on vibration fracture behavior of Pb-Sn solders under various aging conditions. Mater. Trans. 41, 656 (2000). 8. C.M. Chuang, T.S. Lui, and L.H. Chen: Effect of lead content on
vibration fracture behavior of Pb–Sn eutectic solder. J. Mater.
Res. 16, 2644 (2001).
9. C.M. Chuang, T.S. Lui, and L.H. Chen: The characteristics of FIG. 14. (a) Damping capacity and initial deflection against Cu
con-tent. (b) Vibration life with the function of damping capacity and initial deflection.
vibration fracture of Pb–Sn and lead-free Sn–Zn eutectic solders.
J. Electron. Mater. 30, 1232 (2001).
10. C.M. Chuang, T.S. Lui, L.H. Chen, and T.M. Yin: Vibration-fracture resistance of Sn–Pb and Sn–Ag eutectic solders. Mater.
Trans. 42, 2064 (2001).
11. R.F. Steidel, Jr.: An Introduction to Mechanical Vibrations, 3rd ed. (John Wiley & Sons, New York, 1989), p. 169.
12. D.S. Jiang, T.S. Lui, and L.H. Chen: Crack propagation behavior of A356 aluminum alloy under resonant vibration. Scripta Mater.
36,15 (1997).
13. D.S. Jiang, T.S. Lui, and L.H. Chen: Effect of aging on the crack propagation behavior of A356 alloy under resonant vibration.
Mater. Trans. 41, 499 (2000).
14. Y. Kariya and M. Otsuka: Mechanical fatigue characteristics of Sn–3.5Ag–X (X⳱ Bi, Cu, Zn and In) solder alloys. J. Electron.
Mater. 27, 1229 (1998).
15. K. Zeng and K.N. Tu: Six cases of reliability study of Pb-free solder joints in electronic packaging technology. Mater. Sci. Eng.
R38,55 (2002).
16. M.E. Loomans and M.E. Fine: Tin-silver-copper eutectic tempera-ture and composition. Metall. Mater. Trans. A 31A, 1155 (2000). 17. K.W. Moon, W.J. Boettinger, U.R. Kattner, F.S. Biancaniello, and C.A. Handwerker: Experimental and thermodynamic assessment of Sn–Ag–Cu solder alloys. J. Electron. Mater. 29, 1122 (2000). 18. Z.G. Chen, Y.W. Shi, Z.D. Xia, and Y.F. Yan: Study on the microstructure of a novel lead-free solder alloy SnAgCu-RE and its soldered joints. J. Electron. Mater. 31, 1122 (2002). 19. K.S. Kim, S.H. Huh, and K. Suganuma: Effects of cooling speed
on microstructure and tensile properties of Sn–Ag–Cu alloys.
Mater. Sci. Eng. A 333, 106 (2002).
20. J.S. Koehler: Plastic Deformation in Crystallines Solids (Mellon Institute, Pittsburgh, PA, 1950), p. 216.
21. A. Granato and K. Lucke: Theory of mechanical damping due to dislocation. J. App. Phys. 27, 583 (1956).
22. J.M. Song, G.F. Lan, T.S. Lui, and L.H. Chen: Resonant vibration behavior of Sn–Zn-Ag solder alloys. J. Alloys Compd. (in press).