Design and Implementation of an FPGA-Based Digital Control IC of Maximum-Power- Point-Tracking Charger for Vertical-Axis Wind Turbine Generators
Ming-Fa Tsai,
Member IEEEWei-Chieh Hsu Tai-Wei Wu Jui-Kum Wang
Minghsin University of Science and Technology 1 Hsin Feng,
Hsinchu, Taiwan, ROC [email protected] Abstract -- This paper presents the design of an FPGA-
based digital control IC of maximum-power-point-tracking (MPPT) charger for vertical-axis wind turbine generators. The output of the charger can be connected to a 48V battery to supply power to a DC load or an electric vehicle drive system. A novel MPPT scheme, which is the mixing of the conventional perturbation and observation method and a linear approximation method, to get the maximum output power of the wind turbine generation system with faster tracking speed is proposed. The simulation model of wind-turbine generation is built in PSIM simulation software tool and used to analyze the converter and MPPT system operation under different wind speed conditions. Based on the simulation model, the digital control IC of the MPPT charger is then designed.
The digital MPPT control IC has been designed by using VHDL hardware description language. The simulation models for the MPPT control IC have also been constructed and verified by using Simulink, ModelSim, and PSIM cosimulation tools. The designed circuit has been implemented on an Altera Cyclone FPGA logic device. Simulation and experimental results are shown to verify the viability of the proposed control IC of the MPPT charger.
Index Terms--
v
ertical-axis wind turbine generators, MPPT, FPGA digital control, perturbation and observe method, linear approximation method.I. NOMENCLATURE
Pw: output power of a wind turbine generator.
CP: efficiency of the wind-turbine.
ρ: air density.
R: radius of the wind turbine blade.
vw: wind speed.
λ: tip speed ratio.
ω: wind turbine rotation speed.
Vs: input voltage of the boost converter Is: input current of the boost converter V : output voltage of the boost converter o
D: duty cycle of the boost converter switch ωe: electritic angular frequency of the PMSG
φ: rotor flux of the PMSG
FPGA-Based MPPT Controller
Boost Converter
(PWM)
48V
Is
Vs
C1 S C2
L D
Three-Phase Diode Rectifier Vertical-Axis
Wind-Turbine Generator
Vo
+
−
FPGA-Based MPPT Controller
Boost Converter
(PWM)
48V
Is
Vs
C1 S C2
L D
Three-Phase Diode Rectifier Vertical-Axis
Wind-Turbine Generator
Vo
+
−
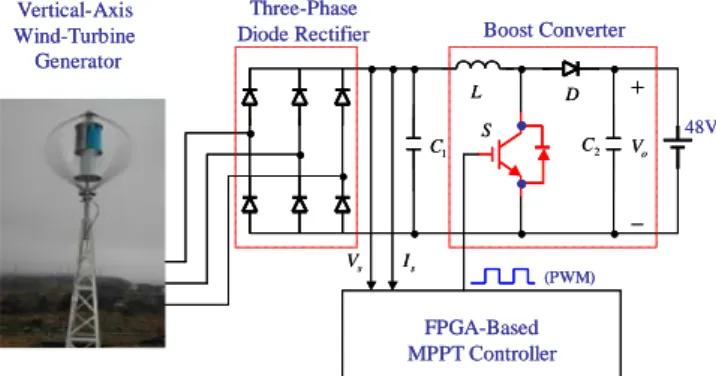
Fig. 1 The system architecture of the MPPT charger for a vertical-axis wind- turbine generator.
II. INTRODUCTION
The small wind-turbine power generation system with the output power less than 10 kW, which includes horizontal- axis wind turbine (HAWT) and vertical-axis wind turbine (VAWT) and can be installed in some areas of hills, parks, and cities due to their flexibility, is one of the progressive research and development fields in renewable energy. Small VAWT generating system can be installed even on vehicles due to its no need of yawing control. It has been reported that the US market for small wind turbines grew 78% in 2008 with an additional 17.3 MW installed capacity [1]. So, it is important for the small wind turbine generators to have low cost, high reliability as well as high efficiency. To meet these requirements, various maximum-power-point-tracking (MPPT) control schemes, including perturbation and observation algorithm, power mapping technique, have been reported [2]-[7].
This paper presents the design of an FPGA-based digital control IC of maximum-power-point-tracking (MPPT) charger for vertical- axis wind turbine generators. A novel MPPT control scheme, which is the mixing of the conventional perturbation and observation algorithm and a linear approximation method [8], to get the maximum output power of the wind turbine generation system with faster tracking speed is proposed.
Fig. 1 shows the system architecture of the proposed wind MPPT charger which consists of a 300W vertical-axis wind turbine generator, a three-phase diode rectifier, a boost converter, and an FPGA-based MPPT controller. The output of the charger can be connected to a 48V battery to supply power to a DC load or an electric vehicle drive system.
0 CP
λ 0
Fig. 2 The curve of the wind-turbine efficiency versus to the tip speed ratio
Maximum-Power-Point-Curve
0
ω
1
vw
1 2 3
4 w w w
w v v v
v > > >
2
vw vw3 vw4
Pw
0
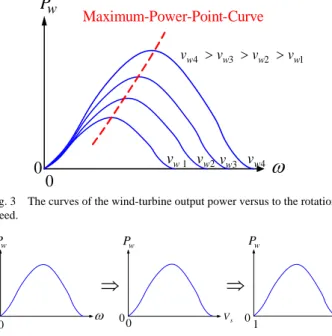
Fig. 3 The curves of the wind-turbine output power versus to the rotation speed.
ω Vs
00 Pw
00
⇒
Pw
1 D
0 0
⇒
Pw
Fig. 4 The curves of the wind-turbine output power versus to the rotation speed, generator output voltage, and the boost converter switch duty cycle.
III. THE PROPOSED MPPTCONTROL SCHEME
The output powerP of a wind turbine generator can be w expressed as [3]
1 2 3
w 2 p w
P = C ρπR v (1) where CP is the efficiency of the wind-turbine extracted power from the wind, ρis the air density, R is the radius of the wind turbine blade, and vwis the wind speed. The power efficiency,CP,is a nonlinear curve function of the tip speed ratio,λ, as shown in Fig. 2. The tip speed ratio,λ,is defined as
w
R v
λ= ω (2)
where ω is the wind turbine rotation speed. Because the radius, R, of the wind turbine blade is fixed and the air density, ρ,is also assumed to be a constant, from (1) we can see that the wind turbine output power is linearly relative to the power efficiency in a constant wind speed. Thus the wind-turbine output power curves with respect to the wind
turbine rotation speed at different wind speeds can be shown in Fig. 3. Thus, for different wind speed conditions, we can extract the maximum output power of the wind turbine by controlling the wind turbine rotation speed, which is also linearly relative to the boost converter duty cycle and is d e s c r i b e d a s f o l l o w s . The wind turbine of the system is DS300 [9], in which the generator is a permanent magnet synchronous generator (PMSG). Because the PMSG generator has constant rotor flux,φ,there also exists some linear relationship between the angular frequency,ωe,and the magnitude of generator output voltage, Vs, which is also the input voltage of the boost converter. The relationship can be given by
1 2
s e
V kφ k
ω = = (3) where
k1 is a constant gain and k2 is also a constant for the constant φ. Further, the relationship between the generator angular frequency and the wind turbine rotation speed is given by
e 2
ω = Pω (4)
where P is the pole number of the PMSG generator. So, from (3) and (4) we can obtain
2 .
s 2
V =Pkω (5)
On the other hand, the output voltage Vo and the input voltage V of the boost converter have the following s relationship:
1 1
o s
V
V = D
− (6) where D is the duty cycle of the converter switch. Since the output voltage usually rises slowing due to charging, the output voltage is assumed constant. Therefore, the input voltage V has also has a linear relationship with the duty s cycle D and is given by
1 1 2 .
2
s
o o
V Pk
D= −V = − V ω (7)
Therefore, the wind turbine output power curve with respect to converter duty cycle can be shown in Fig. 4. Then, we can get the maximum output power of the wind turbine by controlling the boost converter switch duty cycle. A conventional perturbation and observation (P&O) MPPT algorithm to get the maximum output power of the wind turbine by controlling the duty cycle is shown in Fig. 5. But its tracking speed is usually slow.
Pn
+1
Pn
(b)Pn+1>Pn&Dn+1<Dn
(d)
n n n
n P D D
P+1< & +1<
Pn +1 Pn
(a)
n n n
n P D D
P+1> & +1>
+1 Pn
Pn
n n n
n P D D
P+1< & +1>
(c)
+1
Pn
Pn
Pw
D D
D D
decrease D
decrease D
Pw Pw
Pw
0
0 0
0 0
0 0
0 1 1
1 1
increase D increase D
Fig. 5 The maximum power point searching of the conventional perturbation and observation (P&O) method
Pw
1
vw vw2 vw3 vw4
4 3 2 1
w w w w
v >v >v >v
A
F
D E C
B D
D1 D2 D3 D4 P1
P2 P3 P4
0
Fig. 6 Linear approximation MPPT method
1
vw vw2 vw3 vw4
1 2 3
4 w w w
w v v v
v > > >
perturbation and observation algorithm
linear approximation
method
0
Pw
D Maximum-Power-
Point-Curve linear
approximation method
Fig 7. Mixing method of the linear approximation and the P & O method.
It is interesting to see that the maximum point of the power curve with different wind speed can be approximated by a linear line as the dash line shown in Fig. 6. We can speed up the tracking speed with the so called linear approximation method by following point A-B-C-D-E-F assuming that the wind speed is at vw2. In this case, only five steps are used to get the maximum point of the output power.
start Initilization
PWM output Read Calculate
s,s
V I
1
Pn+
In the range of the Envelope?
Yes
No
Linear Approximation Perturbation and
Observation
1, 1
n n n n
P=P+ D =D+ start Initilization
PWM output Read Calculate
s,s
V I
1
Pn+
In the range of the Envelope?
Yes
No
Linear Approximation Perturbation and
Observation
1, 1
n n n n
P=P+ D =D+
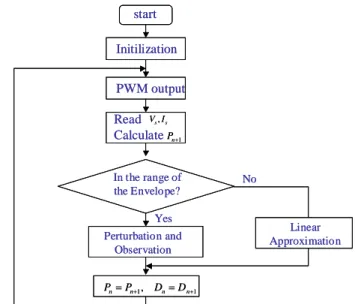
Fig. 8. Flow chart for the proposed MPPT control scheme.
TABLEI
Look-up table for the wind turbine power efficiency versus tip speed ratio
λ CP λ
CP
0.28 0.05 2.09 0.38 0.66 0.12 2.20 0.40 0.88 0.16 2.25 0.37 1.10 0.20 2.43 0.31 1.38 0.25 2.71 0.22 1.60 0.29 2.90 0.14 1.70 0.32 3.09 0.05 1.93 0.35 3.22 0.02
Although the linear approximation method can simplify the MPPT tracking algorithm with faster tracking speed, the tracking performance may be affected if the maximum power curve is not pre-measured correctly. In order to improve the performance, the authors propose a novel MPPT scheme which is the mixing of the above both methods. we can use an envelope around the approximated linear line to define a range for determining which method to be used. As shown in Fig. 7. If the power point is outside the envelope range, then the linear approximation method is used. Otherwise the conventional perturbation and observation method is used.
The flow chart of the mixing MPPT control scheme is shown in Fig. 8.
IV. SIMULATION
The simulation system of wind-turbine generation is built in PSIM simulation software tool and used to analyze the converter and MPPT system operation under different wind speed conditions. Table I shows the look-up table built in the simulation system for verification the MPPT control
Wind turbine simulation block
look-up table
w
R v λ= ω ω π
2
×60
= N
2 3
1
wind 2 w
P = ρπR v
w wind P
P =P ×C Pw
T= ω
PMSG block
vw R
(a)
Wind turbine generator block
Three-phase diode rectifier and boost circuit
DLL file link block Vs Is
(b)
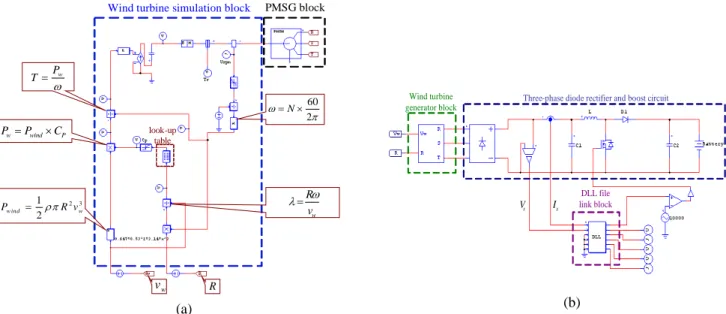
Fig. 9. Simulation blocks constructed by using PSIM. (a) wind turbine generator block, (b) The overall simulation system.
Tracking Regulation
Fig. 10. Simulation result of the conventional P&O MPPT method
tracking Regulation
tracking Regulation
Fig. 11. Simulation result of the proposed MPPT method.
7m/s 10m/s 15m/s
Fig. 12. Simulation result of the proposed MPPT control algorithm with the wind speed sudden change.
algorithm. As shown in Fig. 9, given the wind speed,vw,and radius of the wind turbine blade, R, the wind turbine generator block can generate the three-phase voltage signals, which are connected to the diode full-bridge rectifier and boost converter circuit. The MPPT control algorithm is constructed in the DLL linked block, as shown in Fig. 9(b), which is written in C programming language. Fig. 10 and Fig.
11 show the simulation results at the wind speed of 10 m/s by using the conventional P&O method and the proposed MPPT method, respectively. It can be seen that the P&O method takes about 9 sec., but the proposed method only takes about 3 sec. to reach the maximum power point. Fig. 12 shows the tracking performance of the proposed method with the sudden change of the wind speed from 7 m/s to 10 m/s and from 10 m/s to 15 m/s at the time of 10 sec. and 15 sec., respectively.
Modelsim 呼叫方塊
ModelSim連結方塊
Psim連結方塊
PSIM block for the converter MPPT Control IC
Block Linked with ModelSim command BlockModelsim 呼叫方塊
ModelSim連結方塊
Psim連結方塊
PSIM block for the converter MPPT Control IC
Block Linked with ModelSim command Block
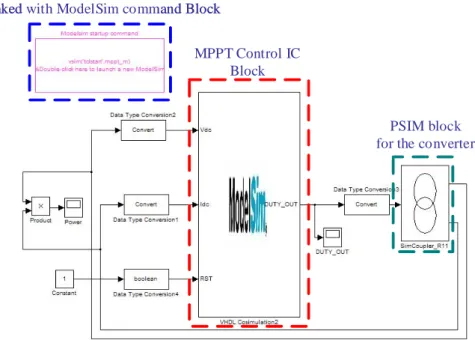
Fig. 13. Simulation block in the Simulink, ModelSim, and PowerSIM cosimulation environment
Power (W)
T (sec)
(a)
T (sec) DUTY_OUT
(b)
Fig. 14. Simulation result of tracking performance in the wind speed of 10 m/s in the Simulink, ModelSim, and PowerSIM cosimulation environment. (a) winturbine output power, (b) the boost converter switch duty cycle
V. MPPTCONTROL ICDESIGN AND EXPERIMENTAL
RESULTS
The digital MPPT control IC is then designed by transferring the software C programming language in the DLL block in Fig. 9(b) into VHDL hardware description language. For verification of the MPPT control IC function, the overall simulation models in the Simulink, ModelSim, and PSIM cosimulation environment is shown in Fig. 13. The simulation result at the wind speed of 10 m/s is shown in Fig.
14. As can be seen, the output power about 140W is obtained, which is consistent with the simulation result shown in Fig.
11.
0 10 20 30 40 50 60 70 80 90 100
0 0.1 0.2 0.3 0.4 0.5 0.6 0.7 0.8 0.9
1 Duty
Power(W)
70V 85V 110V
Fig. 15 Experimental result to get the maximum-power-point-curve.
After the simulation test, it is desired to get the power curve of the employed DS300 vertical-axis wind turbine generator with respect to the duty cycle and then build in the look-up table of the MPPT control IC for experimental test.
the experimental measurements to obtain the power curve of the wind turbine have been done and results are shown in Fig.
15. In the measurements, the authors used an industrial fan to provide the wind. The wind speed can be controlled by the output voltage of a tunable transformer. The designed MPPT controller circuit is then downloaded to an Altera Cyclone FPGA logic device to verify the system performance. The wind-turbine MPPT charger system was then implemented on an electric vehicle, as shown in Fig. 16, and moved outside to a wind field for outdoor tests. Fig. 17(a) shows the output power of the charger with respect to the wind turbine rotation speed. Fig. 17(b) shows the output power of the
Fig. 16 Moving the wind turbine to a wind field for outdoor test.
0 50
100 150 200 250 300 350
0 100 200 300 400 500 600 700 N(rpm)
Power(W)
0 50 100 150 200 250 300 350
0 100 200 300 400 500 600 700 N(rpm)
Power(W))
(a)
0 50 100 150 200 250
0 2 4 6 8 10 12Vw(m/s)
Power(W)
(b)
Fig. 17 Experimental Results for the 300W wind turbine generator. (a) output power to wind turbine rotation speed, (b) output power to the wind speed.
charger with respect to the wind speed. It can be seen that the output power is 200W at the wind speed of 11.5 m/s and at the wind turbine rotation speed of 680 RPM. The rated output power 300W of the DS300 wind turbine generator can be expected at the wind speed of 15 m/s.
VI. CONCLUSIONS
In this work the design and implementation of an FPGA- based MPPT charger control IC for vertical-axis wind turbine generators has been done. Because the maximum power point may move abruptly due to fast wind speed change, the authors proposed a novel MPPT method, which is the mixing of the conventional perturbation and observation method and a linear approximation method, to get the maximum output power of the wind turbine generation system with much faster tracking performance. The simulation system of wind- turbine generation is built in PSIM simulation software tool and used to analyze the MPPT charger system operation under different wind speed conditions.
The digital control IC circuit has been designed using VHDL hardware description language. The simulation models for the MPPT controller have also been constructed and verified by using Simulink, ModelSim, and PSIM cosimulation tools. The designed control circuit has been implemented on an Altera Cyclone FPGA logic device.
Simulation and experimental results are shown to verify the tracking performance of the proposed system.
This work can be not only applied to a fixed wind-turbine charging station, but also to an electric vehicle equipped with the vertical-axis wind-turbine generator, so that the battery of the vehicle drive system can be charged while the vehicle is moving.
ACKNOWLEDGMENT
The authors gratefully thank HiEnergy Technology Corp.
and Power General Corp. under the Project No. of NSC95- 2622-E-159-007-CC3 and the Project No. of Must-97-EE-02, respectively.
REFERENCES
[1] American Wind Energy Association, AWEA small wind turbine global market study: 2009
[2] S. Wang, Z. Qi, “State-space averaging modeling and analysis of disturbance injection method of MPPT for small wind turbine generating systems,” IEEE Power and Energy Engineering Conference, APPEEC, Asia-Pacific, 27-31, March, 2009.
[3] K. tan and S. Islam, “Optimum control strategies in energy conversion of PMSG wind turbine system without mechanical sensors,” IEEE Trans Energy Conversion, vol. 19, no. 2, pp. 392-399, June, 2004.
[4] N. Yamamura, M. Ishida, and T. Hori, “A simple wind power generating system with permanent magnet type synchronous generator,” IEEE PEDS’99, vol. 2, pp. 849-854, Hong Kong, July 27- 29, 1999.
[5] Y. Q. Jia, Z. Q. Yang, and B, G. Cao, “ A new maximum power point tracking control scheme for wind generators,” POWERCON 2002, vol.
1, pp. 144-148, Kunming, China Oct. 13-17, 2002.
[6] N. Mutoh and A. Nagasawa, “ A maximum power point tracking control method suitable for compact wind power generators,” IEEE PESC’06, June 18-22, pp. 1-7, 2006.
[7] R. J. Wai, C. Y. Lin, and Y. R. Chang, “Novel maximum-power- extraction algorithm for PMSG wind generation system,” IET Electric Power Applications, vol. 1, no. 2, pp. 275-283, March 2007.
[8] Ching-Tsai Pan, Jeng-Yue Chen, Chin-Peng Chu, and Yi-Shuo Huang, ”A fast maximum power point tracker for photovoltaic power system,” Proceedings of IECON’99, vol. 1, pp. 390-393, 1999.
[9] HiEenergy Technology Corp., http://ww.hi-energy.com.tw