Shau-Lian Wong · Chung-Wei Chen · Meng-Yuan Huang · Jen-Hsien Weng
Relationship between photosynthetic CO
2uptake rate and electron transport rate in two C
4perrenial grasses under different nitrogen fertilization, light and temperature conditions
(pink text: revised) S.-L. Wong · C.-W. Chen
Division of Botany, Endemic Species Research Institute, Nantou, Taiwan
M.-Y. Huang
Biodiversity Research Center, Academia Sinica, Taipei, Taiwan
J.-H. Weng ( )
Graduate Institute of Ecology and Evolutionary Biology, China Medical University, Taichung, Taiwan. e-mail: [email protected]
Tel.: Tel: +886-4-22053366 #8102; Fax: +886-4- 2071507 1
2 3 4 5 6 7 8 9 10 11 12 13 14 15
Abstract We examined the feasibility of using chlorophyll fluorescence to estimate
CO2 exchange (A) of C4 perennial grasses under different environmental as well as physiologic conditions by using Pennisetum purpureum and Miscanthus floridulus, capable of year-round growth, to determine the association of electron transport rate (ETR) and A. The grasses were fertilized with 3 levels of nitrogen, and measurement involved the top 2 fully expanded leaves, with chlorophyll content 0.18–0.55 g m-2. Chlorophyll fluorescence, CO2 and H2O exchange were measured simultaneously at 4 seasonal temperatures (30–15 °C, Sept.–Jan.), 6 levels of photosynthetic photon flux density (PPFD) (0–2,000 mol m–2 s–1) and 2 levels of relative humidity [60% (15–30
°C) and 40% (30 °C alone)]. Variables were recorded when A was stable. Most leaves with high chlorophyll content showed high A at the same PPFD and seasonal temperature. Despite a broad range of A obtained because of both stomatal and non- stomatal factors, ETR was still highly correlated linearly with net photosynthetic rates, when combining data for the same species for analysis. Thus, ETR could be used to assess the dynamic A of C4 perennial species through different seasons, even under varied light intensity, seasonal temperature, humidity, nitrogen fertilization and phenological stage.
Keywords: C4 · electron transport rate · light intensity · nitrogen fertilization · photosynthetic rate · seasonal temperature.
Abbreviations A CO2 fixation α Leaf absorption
Ca Ambient CO2 concentration 16
17 18 19 20 21 22 23 24 25 26 27 28 29 30 31 32 33 34 35 36 37 38 39 40 41
Ci Intercellular CO2 concentration ETR Electron transport rate
f The fraction of absorbed quanta used by PSII.
ФCO2 Photosynthetic rate per absorbed quantum ФPSII Photosystem II efficiency
gs Stomatal conductance N Nitrogen
PN Net photosynthetic rate
PPFD Photosynthetic photon flux density PSII Photosystem II
RH Relative humidity.
Introduction
Photosynthesis, one of the major determinants of biomass production and terrestrial carbon budgets, is influenced by many environmental and physiological factors (Berry and Downton 1982). Understanding the biomass production of crops and vegetation under different conditions requires monitoring spatial and temporal variations in photosynthetic capacity. However, the traditional measurement of photosynthetic capacity, especially in the field, is limited by cumbersome techniques used to measure leaf gas exchange.
Recently, chlorophyll fluorescence quenching analysis has been found to be a fast, simple, non-invasive, and reliable method to assess changes in photosystem II (PSII) function under different environmental and physiological conditions (Roháček and Barták 1999; Maxwell and Johnson 2000). Among chlorophyll fluorescence variables, electron transport rate (ETR), calculated from the product of PSII efficiency and absorbed light, expresses the relative rate of electron transport through PSII (Krall and Edwards 1992).
42 43 44 45 46 47 48 49 50 51 52 53 54 55 56 57 58 59 60 61 62 63 64 65 66 67 68
Electron flow through PSII is consumed mainly by carbon assimilation (Krall and Edwards 1992; Oberhuber and Edwards 1993). When CO2 fixation (A) is inhibited by certain environmental and physiological stresses, leaves may downregulate their PSII efficiency (ФPSII), mainly through xanthophyll-dependent non-photochemical quenching to avoid damage caused by excess absorbed energy (Demmig-Adams et al.
1996; Kato et al. 2003; Adams et al. 2004). Thus, a linear correlation between ETR and A can be obtained for many C3 and C4 plants. However, in C3
plants, both CO2 fixation and photorespiration are major sinks for electrons from PSII.
Therefore, with increased photorespiration, the ratio of ETR to A [or ФPSII to photosynthetic rate per absorbed quantum (ФCO2)] greatly increases with decreasing CO2 partial pressure (Krall and Edwards 1990, Cornic and Briantais 1991) or increasing temperature (Oberhuber and Edwards 1993; D'Ambrosio et al. 2006; Wong et al. 2012) as well as O2 partial pressure (D'Ambrosio et al. 2006; Ripley et al. 2007).
In C4 plants, photorespiration is restricted,
4
44444444444444444444444444444444444444444444444444444444444444444444
4444444444444444444444444444444444444444444444444444444444. ,,absorbed photons may be mostly used to drive the CO2 fixation (Krall and Edwards 1992).
Numerous studies have concluded a strong linear relationship between ETR and A.
This relationship appears to be stable under many conditions (Edwards and Baker 1993), even when merging data from different genotypes (Earl and Tollenaar 1998) or with differences in both CO2 partial pressure and temperature (Kakani et al. 2008) across a broad range of light intensity. However, the ETR–A relationships in C4
species may be complicated because of uncertain ETR based on fluorescence measurements: chlorophyll fluorescence may occur from both the mesophyll and 69
70 71 72 73 74 75 76 77 78 79 80 81 82 83 84 85 86 87 88 89 90 91 92 93
bundle sheath cells (Romanowskaa et al. 2006). Moreover, in addition to A and photorespiration, electrons from PSII have several energy sinks, such as the water–
water cycle (Asada 1999) and the cyclic electron flow within PSII (Miyake and Okamura 2003) as well as nitrogen (N) assimilation (Robinson 1990). Furthermore, CO2 leakage from bundle sheath cells is another possibility for electron usage in C4 plants and is influenced by many conditions (Kubien et al. 2003; Naidu and Long 2004; Yin et al. 2011b). Thus, the ETR–A (or
ФPSII–ФCO2) relationship of C4 plants may vary by genotype (D'Ambrosio et al. 2003), leaf N (Khamis et al. 1990), growth season or growth conditions (Earl and Tollenaar 1998; Fryer et al. 1998; Baerlocher et al. 2004; Farage et al. 2006) or even conditions during measurement (Earl and Tollenaar 1998).
Leaf N is an important factor affecting photosynthesis. Many C4 and C3 species show a strong positive correlation between A and leaf N content (Weng and Chen 1987; Makino and Osmond 1991; Weng and Hsu 2001; Lawlor 2002). Most leaf N is allocated to chloroplasts (Makino and Osmond 1991; Lawlor 2002), and lower A under limited N is often attributed to reduced chlorophyll content and enzyme activities (Verhoeven et al. 1997; Lawlor 2002; Cheng 2003; Huang et al. 2004;
Netto et al. 2005; Zhao et al. 2005), which leads to decreased light absorption and light utilization by leaves (Verhoeven et al. 1997; Cheng et al. 2001). N deficiency also results in significant decreases in ФPSII (Cheng et al.
2001) and increases the electron flux to alternative sinks (Kumagai et al. 2010). However, for C4 plants, the effect of leaf N on the ETR–A (or ФPSII–ФCO2) relationship has not been studied in detail. Khamis et al. (1990) noted a small decrease in ФCO2 at any given ФPSII in N-limited maize leaves. However, Cheng et al. (2001) noted that when leaves of apple (a C3 plant) were measured under non- 94
95 96 97 98 99 100 101 102 103 104 105 106 107 108 109 110 111 112 113 114 115 116 117 118
photorespiratory conditions and quantum yield was expressed on an absorbed PPFD basis, a close ФPSII–ФCO2 relationship could be found for leaves with a wide range of N content.
Eco-physiological studies require knowledge of photosynthetic characteristics of plants at different environmental and physiological conditions. Under well-water conditions, light intensity, temperature and leaf N status are important factors in photosynthesis. Chlorophyll fluorescence measurement is a fast and simple method for estimating photosynthesis. However, for C4 plants, the combined effects of leaf N, light intensity and seasonal temperature on the ETR–A relationship is not clear, especially for subtropical perennial C4 grasses. In addition, stomatal conductance (gs) is another important limiting factor in photosynthesis. Stomata prevent water loss and facilitate CO2 diffusion to mesophyll cells. To optimize water-use efficiency, gs and A may be closely related under many conditions, including changing light intensity (D’Ambrosio et al. 2003; Huxman and Monson 2003), temperature (Pittermann and Sage 2000, 2001) and leaf N status (Weng and Hsu 2001; Mohotti and Lawlor 2002).
In this study, we used two perennial C4 grasses to elucidate the ETR–A relationship in varied seasons under different seasonal temperature, photosynthetic photon flux density (PPFD), and relative humidity. We also discuss the effects of stomatal and non-stomatal limitations.
Materials and methods Plant materials
Two perennial C4 plants, Pennisetum purpureum (cv. A146), a cultivated herbage, and Miscanthus floridulus, a wild grass, were used as materials. The former was
propagated from cuttings, and the latter was collected from the lowlands of central Taiwan. Plants were potted (38 cm-diameter) in a mixture of soil : vermiculite : sand 119
120 121 122 123 124 125 126 127 128 129 130 131 132 133 134 135 136 137 138 139 140 141 142 143 144
(1:1:1), and placed outdoors to receive regular water and full sunlight in the nursery of the Endemic Species Research Institute, Chichi Township, Nantou County, Taiwan (23°49′N, 120°48′E, 250 m a.s.l.). To obtain leaf samples with different photosynthetic capacity, 0, 1 and 2 g N fertilizer was applied to pots at 4 and 2 weeks before measurement. During the growth period (May 2010−Jan. 2011), the mean monthly temperature was 26.6−28.9°C (May−Aug.) and 28.5−14.8°C (Sept.−Jan.) (data from the Endemic Species Research Institute).
Measurements
Measurements were carried out from September 2010 to January 2011. Pot-grown plants were exposed to outdoor sunlight before measurement. We measured the top 2 fully expanded leaves with different chlorophyll content [0.18–0.55 g m–2, determined by use of a chlorophyll meter (SPAD 502, Minolta Camera Co., Osaka, Japan)]. From 9:30 to 15:00 h, photosynthesis, stomatal conductance and chlorophyll fluorescence were measured by use of a portable, open-flow gas exchange system (LI-6400, LI- COR, Lincoln, NE, USA) with an integrated fluorescence chamber head (LI-6400-40)
stepwise from high to low levels (2,000; 1,200; 800, 400, 200 and 0 μmol m–2 s–1) of PPFD. The values of A, gs, ratio of intercellular to atmospheric CO2 concentration (Ci/Ca) and chlorophyll fluorescence variables were recorded when A was stable. Leaf temperature was maintained at 15, 20, 25 and 30 °C.
Measurements were taken in the season with the climate temperature close to the leaf temperature. The 30°C measurement was in September to October and the 25 °C, 20 °C and 15 °C measurements were in November, December and January, respectively. Throughout the measurements, CO2 concentration in the chamber was kept at 350–400 μmol mol–1 (no control). Relative humidity (RH) of air entering the 145
146 147 148 149 150 151 152 153 154 155 156 157 158 159 160 161 162 163 164 165 166 167 168 169
chamber was 60% (for all 4 temperatures) and 40% (for 30 °C only), which was controlled by passing temperature-controlled water.
The actual PSII efficiency (∆F/Fm’) was calculated as (Fm’–F)/Fm’. F and Fm’are the actual and maximal levels of fluorescence during illumination, respectively; the former was determined under each PPFD level, and the latter was determined by applying a 0.8-s pulse of saturating flashes of approximately 6,000 μmol quanta m–2 s–
1. ETR was calculated as ΦPSII×PPFD×α×f (Maxwell and Johnson 2000). The variables α and farethe fractions of incident PPFD absorbed by the leaf and absorbed PPFD used by PSII, respectively. We used the mean leaf absorption of 0.84 for green leaves (Björkman and Demmig 1987; see Discussion section), and 0.4 for f of C4
plants (Yin and Struik 2012).
Statistical analysis
We measured 5 to 10 (usually 6–7, Fig. 3) leaves from 4 pots for each species. Data were analyzed by linear regression by use of Sigma Plot v10.0.
Results
We used P. purpureum measured at 30 °C and 15 °C and 60% RH as an example for illustrating the light-response curves of PN, gs, ETR and Ci/Ca (Figs. 1 and 2).
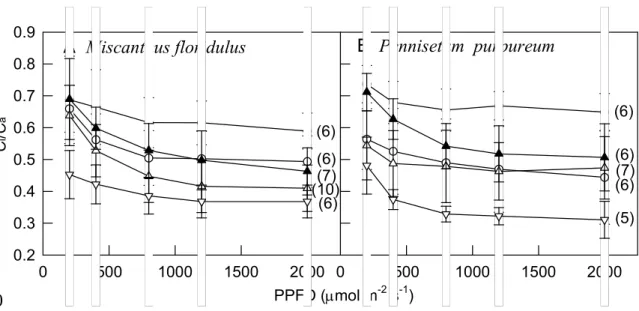
Typically, PN, gs and ETR showed a hyperbolic increase with increasing PPFD, and leaves with higher chlorophyll content always had higher PN, gs and ETR, the closest relation being between ETR and PN. PN, gs, and ETR values were lower at low than high seasonal temperature in all leaves. The Ci/Ca for both species decreased with increasing PPFD and stabilized somewhat at about 1,200 μmol m–2 s–1 PPFD with most treatments (Fig. 3). However, as compared with a given level of PPFD, low temperature and high RH produced high Ci/Ca for both species.
170 171 172 173 174 175 176 177 178 179 180 181 182 183 184 185 186 187 188 189 190 191 192 193 194 195
Yet, under 30 °C and 60% RH, even leaves with high chlorophyll content had higher gs but still showed lower Ci/Ca than leaves with low chlorophyll content.
Although PN was influenced by many conditions, including stomatal and non- stomatal factors, ETR was still highly correlated with PN in both species when merging data from leaves with different chlorophyll content and measured under different PPFD, temperature and RH (Fig. 4a, c). However, both the slope and determination coefficient (r2) for the ETR–PN correlation were greater for P.
purpureum than M. floridulus. In contrast, the gs–PN correlation was not as close as ETR–PN correlation for both species. At low temperature, many PN values were low in the gs–PN regression lines (Fig. 4b, d).
Discussion
We examined the association of ETR and A for 2 C4 perennial grasses by merging data from varied seasons and different N fertilization, light intensity, seasonal temperature and RH. The top two fully expanded leaves with high chlorophyll content showed high PN at the same PPFD and seasonal temperature (Figs. 1 and 2, and data not shown). This result might be due to both leaf chlorophyll content and photosynthetic characteristics being influenced by leaf N (Verhoeven et al. 1997;
Lawlor 2002; Cheng 2003; Huang et al. 2004; Ding et al. 2005; Netto et al.
2005; Zhao et al. 2005).
ETR is calculated as the product of PSII efficiency and absorbed light. α may vary by leaf chlorophyll content. Previously, we found that the correlation between α and SPAD value (Minolta SPAD-502 chlorophyll meter reading) could be fitted with the following equation (Jiang 2007):
α = 0.0034•SPAD + 0.7266 (1)
We used the data shown in Fig. 1 to compare the association of PN and ETR 196
197 198 199 200 201 202 203 204 205 206 207 208 209 210 211 212 213 214 215 216 217 218 219 220 221
calculated with the mean of α (0.84) (Björkman and Demmig 1987) or with the result of equation 1. Even in leaves with a broad range of chlorophyll content (0.18–0.55 g m–2, SPAD = 22.4–49.5 and α = 0.80–0.89), we found a similar association of PN and ETR regardless of use of α = 0.84 or 0.80–0.89 for calculating ETR (Fig. 5). Thus, we used α = 0.84 in the present study.
Many reports have indicated that chlorophyll content always increases linearly with increasing leaf N (e.g., Cheng 2003; Netto et al. 2005; Zhao et al. 2005). Chlorophyll content can be detected easily and quickly by use of a chlorophyll meter (e.g., Netto et al. 2005). Thus, we used chlorophyll content measured by a chlorophyll meter as an indicator ofleaf N.
Photosynthesis is limited by both stomatal and non-stomatal factors. The former is associated with decreased leaf Ci caused by stomata closure, and the latter is associated with decrease in photochemical efficiency and CO2 fixation (Berry and Downton 1982; Brodribb 1996). Both A and gs decrease under N deficiency (Huang et al. 2004; Ding et al. 2005; Zhao et al. 2005). However, the response of Ci accompanying the decreases in A and gs are not uniform: such leaves may show higher Ci (Huang et al. 2004; Ding et al. 2005) or lower Ci (Zhao et al. 2005) than leaves with non-deficient N supply. We found similar results. Under all conditions, most leaves with high chlorophyll content had high PN
and gs (Figs. 1, 2 and data not shown). However, at 30 °C and 60% RH, Ci/Ca was greater in leaves with low than high chlorophyll content (Fig. 1d). This finding might due to reduced carboxylation efficiency (Huang et al. 2004; Ding et al. 2005). In contrast, at 15 °C, all tested leaves showed high Ci/Ca, and the difference in Ci/Ca was less than at 30 °C. This finding might be due to key C4 enzymes, such as the cold 222
223 224 225 226 227 228 229 230 231 232 233 234 235 236 237 238 239 240 241 242 243 244 245 246
liability of pyruvate Pi dikinase is sensitive to low temperature (Pittermann and Sage 2000; Kubien et al. 2003, Kakani et al. 2008) and leads to the carboxylation efficiency of all leaves being more limited by low temperature than gs (Pittermann and Sage 2000, 2001; Kubien et al. 2003; Kościelniak and Biesaga-Kościelniak 2006). As well, many PN values, obtained at low temperature, were low in the gs–PN regression lines (Fig. 4b, d). In addition, gs may be reduced in response to increased vapor pressure difference between leaf and air (Morison and Gifford 1983; Yong et al. 1997;
Maherali et al. 2003). We showed that low RH could decrease Ci/Ca (Fig. 3).
For many C4 plants, including Miscanthus, A increases up to a Ci of about 200–
250 μmol mol–1 (Ziska and Bunce 1997; Huxman and Monson 2003; Naidu and Long 2004). We measured photosynthesis under 350–400 μmol mol–1 CO2 and found that Ci/Ca could decrease to < 0.5 when measured at 30 °C, especially under 40% RH.
Under these conditions, Ci was lower than the saturated portion of the A–Ci curve for many C4 plants. Thus, A might be limited by low Ci. In C4 or C3 plants under non- photorespiration (e.g., low O2 and saturated CO2), because A is a major sink for electrons from PSII, the allocation electron flow between A and other alternative sinks in C4 plants remains unchanged under many conditions. This situation explains the close association of ETR and A (or ФPSII and ФCO2) in many cases, including under changed Ci value (Krall and Edwards 1992; Oberhuber and Edwards 1993; Naidu and Long 2004; Farage et al. 2006; Kakani et al. 2008).
In terms of the effect of N on the ETR–A (or ФPSII–ФCO2) association in C4 plants, maize leaves under low N showed a small decrease in ФCO2 at any given ФPSII (Khamis et al. 1990). In addition, the partitioning of electron flow between CO2 assimilation and photorespiration was not affected by leaf N content in leaves of apple (C3 fruit tree) (Cheng et al. 2001). However, probably because of PSII heterogeneity and 247
248 249 250 251 252 253 254 255 256 257 258 259 260 261 262 263 264 265 266 267 268 269 270 271
changes in electron flow to sinks other than CO2 assimilation, the ФPSII–ФCO2
relationship under non-photorespiratory conditions was curvilinear when merging data from apple leaves with a wide range of leaf N content and measured at 87–1,990 μmol m–2 s–1 PPFD, low 2% O2 and saturated CO2 (1,300 μmol mol–1) (Cheng et al. 2001). In the present study, we derived a broad range of leaf-scale photosynthetic rate from variation in N fertilizer and seasonal temperature, as well as PPFD and RH during measurement. Even when merging all data for the same species, PN still showed a close linear correlation with ETR (Fig. 4a, c). This result indicated no change in proportion of electron flow to CO2 assimilation and alternative sinks.
The allocation of electron flow between A and other alternative sinks may be altered in low-temperature-grown C4 plants (Fryer et al. 1998; Farage et al. 2006). However, the threshold temperature for change in allocation electron flow varies by species. For example, PSII electron transport relative to A increased for 17°C-grown Cyperus longus but for 10°C-grown Miscanthus × giganteus (Farage et al. 2006). In the
present study, the mean monthly temperature of the coldest month (January) remained near 15 °C. Probably, this temperature was not low enough to change the electron flow of the tested species. In addition, the ETR/A (or ФPSII/ФCO2) ratio may increase with advancing growth for annual C4 crops (Earl and Tollenaar 1998) and winter- dormant perennial C4 grasses grown at high altitude (45°50‘N) (Baerlocher et al.
2004). However, in the lowlands of subtropical Taiwan, perennial C4 grasses can grow year-round. We measured the top 2 fully expanded leaves. Probably for these reasons, the ETR–A relation of the 2 tested species measured in different seasons was not influenced by phenological stages. Also, we found no change in ETR/A ratio with temperature for either species (Fig. 4 a, c), which suggests no marked effects on CO2
272 273 274 275 276 277 278 279 280 281 282 283 284 285 286 287 288 289 290 291 292 293 294 295 296
leakage and dark respiration under light (Naidu and Long 2004).
However, the slope for the ETR–PN correlation was higher for P. purpureum than M. floridulus (Fig. 4 a, c). C4 maize cultivars have shown differences in the ФPSII–ФCO2
relationship, due to differences in allocation of electron flow between A and other alternative sinks (D'Ambrosio et al. 2003). As well, PN is determined by subtracting dark respiration from gross photosynthesis; thus, in addition to the effects of alternative sinks, the ETR–PN relation may be affected by dark respiration. According to Yin et al. (2011a), dark respiration under light is closely related to the intercept value at the PN-axis of the ETR–PN linear relationship. The absolute value of this intercept was higher for P. purpureum than M. floridulus (Fig. 4 a, c), so P.
purpureum had higher dark respiration under light than M. floridulus. Thus, the higher
slopes for the ETR–A correlation in P. purpureum than M. floridulus was not due to low dark respiration. The ETR–PN relation was not influenced markedly by both gs
and carboxylation efficiency within a species (Fig. 4 a, c), and more electrons were not diverted to non-photochmical quencing in M. floridulus than P. purpureum (data not shown). The correlation coefficient between ETR and PN greater for P.
purpureum than M. floridulus may be due to the lower proportion of electron flow to
alternative sinks (Fryer et al. 1998; D'Ambrosio et al. 2003; Farage et al. 2006). From Fig. 4 a, c and Yin et al. (2011a), the ratio of ETR to gross photosynthetic rate for P.
purpureum and M. floridulus was about 3.8 and 4.3, respectively. The latter value was
similar to that for both maize, an annual C4 crop (Earl and Tollenaar 1998) and Spartina alterniflora, a high-altitude–grown perennial C4 grass, in the early part of the growth season (Baerlocher et al. 2004), but lower than that for maize at the late grain- filling stage (Earl and Tollenaar 1998) and growth under controlled environmental conditions in a climate chamber (D'Ambrosio et al. 2003). However, the ETR/A value 297
298 299 300 301 302 303 304 305 306 307 308 309 310 311 312 313 314 315 316 317 318 319 320 321
for M. floridulus was only 3.8, smaller than the theoretical minimum value (4, Edwards and Baker 1993). Because we used a lower flash strength (6000 μmol m–2 s–
1) than saturating (Loriaux et al. 2013) to assess Fm', ФPSII might have been under- measured for both tested species.
In conclusion, we tested 2 perennial C4 grasses that can sustain year-round growth in subtropical Taiwan to determine the association of ETR and A. Despite a broad range of A obtained because of both stomatal and non-stomatal factors caused by different light, humidity, seasonal temperature, phenological stage and N fertilization, ETR was still highly correlated linearly with net photosynthetic rates, when data from the same species were combined for analysis. Thus, ETR could be used to assess the dynamic A for some perennial C4 species through different seasons.
However, the ETR–A correlation may vary by many conditions and may not apply to all C4 plants under all conditions.
References
Adams WW III, Zarter CR, Ebbert V, Demmig-Adams B (2004) Photoprotective strategies of overwintering evergreens. BioScience 54:41–49
Asada K (1999) The water-water cycle in chloroplasts: Scavenging of active oxygens and dissipation of excess photons. Annu Rev Plant Phys Plant Mol Biol 50: 601–
639
Baerlocher MO, Campbell DA, Ireland RJ (2004) Developmental progression of photosystem II electron transport and CO2 uptake in Spartina alterniflora, a facultative halophyte, in a northern salt marsh. Can J Bot 82: 365–375
Berry JA, Downton WJS (1982) Environmental regulation of photosynthesis, in:
Govindjee (Ed.), Photosynthesis Volume II, Academic Press, London, pp. 263–
343 322
323 324 325 326 327 328 329 330 331 332 333 334 335 336 337 338 339 340 341 342 343 344 345 346 347
Björkman O, Demmig B (1987) Photon yield of O2 evolution and chlorophyll fluorescence characteristics at 77 K among vascular plants of diverse origins.
Planta 170:489–504
Brodribb T (1996) Dynamics of changing intercellular CO2 concentration (ci) during drought and determination of minimum functional ci. Plant Physiol 111:179–185 Cheng L (2003) Xanthophyll cycle pool size and composition in
relation to the nitrogen content of apple leaves. J Exp Bot 54:385–
393
Cheng L, Fuchigami LH, Breen PJ (2001) The relationship between photosystem II efficiency and quantum yield for CO2 assimilation is not affected by nitrogen content in apple leaves. J Exp Bot 52:1865–1872
Cornic G, Briantais JM (1991) Partitioning of photosynthetic electron flow between CO2 and O2 reduction in a C3 leaf (Phaseolus vulgaris L.) at different CO2
concentrations and during drought stress. Planta 183:178–184
D'Ambrosio N, Arena C, Virzo de Santo A (2003) Different relationship between electron transport and CO2 assimilation in two Zea mays cultivars as influenced by increasing irradiance. Photosynthetica 41:489–495
D'Ambrosio N, Arena C, Virzo de Santo A (2006) Temperature response of photosynthesis, excitation energy dissipation and alternative electron sinks to carbon assimilation in Beta vulgaris L. Environ Exp Bot 55:248–257
Demmig-Adams B, Adams WWIII, Barker DH, Logan BA, Bowlong DR, Verhoeven AS (1996) Using chlorophyll fluorescence to assess the fraction of absorbed light allocated to thermal dissipation of excess excitation. Physiol Plant 98:253–264 Ding L, Wang KJ, Jiang GM, Biswas DK, Xu H, Li LF, Li YH (2005) Effects of
nitrogen deficiency on photosynthetic traits of maize hybrids released in different years. Ann Bot 96:925–930
348 349 350 351 352 353 354 355 356 357 358 359 360 361 362 363 364 365 366 367 368 369 370 371 372 373
Earl HJ, Tollenaar M (1998) Relationship between thylakoid electron transport and photosynthetic CO2 uptake in leaves of three maize (Zea mays L.) hybrids.
Photosynth Res 58:245–257
Edwards GE, Baker NR (1993) Can CO2 assimilation in maize leaves be predicted accurately from chlorophyll fluorescence analysis? Photosynth Res 37: 89–102 Farage PK, Blowers D, Long SP, Baker NR (2006) Low growth temperatures modify
the efficiency of light use by photosystem II for CO2 assimilation in leaves of two chilling-tolerant C4 species, Cyperus longus L. and Miscanthus × giganteus. Plant Cell Environ 29:720–728
Fryer MJ, Andrews JR, Oxborough K, Blowers DA, Baker NR (1998) Relationship between CO2 assimilation, photosynthetic electron transport, and active O2
metabolism in leaves of maize in the field during periods of low temperature.
Plant Physiol 116:571–580
Huang ZA, Jiang DA, Yang Y, Sun JW, Jin SH (2004) Effects of nitrogen deficiency on gas exchange, chlorophyll fluorescence, and antioxidant enzymes in leaves of rice plants. Photosynthetica 42:357–364
Huxman TE, Monson RK (2003) Stomatal responses of C3, C3-C4 and C4 Flaveria species to light and intercellular CO2 concentration: implications for the evolution of stomatal behaviour. Plant Cell Environ 26:313–322
Jiang CY (2007) The chlorophyll fluorescence and leaf reflectance spectra characteristics among sweet potato (Ipomoea batatas (L.) Lam) genotypes with various leaf colors. Master Thesis, Dept. of Life Sciences, National Chung-Hsing Univ., Taiwan.
Kakani VG, Surabhi GK, Reddy KR (2008) Photosynthesis and fluorescence responses of C4 plant Andropogon gerardii acclimated to temperature and carbon dioxide. Photosynthetica 46:420–430
374 375 376 377 378 379 380 381 382 383 384 385 386 387 388 389 390 391 392 393 394 395 396 397 398 399
Kato MC, Hikosaka K, Hirotsu N, Makino A, Hirose T (2003) The excess light energy that is neither utilized in photosynthesis nor dissipated by photoprotective mechanisms determines the rate of photoinactivation in photosystem II. Plant Cell Physiol 44:318–325
Khamis S, Lamaze T, Lemoine Y, Foyer C (1990) Adaptation of the photosynthetic apparatus in maize leaves as a result of nitrogen limitation: relationships between electron transport and carbon assimilation. Plant Physiol 94:1436–1443
Kościelniak J, Biesaga-Kościelniak J (2006) Photosynthesis and non-photochemical excitation quenching components of chlorophyll excitation in maize and field bean during chilling at different photon flux density. Photosynthetica 44:174–180 Krall JP, Edwards GE (1990) Quantum yields of photosystem II electron transport and
carbon dioxide fixation in C4 plants. Aust J Plant Physiol 17:579–588
Krall JP, Edwards GE (1992) Relationship between photosystem II activity and CO2
fixation in leaves. Physiol Plant 86:180–187
Kubien DS, von Caemmerer S, Furbank RT, Sage RF (2003) C4 photosynthesis at low temperature. A study using transgenic plants with reduced amounts of Rubisco.
Plant Physiol 132:1577–1585
Kumagai E, Araki T, Ueno O (2010) Comparison of susceptibility to photoinhibition and energy partitioning of absorbed light in photosystem II in flag leaves of two rice (Oryza sativa L.) cultivars that differ in their responses to nitrogen-deficiency. Plant Prod Sci 13:11–20
Lawlor DW (2002) Carbon and nitrogen assimilation in relation to yield: mechanisms are the key to understanding production systems. J Exp Bot 53:773–787
Loriaux SD, Avenson TJ, Welles JM, McDermitt DK, Eckles RD,
Riensche B, Genty B (2013) Closing in on maximum yield of chlorophyll 400
401 402 403 404 405 406 407 408 409 410 411 412 413 414 415 416 417 418 419 420 421 422 423 424 425
fluorescence using a single multiphase flash of sub-saturating intensity. Plant Cell Environ 36:1755–1770
Maherali H, Johnson HB, Jackson RB (2003) Stomatal sensitivity to vapour pressure difference over a subambient to elevated CO2 gradient in a C3/C4 grassland. Plant Cell Environ 26:1297–1306
Makino A, Osmond B (1991) Effects of nitrogen nutrition on nitrogen partitioning between chloroplasts and mitochondria in pea and wheat. Plant Physiol 96:355–
362
Maxwell K, Johnson GN (2000) Chlorophyll fluorescence-a practical guide. J Exp Bot 51:659–668
Miyake C, Okamura M (2003) Cyclic electron flow within PSII protects PSII from its photoinhibition in thylakoid membranes from Spinach chloroplasts. Plant Cell Physiol 44:457–462
Mohotti AJ, Lawlor DW (2002) Diurnal variation of photosynthesis and photoinhibition in tea: effects of irradiance and nitrogen supply during growth in the field. J Exp Bot 53:313–322
Morison JIL, Gifford RM (1983) Stomatal sensitivity to carbon dioxide and humidity:
A comparison of two C3 and two C4 grass species. Plant Physiol 71:789–796 Naidu SL, Long SP (2004) Potential mechanisms of low-temperature tolerance of C4
photosynthesis in Miscanthus giganteus: an in vivo analysis. Planta 220:145–
155
Netto AT, Campostrini E, de Oliveira JG (2005) Bressan-Smith, R.E.:
Photosynthetic pigments, nitrogen, chlorophyll a fluorescence and SPAD-502 readings in coffee leaves. Sci Hort 104:199–209
Oberhuber W, Edwards GE (1993) Temperature dependence of the linkage of quantum yield of photosystem II to CO2 fixation in C4 and C3 plants. Plant Physiol 426
427 428 429 430 431 432 433 434 435 436 437 438 439 440 441 442 443 444 445 446 447 448 449 450 451
101:507–512
Pittermann J, Sage RF (2000) Photosynthetic performance at low temperature of Bouteloua gracilis Lag., a high-altitude C4 grass from the Rocky Mountains, USA.
Plant Cell Environ 23:811–823
Pittermann J, Sage RF (2001) The response of the high altitude C4 grass Muhlenbergia montana (Nutt.) A.S. Hitchc. to long-and short-term chilling. J Exp
Bot 52:829–838
Ripley BS, Gilbert ME, Ibrahim DG, Osborne CP (2007) Drought constraints on C4
photosynthesis: Stomatal and metabolic limitations in C3 and C4 subspecies of Alloteropsis semialata. J Exp Bot 58:1351–1363
Robinson JM (1990) Nitrite photoreduction in vivo is inhibited by oxygen. Plant Physiol 92:862–865
Roháček K, Barták M (1999) Technique of the modulated chlorophyll fluorescence:
Basic concepts, useful parameters, and some applications. Photosynthetica 37:339–363
Romanowskaa E,_Anna Drożaka A, Pokorskaa B, Shiellb BJ, Wojtek P.
Michalskib WP (2006) Organization and activity of photosystems in the mesophyll and bundle sheath chloroplasts of maize. J Plant Physiol 163: 607–618
Verhoeven AS, Demmig-Adams B, Adams WWIII (1997) Enhanced employment of the xanthophyll cycle and thermal energy dissipation in spinach exposed to high light and N stress. Plant Physiol 113:817–824
Weng JH, Chen CY (1987) Differences between Indica and Japonica rice varieties in CO2 exchange rates in response to leaf nitrogen and temperature. Photosynth Res 14:171–178
Weng JH, Hsu FH (2001) Gas exchange and epidermal characteristics of Miscanthus 452
453 454 455 456 457 458 459 460 461 462 463 464 465 466 467 468 469 470 471 472 473 474 475 476 477
populations in Taiwan varying with habitats and nitrogen application.
Photosynthetica 39:35–41
Wong SH, Chen CW, Huang HW, Weng JH (2012) Using combined measurements of gas exchange and chlorophyll fluorescence to investigate the photosynthetic light responses of plant species adapted to different light regimes. Photosynthetica 50:206–214
Yin X, Struik PC (2012) Mathematical review of the energy transduction
stoichiometries of C4 leaf photosynthesis under limiting light.Plant Cell Environ 35:1299–1312
Yin X, Sun Z, Struik PC, Gu J (2011a) Evaluating a new method to estimate the rate of leaf respiration in the light by analysis of combined gas exchange and
chlorophyll fluorescence measurements. J Exp Bot 62:3489–3499
Yin X, Sun Z, Struik PC, van der Putten PEL, van IeperenW, Harbinson J (2011b) Using a biochemical C4 photosynthesis model and combined gas exchange and chlorophyll fluorescence measurements to estimate bundle-sheath conductance of maize leaves differing in age and nitrogen content. Plant Cell Environ34: 2183–2199
Yong JWH, Wongs SC, Farquhar GD (1997) Stomatal responses to changes in vapour pressure difference between leaf and air. Plant Cell Environ 20:1213–1216
Zhao D, Reddy KR, Kakani VG, Reddy VR (2005) Nitrogen deficiency effects on plant growth, leaf photosynthesis, and hyperspectral reflectance properties of sorghum. Europ J Agron 22:391–403
Ziska LH, Bunce JA (1997) Influence of increasing carbon dioxide concentration on the photosynthetic and growth stimulation of selected C4 crops and weeds.
Photosynth Res 54:199–208 478
479 480 481 482 483 484 485 486 487 488 489 490 491 492 493 494 495 496 497 498 499 500 501 502
Fig. 1 Light-response curves for Pennisetum purpureum measured in September to
October at 30 °C and 60% relative humidity. PN represents net photosynthetic rate;
ETR represents electron transport rate; gs represents stomatal conductance; Ci
represents intercellular CO2 concentration; Ca represents atmospheric CO2
concentration; closed and open symbols represent high (0.39–0.50 g m–2) and low (0.18–0.33 g m–2) chlorophyll content, respectively. Each point represents the value for one leaf. Numeric values in panel A are chlorophyll content for each leaf.
503 504 505 506 507 508 509 510 511
Fig. 2 Light-response curves for Pennisetum purpureum measured in January at 15°C and 60% relative humidity. PN represents net photosynthetic rate; ETR represents electron transport rate; gs represents stomatal conductance; Ci represents intercellular CO2 concentration; Ca represents atmospheric CO2 concentration; closed and open symbols represent high (0.39–0.55 g m–2) and low (0. 0.25–0.33 g m–2) chlorophyll content, respectively. Each point represents the value for one leaf. Numeric values in panel A are chlorophyll content for each leaf.
512 513 514 515 516 517 518 519
B Pennisetum purpureum
PPFD (mol m-2 s-1)
0 500 1000 1500 2000
Ci/Ca
A Miscanthus floridulus
0 500 1000 1500 2000
0.2 0.3 0.4 0.5 0.6 0.7 0.8 0.9
(6) (6)
(6) (6)
(7) (10)(6)
(7)(6)
(5)
Fig. 3 Effect of photosynthetic photon flux density (PPFD) on ratio of intercellular to
atmospheric CO2 concentration (Ci/Ca) at different seasonal temperatures. ●, ▲, ○ and △ represent at 60% relative humidity and 15 °C (in January), 20 °C (in December),25 °C (in November) and 30 °C (in September–October), respectively; ▽ represents at 40% relative humidity and 30 °C (in September–October). Data are mean SD; numeric value within the parentheses are sample size of each measurement.
520
521 522 523 524 525 526 527
ETRSLC (mol e- m-2 s-1)
0 20 40 60 80 100 120 140 160 PN (mol CO2 m-2 s-1 )
0 10 20 30 40
gs (mol H2O m-2 s-1)
ETR (mol e- m-2 s-1)
0 20 40 60 80 100 120 140 160 0
10 20 30 40
gs (mol H2O m-2 s-1)
0.0 0.1 0.2 0.3 0.4
Miscanthus floridulusPennisetum purpureum
y = 0.235 x - 0.633 r2 = 0.952***
y = 88.664 x + 1.660 r2 = 0.698***
y = 0.265 x -1.189
r2 = 0.985*** y = 106.751 x + 0.230 r2 = 0.742***
A
D B
C
Fig. 4 The correlation of electron transport rate (ETR) and stomatal conductance (gs) with net photosynthetic rate (PN) for Miscanthus floridulus and Pennisetum purpureum. ●, ▲, ○ and △ represent at 60% relative humidity and 15 °C (in
January), 20 °C (in December), 25 °C (in November) and 30 °C (in September–
October), respectively; ▽represents at 40% relative humidity and 30 °C (in September–October). Each point represents the value for each leaf measured under each level (0–2,000 μmol m–2 s–1) of photosynthetic photon flux density. ***
represents P < 0.001.
528 529 530 531 532 533 534 535 536
ETR (mol e- m-2 s-1)
40 60 80 100 120 140 160 180
PN (mol CO 2 m-2 s-1 ) 10 20 30 40
y = 0.220x - 1.471 r2 = 0.990***
y = 0.209 x - 1.075 r2 = 0.992***
Fig. 5 The association of electron transport rate (ETR) and net photosynthetic rate
(PN) for Pennisetum purpureum at 60% relative humidity and 30 °C. Data from Fig. 1 [SPAD value (Minolta SPAD-502 chlorophyll meter reading) = 22.4–49.5]. Closed symbol and solid line vs. open symbol and dotted line – α = 0.84 and α = 0.0034•SPAD + 0.7266 (α = 0.80–0.89), respectively, used for calculating ETR. Each point represents the value for each leaf measured under each level (0–2,000 μmol m–2 s–1) of photosynthetic photon flux density. *** represents P < 0.001.
537
538 539 540 541 542 543 544