STREAM MORPHOLOGICAL ANALYSIS BY AIRBORNE LASER ALTIMETRY
AND FRACTAL DIMENSION
Mon-Shieh Yang 1* Ming-Chee Wu 2 and Jin-King Liu3
1 Department of Earth Sciences, National Cheng Kung University,
No.1 Tashue Road, Tainan, TAIWAN, 70101 R.O.C E-mail: [email protected]
2 Department of Earth Sciences, National Cheng Kung University,
No.1 Tashue Road, Tainan, TAIWAN, 70101 R.O.C E-mail: [email protected]
3 Taiwan Group on Earth Observations (TGEO), Taiwan,R.O.C
Email: [email protected]
*Corresponding author:[email protected]
ABSTRACT
The stream morphology may present different stages of fluvial processes by characteristics and sediments of various stream flow conditions; it played an important role for the stream cumulative stress. The stream morphology is being adjusted by the incoming stream flows as well as the sediments been carried. In Taiwan, streams are showing a very complicate topography due to the high eroding capability caused by secondary disasters such as landslides and debris flows after heavy rain or typhoon. Nevertheless, to understand the balancing characteristics between incoming flow and sediment regime is an important task for disaster prevention.
Quantifying the morphology along a river channel has been proven difficult; till the airborne laser altimetry technology was implemented in the survey. In this study, the remote sensing techniques are employed to assist the studies on stream roughness distribution and morphological investigation. The results are proven to be valuable for hydrological and engineering applications.
The stream roughness was derived from Light Detection and Ranging (LiDAR) records of Airborne Laser Altimeter. Data of the pre-disaster and the post-disaster were compared to determine the variability of stream morphology. Even the stream sediment grain size cannot be determined by high accuracy and high resolution LiDAR, topographic data can still be described as self-affined random fractals; namely, allowing fractal dimension to be implemented to understand the topographic roughness. In general, the greater the fractal dimension of the surface has, the rougher the surface is. In this study, fractal dimension are employed to evaluate the stream morphology. The results showed that the upper-reaches demonstrate higher roughness values than the lower-upper-reaches; the materials from debris flow and landslides also influence the incoming flow and sediment carrying capacities.
Keywords:
Fractal Dimension, LiDAR, Stream Morphology, Debris flow, Landslides
INTRODUCTION
Geomorphometry, which is defined by Chorley (1969) as the science “which treats the geometry of the landscape”, attempts to describe quantitatively the form of the land surface. In a general sense, roughness refer to the irregularity of a topographic surface. The terrain roughness can be
measured by significant wavelengths. The significant wavelengths of topography are termed as grain or texture, while amplitudes associated with these wavelengths correspond to the concept of relief. The relationship between the horizontal and vertical dimensions of the topography is embodied in the land slope and the dispersion of slope magnitude and orientation, while vertical distribution of mass under the topographic surface is contained of hypsometry (Mark, 1975) .
According to previous studies, evaluating the surface roughness by using LiDAR data has been proved to be a useful approach on detecting landslide areas (Dhakal et al., 2000, McKean and Roering, 2004, Glenn et al., 2006, Cavalli et al., 2008). However, the surface roughness of a landform is nevertheless dependent upon the material properties, processes acting upon it, and the time elapsed since formation. The river characteristics have played an important role for hydrological models (Mason et
al., 2003). Sediments supplied from landslides may affect the river channel morphology changes in
different reaches or magnitude; namely, the riverbed morphology can be related to disaster events. Benda and Dunne (1997) had analyzed the transportation of debris flow sediment in the first and the second order channels, and predicted the landslides in different channel reaches for the next 3000 years.
Study area
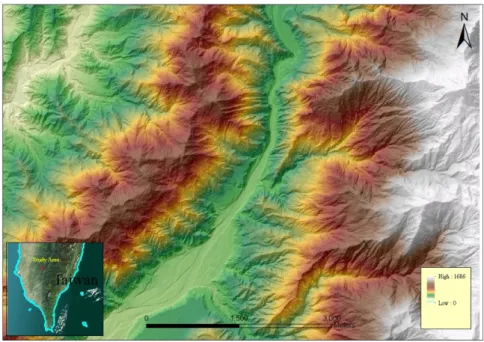
The study area, with 5.5×7 km2, is located at the northeast portion of Kaohsiung City, Taiwan; is
situated in the sub-basin of the Kao-Ping Catchment (see Figure 1). The accuracy and high-resolution images of the Kao-Ping Catchment, taken with Airborne LiDAR, were adopted for pre-disaster and post-pre-disaster riverbed roughness evaluation and analysis.
Figure 1. Pre-disaster LiDAR DEM of Hsiaolin village, the study area.
Landslide events
Hsiaolin village, located at the northeast part of Kaohsiung City, sustained heavy damage during a catastrophic landslide event in August, 2009. Induced by Typhoon Morakot, the Hsiaolin Landslide was recognized as a wedge type slope failure.
Regional geological setting
The river-bed geological setting of Hsiaolin village reach was primarily consisted with alternation of sandstone and shale. Serious landslides occur after typhoons and rainfall, especially the area surrounding the river banks and the proximity of local main highway.
METHODOLOGY
In some hydroclimatic regions, channel adjustment is strongly forced by colluvial sediment inputs (and thus an imposed sediment size distribution) to channels through landsliding and debris flows. In
these regions the influence of climate on the network-wide distribution of step-pool chan-nels may be more closely linked to climatological events that deliver sediment to channels through mass movement. The amount and frequency of colluvial material delivery to channels may directly influence the effectiveness of channel forming events(Flores et al., 2006). Montgomery and Buffington (1997) had success distinguishing between bedrock and alluvial chan-nels in forested drainages using a slope-area plots. The roughness configurations or energy dissipating features that distinguish these channel types reflect downstream changes in sediment supply relative to capacity.
Topographic data
The materials used in this study included the Airborne LiDAR Digital Elevation Model (DEM) and the derived roughness data. The LiDAR DEM was derived from point clouds and then resampled with 1-meter grid. LiDAR data were collected both before and after the disaster caused by Typhoon Morakot in 2005 and 2010.
SURFACE ROUGHNESS
The “surface roughness” is an expression of the variability of a topographic surface at a given scale. The roughness is described using surface-elevation values. It can be used to characterize landforms over a variety of different scales. In remote sensing , the roughness can also be quantified by using the reflections of electromagnetic radiation, ranging from specular to diffuse, from landform surface; In geomorphometry, roughness is described using surface-elevation values and can be used to characterize landforms over a variety of different scales (Thomas Lillesand et al., 2008). This indicates that a single definition of surface roughness may not be sufficient. Surface roughness is treated here as a geomorphometric variable, not a parameter. A variable is a measurable property of a phenomenon (e.g., slope angle); while a parameter is a summary measurement of the characteristics of a population (e.g., mean slope angle) (Grohmann et al., 2011). Several methods have been developed for the definition, calculation, and application of surface roughness (Glenn et al., 2006, Cavalli et al., 2008).
Fractal dimension
The topographic data can be conceptualized as representing a three-dimensional surface, where the measured value at each geographic location is represented by the height of the surface. It can be described as self-affined random fractals (Turcotte, 1997), allowing fractal dimension to be used to understand the topographic roughness. In general, the greater the fractal dimension of the surface, the rougher the surface is (Glenn et al., 2006). Hence, Surface patterns can be represented by quantitative measurements that vary continuously across the landscape, the shapes are frequently characterized via the fractal dimension of the object (Krummel et al., 1987, Ripple et al., 1991), and it can be applied to spatial features over a wide variety of scales. The degree of complexity of a polygon is characterized by the fractal dimension (D), for simple Euclidean shapes, D = 1 (the dimension of a line). As the polygons become more complex, the fractal dimension increasingly to 2.
The logic is based on to equals 2 times the logarithm of patch perimeter (m) on DEM which divided by the logarithm of patch area (m2) and the perimeter is adjusted to correct for the raster bias in perimeter,
when fractal dimension greater than 1 for a 2-dimensional pattern, that indicated the shape show an increase trend in shape complexity,the fractal dimension could reflects shape complexity across a range of spatial scales, Because the landscapes in this technique are grid based, consisting of square cells, and having a square shape , hence, to calculate the constant of proportionality between area and perimeter for a single cell, the formula is based on calculated slopes as follows:
𝑃𝑃 = 4 ∗ 𝐴𝐴𝐷𝐷/2 (1)
and
𝐷𝐷 =2 ln (.25 𝑃𝑃 )ln 𝐴𝐴 ;1 ≦ 𝐷𝐷 ≦ 2 (2)
where
A = total patch area and P = total patch perimeter. RESULTS AND DISCUSSION
The results of the stream morphology are obtained from different data-sets by using various combinations of LiDAR data, fractal dimension to be used to understand the topographic roughness, the degree of complexity of a polygon is characterized by the fractal dimension (D).
The variety of river bed roughness
The shape of post disaster river channel shows an increase trend in shape complexity, the Table 1 shows the disaster events induced roughness variety, the materials from debris flow and landslides also influence the river bed morphology,after the typhoon events, the flood land morphology became more complexity.
Table 1. Typhoon events induced flooding fractal dimension change
Pre-disaster (2005) Post-disaster (2010)
Minimum 1.14 1
Maximum 1.71 2
Mean 1.33 1.37
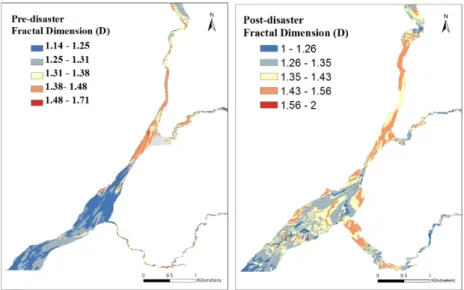
The statistic data also demonstrated higher data range in post-disaster and it was affected by material supported from the upper-stream, Figure 2 illustrated the spatial variety of the river-bed roughness, the materials from debris flow and landslides also influence the incoming flow and sediment carrying capacities, the entire river channel bed has widened which undertake by landslides materials,
Figure 2. The spatial variety of the river-bed roughness (Left: Pre-disaster; Right: Post-disaster)
The landslides alluvial fan morphology
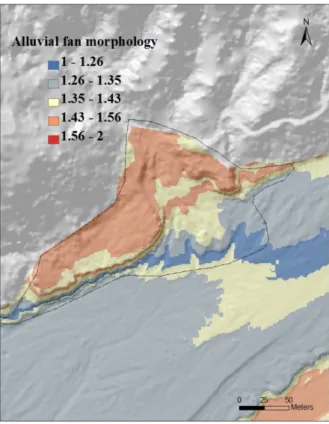
The accumulation materials lies on the toe of the landslides, the alluvial fan roughness is decreasing from upstream to downstream, the upper part of the fan shows a lower fractal dimension and the lower part the demonstrate higher roughness values, the entire alluvial fan has shown a regular pattern and represented a well-sorting in horizontal scale (Figure 3).
Figure 3. The landslides alluvial fan morphology CONCLUSIONS
The high accuracy and high resolution airborne LiDAR data provided an effective analysis in river morphology, the derived data can be implemented for fractal dimension analysis, the results has shown the relationship between river morphology and disaster events, the LiDAR derived data and morphology analysis technique can be treated as a disaster prevented and management tool, the further study can also integrated field observation data for hydrological and engineering applications.
REFERENCES
Benda, L. & Dunne, T., 1997. Stochastic forcing of sediment supply to channel networks from landsliding and debris flow. Water Resources Research, 33 (12), 2849-2863.
Cavalli, M., Tarolli, P., Marchi, L. & Dalla Fontana, G., 2008. The effectiveness of airborne lidar data in the recognition of channel-bed morphology. Catena, 73 (3), 249-260.
Chorley, R.J., 1969. The drainage basin as the fundamental geomorphic unit” in:Chorley, r. J., ed.,.
Water, earth and man. London: Methuen & Co. Ltd, 77-79.
Dhakal, A.S., Amada, T. & Aniya, M., 2000. Landslide hazard mapping and its evaluation using gis: An investigation of sampling schemes for a grid-cell based quantitative method.
Photogrammetric Engineering and Remote Sensing, 66 (8), 981-989.
Flores, A.N., Bledsoe, B.P., Cuhaciyan, C.O. & Wohl, E.E., 2006. Channel-reach morphology dependence on energy, scale, and hydroclimatic processes with implications for prediction using geospatial data. Water Resources Research, 42 (6), 1-15.
Glenn, N.F., Streutker, D.R., Chadwick, D.J., Thackray, G.D. & Dorsch, S.J., 2006. Analysis of lidar-derived topographic information for characterizing and differentiating landslide morphology
and activity. Geomorphology, 73 (1-2), 131-148.
Grohmann, C.H., Smith, M.J. & Riccomini, C., 2011. Multiscale analysis of topographic surface roughness in the midland valley, scotland. IEEE Transactions on Geoscience and Remote Sensing, 49 (4), 1200-1213.
Krummel, J.R., Gardner, R.H., Sugihara, G., O'neill, R.V. & Coleman, P.R., 1987. Landscape patterns in a disturbed environment. Oikos, 48 (3), 321-324.
Mark, D.M., 1975. Geomorphometric parameters: A review and evaluation. Geografiska Annaler. Series A, Physical Geography, 57 (3/4), 165-177.
Mason, D.C., Cobby, D.M., Horritt, M.S. & Bates, P.D., 2003. Floodplain friction parameterization in two-dimensional river flood models using vegetation heights derived from airborne scanning laser altimetry. Hydrological Processes, 17 (9), 1711-1732.
Mckean, J. & Roering, J., 2004. Objective landslide detection and surface morphology mapping using high-resolution airborne laser altimetry. Geomorphology, 57 (3-4), 331-351.
Montgomery, D.R. & Buffington, J.M., 1997. Channel-reach morphology in mountain drainage basins. Geological Society of America Bulletin, 109 (5), 596-611.
Ripple, W.J., Bradshaw, G.A. & Spies, T.A., 1991. Measuring forest landscape patterns in the cascade range of oregon, USA. Biological Conservation, 57 (1), 73-88.
Thomas Lillesand, Ralph W. Kiefer & Chipman, J., 2008. Remote sensing and image interpretation University of Wisconsin, Madison: John Wiley & Sons.
Turcotte, D.L., 1997. Fractals and chaos in geology and geophysics Cambridge: Cambridge University Press.