Graduate Institute of Clinical Dentistry School of Dentistry
National Taiwan University Master Thesis
5 3
Adjunctive local antimicrobial therapy in the treatment of residual pockets in the maintenance phase of chronic periodontitis: A systematic review and network meta-analysis
Yu-Hao Yang
Advisor: Mark Yen-Ping Kuo DDS, Ph.D.
Yu-Kang Tu DDS, Ph.D.
10 7 6
June, 2018
I I
[
[ 3
5 [
5 8
.
. 5
3
Embase Medline Pubmed Cochrane
22
0 (
) ( ) ( )
5
5 (Chlorhexidine chip, 0.67 (95% Confidence intervals
CI 0.15~1.19 ) 5 (Tetracycline fiber, 0.57
(95% CI 0.19~0.95) 5 (Photodynamic therapy,
0.44 (95% CI 0.12~0.76)
5 ( 0.65 (95% CI 0.21~1.10)
5 ( 0.64 (95% CI 0.20~1.08)
5 ( 0.60 (95% CI 0.18~1.02
5 (Doxycycline gel, 0.70 (95% CI
0.09~1.31) 5
5
5
3 5 5
5
Abstract
Background Chronic periodontitis(CP) is a disease, which is prevalent in adults, with slow to moderate rate of progression. Non-surgical periodontal therapy, comprised of scaling and root planing (SRP) had proven to be the gold standard of periodontal
therapy for most patients with CP. Maintenance phase of periodontal therapy is required after SRP to prevent the recurrence of disease progression. However, residual pockets may still exist during maintenance. The residual pocket may be related to difficulty of thorough debridement, such as sites with initial deep probing pocket depth(PPD) or anatomical structures, which may hinder complete removal of calculus. Therefore, several methods have been introduced as adjuncts to SRP in the treatment of residual pocket in maintenance phase. The aim of this study was to conduct a systematic review and network meta-analysis to determine the treatment effect of different antimicrobial agents in residual pockets.
Material and Methods A systematic literature research was conducting using the Medline, EMBASE (via PubMed), Cochrane Library databases and hand search up to and including October 2017. Primary outcomes were changes in probing pocket depth(PPD) and clinical attachment level(CAL) from baseline to follow-up visits of different time points. Treatment outcomes were reported by specific time periods: short (≤ 3 months), medium (4 ~ 6 months), and long (> 7 months) term. Network
meta-analysis was carried out using STATA (version 15, StataCorp LP, College Station, TX, USA)
Results A total of 22 studies were included in this review and following data synthesis.
In the short-term follow-up, adjunctive use of tetracycline fiber (0.57 mm (95% CI:
0.19~0.95), chlorhexidine chip (0.67 mm (95% CI: 0.15~1.19), and photodynamic therapy (0.44 mm (95% CI: 0.12~0.76) showed statistically significant results than
scaling and root planing alone. In the medium-term follow-up, significantly better
results can be obtained using adjunctive tetracycline fiber (0.64 mm (95% CI: 0.20~1.08) and chlorhexidine chip (0.65 mm (95% CI: 0.21~1.10) in probing depth reduction.
Besides, adjunctive use of doxycycline gel (0.70 mm (95% CI: 0.09~1.31) and chlorhexidine chip (0.60 mm (95% CI: 0.18~1.02) would achieve significantly better results in clinical attachment level gain. No adjunctive antimicrobial agents showed significant advantage in the long-term follow-up.
Conclusion Adjunctive local antimicrobial agents performed better than scaling and root planing alone in the treatment of residual pockets, and the additional benefits cane be maintained for up to six months. The most consistent advantages were obtained with the use of tetracycline fiber and chlorhexidine chip.
Key word Chronic periodontitis, local antimicrobials, systematic review, network meta-analysis.
Contents
Abstract ... ..IV Contents……….……….…VI List of figures……….………...……...IX List of tables………...…...….XI
Chapter 1 Introduction……….…1
1-1. Periodontitis……….……….……1!
1-1-1 Pathogenesis and progression of periodontitis ... 1
1-1-2 Treatment of periodontitis ... 2!
1-2. Non-surgical therapy………3
1-3. Local drug delivery……….……….6!
1-3-1 Tetracycline fiber ... 6!
1-3-2 Doxycycline gel ... 7!
1-3-3 Minocycline gel ... 7!
1-3-4 Minocycline microsphere ... 8!
1-3-5 Metronidazole gel ... 8!
1-3-6 Chlorhexidine chip ... 9!
1-3-7 Chlorhexidine gel ... 9!
1-3-8 Photodynamic therapy ... 9
Chapter 2 AIM……….…11
Chapter 3 Materials and methods………..12
3-1. Selection criteria...12
3-1-1 Studies ... 12
3-1-2 Population ... 12
3-1-3 Intervention………..………....12
3-1-4 Comparisons………...………..…12
3-1-5 Outocmes………...……...12
3-1-6 Exclusion criteria………...…12
3-2. Identifying research evidence………….……….…………..13
3-3. Study selection…………...……….…………14
3-4. Data extraction………..……….…………14
3-5. Quality assessment………..………...…15
3-6. Network meta-analysis…..……….…………16
Chapter 4 Results……….17
4-1. Results of the search………..……….…………17
4-2. Included studies………..……17
4-3. Risk of bias assessment………..………...….18
4-4. Network meta-analysis…..……….…………18
4-4-1 Changes of PPD in short-term follow-up ... 18
4-4-2 Changes of PPD in medium-term follow-up ... 19
4-4-3 Changes of PPD in long-term follow-up ... 20
4-4-4 Changes of CAL in short-term follow-up ... 20
4-4-5 Changes of CAL in medium-term follow-up ... 21
4-4-6 Changes of CAL in long-term follow-up ... 22
4-5. Treatments ranking...23
4-6. Evaluating the inconsistency between direct and indirect evidence …….24
4-7. Comparisons between traditional pairwise and network meta-analysis...24
4-8. Publicaiton bias………..………25
Chapter 5 Discussion………...26
5-1. Summary of the main findings……..………26
5-2. Comparisons with other studies or reviews……….………26
5-3. Clinical implication of the results……….…27
Chapter 6 Conclusion………..34 Appendix
References
List of figures
Fig. 1 Flowchart for literature search and identifications of articles for review ...35
Fig. 2 Network map of treatment comparisons for PPD reduction in short-term
follow-up (≤ 3 months)...36 Fig. 3 Network map of treatment comparisons for PPD reduction in medium-term follow-up (3 months ~ 6 months)...36 Fig. 4 Network map of treatment comparisons for PPD reduction in long-term follow-up (> 6 months)...37 Fig. 5 Network map of treatment comparisons for CAL gain in short-term follow-up (≤
3 months)...37 Fig. 6 Network map of treatment comparisons for CAL gain in medium-term follow-up (3 months ~ 6 months)...38
Fig. 7 Network map of treatment comparisons for CAL gain in long-term follow-up (> 6 months)...38
Fig. 8 Forest plot of treatment comparisons for PPD reduction in short-term follow-up (≤ 3 months)...39 Fig. 9 Forest plot of treatment comparisons for PPD reduction in medium-term
follow-up (3 months ~ 6 months)...40
Fig. 10 Forest plot of treatment comparisons for PPD reduction in long-term follow-up
(> 6 months)...41
Fig. 11 Forest plot of treatment comparisons for CAL gain in short-term follow-up (≤ 3 months)...42
Fig. 12 Forest plot of treatment comparisons for CAL gain in medium-term follow-up (3 months ~ 6 months)...43
Fig. 13 Forest plot of treatment comparisons for CAL gain in long-term follow-up (> 6 months)...44
Fig. 14 Treatment ranking for PPD reduction in short-term follow-up in SUCRA...45
Fig. 15 Treatment ranking for PPD reduction in medium-term follow-up in SUCRA...46
Fig. 16 Treatment ranking for PPD reduction in long-term follow-up in SUCRA…...47
Fig. 17 Treatment ranking for CAL gain in short-term follow-up in SUCRA………....48
Fig. 18 Treatment ranking for CAL gain in medium-term follow-up in SUCRA...49
Fig. 19 Treatment ranking for CAL gain in long-term follow-up in SUCRA...50
Fig. 20 Inconsistency estimates of the network meta-anaysis...51
Fig. 21 Funnel plot for PPD reduction in short-term follow-up...52
Fig. 22 Funnel plot for PPD reduction in medium-term follow-up...53
Fig. 23 Funnel plot for PPD reduction in long-term follow-up...54
Fig. 24 Funnel plot for CAL gain in short-term follow-up...55
Fig. 25 Funnel plot for CAL gain in medium-term follow-up...56
Fig. 26 Funnel plot for CAL gain in long-term follow-up...57
List of tables
Table 1. Summary of estimates and 95% CI of all pairwise comparisons in PPD
reduction………..58
Table 2. Summary of estimates and 95% CI of all pairwise comparisons in CAL gain.61 Table 3. Summary of all pairwise comparisons in terms of PPD reduction and CAL gain in short-term follow-up ...64
Table 4. Summary of all pairwise comparisons in terms of PPD reduction and CAL gain in medium-term follow-up ...65
Table 5. Summary of all pairwise comparisons in terms of PPD reduction and CAL gain in long-term follow-up ...66
Table 6. Characteristics of studies included in the network meta-analysis……...67
Table 7. Studies excluded after reviewing full-text with reasons………74
Table 8. Risk of bias assessment of included studies ……...………...78
Chapter 1 Introduction
1-1. Periodontitis
1-1-1 Pathogenesis and progression of periodontitis
Chronic periodontitis (CP) is a disease, which is prevalent in adults, with slow to moderate rate of progression (Armitage, 1999, Armitage, 2004). According to the The National Health and Nutrition Examination Surveys (NHANES III), ampng dentate persons aged 30 years and older, about 35% had CP to various extents (Albandar, 2002).
Features of CP include signs and symptons such as recession of the gingival margin loss of alveolar bone increased tooth mobility eventually exfoliation of teeth(Becker et al., 1979).
Destruciton of periodontium were resulted from perturbation of the balance between periodontal pathogens and host immune system. Endotoxin and collagenase secreted by periodontal pathogens will stimulate local inflammatory reaction and activation of host immue system. Inflammatory cells produces proinflammatory cytokine prostaglandin metalloproteinases (Cochran, 2008) to exacerbate imflammatory reaction and tissue destruction with clinical features of gingival bleeding formation of periodontal pockets(Frank, 1980).
Dental plaque was constituted mainly by bacteria. Different species of bacteria will connect to each other by means of various mechanisms. Coaggregation is a kind of
cell-to-cell recognition of genetically distinct cell types by the function of adhesins (Kolenbrander and London, 1993). Eventually, these bacteria will adherent to each other and/or to surfaces or interfaces, namely biofilm (Costerton, 1995). The complex biofilm can protect obligate anaerobes from the toxic effects of oxygen, and these anaerobic bacteria can form endotoxins to damage host tissue (Bradshaw et al., 1996). Within a couple of weeks, a matured biofilm with 50~100 µm in thickness, forms plaque (Lamont and Jenkinson, 1998). Calculus is formed by calcifying plaque with calcium and phosphorus ions. (Caton and Quinones, 1991). More and more plaque can be adhered to calculus, ends up with a vicious cycle (Page Rc Fau - Schroeder and Schroeder, 1976).
1-1-2 Treatment of periodontitis
Treatment of periodontitis is characterized by four phases: (1) Phase I therapy or cause-related therapy or non-surgical periodontal therapy. Objective of phase I therapy is to alter or eliminate the microbial etiology and factors that contribute to periodontal diseases by enhance oral hygiene, remove plaque and calculus, root planing, and elimination of local factors such as dental caries, ill-fitting prosthesis, excessive occlusal force (Nyman and Lindhe, 1979, Axelsson P Fau - Lindhe and Lindhe). (2) Phase II therapy or surgical periodontal therapy. Aims of surgical therapy include reduction or elimination of periodontal pockets, remove subgingival calculus in
intrabony defect or furcation area (Caffesse et al., 1986b), recontouring of irregular bone, tooth, or soft tissue, and regenerate bone by regenerative materials (Barrington, 1981). (3) Phase III therapy or restorative therapy. In this phase prosthetic
reconstruction is performed. (4) phase IV therapyor supportive periodontal therapy (Renvert and Persson, 2004). Patients are placed on a schedule of periodic recall visit after phase I therapy is completed for maintenance care to prevent recurrence of the periodontal disease.
1-2. Non-surgical therapy
Non-surgical therapy involves various means to control the infection causing
pathologic lesions in the periodontal tissues. Debridement, scaling, and root planing can alter the subgingival ecology through disruptionof the microbial biofilm, reduction of the amount of bacteria, and suppression of the inflammation (Lindhe et al., 2003).
Non-surgical periodontal treatment may be carried out using various types of instrument, including hand instruments, sonic and ultrasonic instruments, and ablative laser devices. The use of hand instruments allows good tactile sensation, but tends to be time consuming and requires correct and frequentinstrument sharpening (Lindhe et al., 2003). Sonic devices use air pressure to create mechanical vibration that in turn causes the instrument tip to vibrate, the frequencies of vibration ranging from 2000 to 6000 Hz (Gankerseer and Walmsley, 1987, Shah et al., 1994). Ultrasonic instruments convert
electrical current into mechanical energy in the form of high-frequency vibrations, the frequencies of vibration ranging from 18000 to 45000 Hz. In comparison to hand instrumentation, the use of sonic and ultrasonic instruments may provide better access to deep pockets and furcation areas(Kocher et al., 1998, Beuchat et al., 2001). Ablative laser therapy has bactericidal and detoxification effects, is capable of removing bacterial biofilm and calculus with extremely low mechanical stress and no formation of a smear layer on root surfaces, and can remove the epithelium lining and inflamed tissue within the periodontal pocket (Ishikawa et al., 2009, Mizutani et al., 2016).
Mechanical therapy comprised of meticulous debridement of root surfaces, scaling, and root planing had proven to be the gold standard for non-surgical periodontal therapy (Lindhe et al., 2003). Its efficacy is well documented in several systematic reviews (Suvan 2005; Tunkel et al. 2002; Van der Weijden and Timmerman 2002) by gains in clinical attachment levels (CAL), reductions in probing pocket depth (PPD) and frequency of inflammation. Maintenance phase of periodontal therapyis required after scaling and root planing (SRP) to prevent the recurrence of disease progression. It could also keep the good result of active treatment. However, residual pocketmay still exist during maintenance. The residual pocket may be related to difficulty of thorough debridement, such as sites with initial deep PPD(Rabbani et al., 1981) or anatomical structures(Caffesse et al., 1986a)(e.g. : developmental grooves, fossae, furcation area,
root concavities), which may hinder complete removal of calculus. Therefore, concept of adjunctive periodontal therapy have been developed: Systemically administered or locally delivered antimicrobial agents (Slots and Rams, 1990, Goodson, 1994,
Winkelhoff et al., 1996, Mombelli et al., 2011), Laser-assisted periodontal therapy(Aoki et al., 2015, Mizutani et al., 2016), and antimicrobial photodynamic therapy
(Christodoulides et al., 2008, Chondros et al., 2009, Lulic et al., 2009).
Systemically administered antimicrobial agents are dominated by antibiotics, it may be capable of eliminating periodontal pathogens, diminishing periodontal inflammation, and reducing possibility of recurrent periodontal disease (Goodson, 1994, Winkelhoff et al., 1996). However, systemic antibiotic therapy also has some disadvanages : possible antimicrobial resistance, sustained opportunistic pathogen, and general discomfort like gastrointestinal disturbances or nausea (Helovuo, 1987). In contrast, locally deliverd antibiotics can avoid development of antimicrobial resistance and accomplish 100 fold higher therapeutic doses in subgingival sites than those possible by systemic therapy (Baker Pj Fau - Evans et al., 1985). Its shortcomings include difficult of applying the therapeutic agents to deeper parts of the periodontal pocket and relatively
time-consuming if many periodontal sites have to be treated (Slots and Rams, 1990).
This study is focused on locally delivered antimicrobial agents as adjunctive periodontoal therapy.
1-3. Local drug delivery
Due to limited volume of periodontal pockets (Binder et al., 1987) and the rapid turn over of gingival crevicular fluid within the periodontal pocket (Goodson, 1989), it is imperative for locally delivered antimicrobials to reach their target sites and be maintained there long enough to achieve sufficient concentration (Goodson, 1989, Goodson, 1996). Therefore, more and more vehicles have been developed in order to consistently release drug at a level high enough to eliminate microbials for longer duration (Joshi et al., 2016).
All the locally delivered antimicrobial agents used in the involved articles in this study will be introduced briefly in this section.
1-3-1 Tetracycline fiber
A small-diameter cellulose-acetate hollow fibers were filled with tetracycline and put into periodontal pocket (Goodson et al., 1979). The composition of fibers had been modified by using ethylene vinyl actate as vehicle, with brand name of Actisite (ALZA Corp. CA). Actisite contains 25 % tetracycline, can be maintained in gingival crevicular fluid for over 10 days with sustained concentration of 1590 µg/mL, is the most widely used controlled-release tetracycline antimicrobial product (Goodson et al., 1983, Tonetti et al., 1990). However, additional fiber replacement or removal procedure is needed due to the non-resorbable characteristic (Goodson et al., 1991). Side effects including
gingival swelling, redness, or candidiasis infection have been reported
(Vandekerckhove et al., 1997b, Yalcin et al., 1998). Researches using tetracycline fiber as an adjunctive treatment in this network meta-analysis are: (Kinane and Radvar, 1999, Wong et al., 1998, Radvar et al., 1996, Newman et al., 1994b)
1-3-2 Doxycycline gel
Atrigel(Atridox, Atrix Lab), is a gel with 10% Doxycycline in the formation. It is a controlled-release antimicrobial agent, which can maintained 250 mg/mL concentration 7 days after injected into periodontal pockets (Polson et al., 1997). The gel had been approved by US Food and Drug Administration (FDA) with brandname of Atridox (Block Drug Corp. USA, 8.5% Doxycycline). Researches using doxycycline gel as an adjunctive treatment in this network meta-analysis are: (Salvi et al., 2002), (Bogren et al., 2008), (Tonetti et al., 2012).
1-3-3 Minocycline gel
Periocline (Sunstar. Japan) Dentomycin(Cyanamid Int. USA), is a gel which contains 2% minocycline. Its concentration in gingival crevicualr fluid 1 hour after topical delivered into periodontal pocket is measured 1000 µg/ml, and is measured 100 µg/ml after 48 hours, both above its minimal inhibitory concentration (MIC) (Satomi et al., 1987, Steenberghe et al., 1999). Researches using minocycline gel as an adjunctive
treatment in this network meta-analysis are: (Kinane and Radvar, 1999), (Radvar et al., 1996).
1-3-4 Minocycline microsphere
Arestin(OraPharma. USA) Minocin(Cyanamid Int. USA), is a bioabsorbable polymer microencapsulating minocycline hydrochloridein it. The resulting
microspheres are administered in powder form into periodontal pockets. Immediate upon contact with moisture, the polymer begins to hydrolyze and release minocycline.
Sustained release of the antibiotic with concentrations of 340 µg/mlhave been measured in human crevicular fluid after 14 days (Williams et al., 2001). Researches using
minocycline microsphere as an adjunctive treatment in this network meta-analysis is (Killeen et al., 2016).
1-3-5 Metronidazole gel
Elyzol (Dumex Ltd. Denmark) is a commercial gel that contains 25% metronidazole.
Most anaerobic bacterial species is susceptible toward this antibiotic. It is commonly used as an adjunctive therapy in treatment of severe periodontitis (Van Winkelhoff et al., 2005). Metronidazole gel is reported to maintain level above minimal inhibitory
concentration after 24 hours (Stoltze, 1992). Researches using metronidazole gel as an adjunctive treatment in this network meta-analysis are : (Kinane and Radvar, 1999),
(Radvar et al., 1996), (Riep et al., 1999), (Salvi et al., 2002), (Leiknes et al., 2007), (Rudhart et al., 1998)
1-3-6 Chlorhexidine chip
PerioChip (Perioproducts Ltd. Israel) contains 2.5 mg of chlorhexidine gluconate in a cross-linked, hydrolysed gelatin vehicle(Heasman et al., 2001). Concentrations of the drug remains above the minimum inhibitory concentration for more than 99% of periodontal pocket flora for up to 9 days (Stanley et al., 1989, Soskolne et al., 1998, Schwach-Abdellaoui et al., 2000). Researches using chlorhexidine chip as an adjunctive treatment in this network meta-analysis are : (Salvi et al., 2002), (Heasman et al., 2001), (Kasaj et al., 2007).
1-3-7 Chlorhexidine gel
Chlosite(Ghimas. Italy) is a gel that contains 0.5% chlorhexidine digluconate and 1%
chlorhexidine dihydrochloride. chlorhexidine digluconate is liberated in the first day and achieves a concentration > 100 µg/ml, which is maintained for an average of 6 ~ 9 days(Rusu and Stefan-Ioan, 2005, Gupta et al., 2008). Researches using chlorhexidine gel as an adjunctive treatment in this network meta-analysis is : (Matesanz et al., 2013).
1-3-8 Photodynamic therapy
Photodynamic therapy(PDT) is based on the principle that a photosensitizer binds to the target cells and can be activated by light of a suitable wavelength. Following
activation of the photosensitizer, singlet oxygen and other very reactive agents are produced that are extremely toxic to certain cells and bacteria(Takasaki et al., 2009).
Photosensitizers commonly employed in PDT are toluidine blue O and methylene blue, which have been demonstrated effectively inactivate both gram-positive and
gram-negative periodontal pathogens(Wilson et al., 1993, Sarkar and Wilson, 1993).
The light sources of a specific wavelength mostly applied in PDT range from visible light to the blue of argon lasers (630~980 nm). However, in the case of in vivo and clinical investigations, the diode lasers are the light source predominantly applied (Takasaki et al., 2009). Researches using photodynamic therapy as an adjunctive treatment in this network meta-analysis are: (Muller Campanile et al., 2015, Campos et al., 2013, Carvalho et al., 2015, Chondros et al., 2009, Correa et al., 2016, Lulic et al., 2009, Giannopoulou et al., 2012, Goh et al., 2017)
Chapter 2 Aim
Currently, there is no explicit guideline for treatment of residual pockets in the maintenance phase of periodontal therapy. Traditional meta-analysis compared efficacy of antimicrobial agents as an adjunctive therapy to SRP in residual pockets have been published(Hanes and Purvis, 2003, Bonito et al., 2005, Xue and Zhao, 2017,
Matesanz-Perez et al., 2013). However, considering all the treatment strategies mentioned before, not yet a multiple-treatments meta-analysis has been conducted.
Network meta-analysis combines results from multiple treatments and enables statistical comparison. It is a methodology for the statistical synthesis of direct and indirect
comparisons of different treatments and had been used in dental research(Faggion et al., 2013, Tu et al., 2012b). The aim of of this study was to conduct a systematic review and network meta-analysis to determine the treatment effect of different antimicrobial agents in residual pockets.
Chapter 3 Materials and methods
We aimed to answer the following questions: What is the comparative effect of different
adjunctive antimicrobial agents as an adjunct to SRP in treatment of residual pockets?
3-1. Selection criteria 3-1-1 Studies
Randomized controlled studi, either parallel or split-mouth designed, included subjects with measures of residual pockets and controls.
3-1-2 Population
Non-medically compromised patient with residual pockets after periodontal phase I therapy.
3-1-3 Intervention
Tested one or more methods used as adjuncts to SRP.
3-1-4 Comparisons
Received the same SRP alone or with a placebo as the treatment group.
3-1-5 Outcomes
Changes in PPD reduction and CAL gain.
3-1-6 Exclusion criteria
Trials were excluded if they met the following criteria:
(1)!Patients were with early-onset or aggressive periodontitis.
(2)!Patients who were not under maintenance care of periodontal therapy.
(3)!Assessed effect of an antimicrobial agent without SRP (i.e.: monotherapy).
(4)!Treatment was not focused in residual pockets.
(5)!Treatment has included furcation sites.
(6)!Treatment is not an antimicrobial agent.
(7)!Insufficient data can be collected.
(8)!Design is not a randomized controlled trial.
3-2. Identifying research evidence
We use th keywords including MeSH Terms of (supportive periodontal therapy OR periodontal maintenance OR residual pocket) AND (“Dental Scaling” [Mesh] OR “Root Planing” [Mesh] OR periodontal treatment OR periodontal therapy OR scaling root planing). No additional restrictions in terms of language were imposed. The reference lists of previously published reviews and meta-analyses were also cross-checked for the trials missed in our electronic literature search.
The search was conducted within the electronic databases via Ovid Medline (via PubMed), Embase, Cochrane library, Cochrane Databse of Systemic Reivews up to October 31st, 2017.
Unpublished data were sought by searching a database listing unpublished studies (OpenGray [http:// www.opengrey.eu/], formerly OpenSIGLE). Furthermore, reference lists of previous systematic reviews and included studies were examined and
hand-searched in order to recognize any further articles that could be considered for inclusion.
3-3. Study selection
Study selection was conducted by one independent reviewer in the following steps:
1.! Initial screening of potentially-suitable titles and abastracts against in the inclusion criteria to identify potentially applicarble studies.
2.! Screening of the full-text articles identified in step one as possible eligibility Studies were excluded if not meeting the inclusion criteria. Studies would be cited under one study name if same data were reported in multiple studies. When doubts about including the study or not were raised, a consensus was obtaitned with second reviewer by discussion.
3-4. Data extraction
A standardized data extracation form from eligible studies were recorded by one reviewer and were confirmed by another independent author. In particular, the
following data were recorded: study design, number of patients, treatment protocol, durationof of follow-up period, outcome measurement including changes of PPD, CAL, and their standard deviation. If standard error or confidence intervals instead of standard deviation were reported in the studies, the standard deviation will be derived by formula according to Cochrane Handbook for Systematic Reviews of Interventions(Cochrane,
2011). If the data presented in the studies is calculated based on site level, we will adjust it to a subject(patient) level(Tu et al., 2012a). Changes of PPD is calculated by PPD after treatment minus initial PPD, changes of CAL is also calculated in the same way. Since follow-up period of each studies is different, we split the data of outcome measurement into three time points: short-term (≤ 3 months), medium-term (4 ~ 6 months), long-term (>7 months). Request for missing data through e-mail to authors were performed in studies with insufficient information.
3-5. Quality assessment
Quality assessment of the studies was made by focusing on methodological topics highlighted by Higgins & Green (2011) in the Cochrane Collaboration's tool for
assessing the risk of bias. This tool involves six domains of bias: selection bias (random sequence generation, allocation concealment), performance bias (blinding of
participants and personnel), detection bias (blinding of outcome assessment), attrition bias (incomplete outcome data), reporting bias (selective reporting), and other bias. The risk of bias in the included studies was categorized as follows: (a) low risk of bias (plausible bias unlikely to seriously alter the results) – if the item was met, (b) unclear risk of bias (plausible bias that raises some doubt about the results) – if there was not enough information to judge the item, and (c) high risk of bias (plausible bias that seriously weakens confidence in the results) – if the item was not met.
3-6. Pairwise and Network meta-analysis
We did two types of meta-analysis using the frequentist analysis approach. First, we did standard pairwise meta-analysis using the DerSimonian and Laird random effects model. Pooled outcomes were expressed as weighted mean differences (WMD) with their associated 95% confidence intervals(CI). The significance of discrepancies in the estimates from the different studies was assessed by means of the Cochrane test for heterogeneity and the I2 statistic. Potential publication bias was estimated using Egger's linear regression test and funnel plots(Egger et al., 1997, Begg and Mazumdar, 1994).
Second, we did a network meta-analysis with random effects model(White et al., 2012, Ades, 2006). A consistency model was used to compare effects of different treatments.
Inconsistency between direct and indirect evidence in network meta-analysis was also assessed to check whether its direct evidence and its indirect evidence are consistent, loop inconsistency and design inconsistency was also determined by use of inconsistent factors(Ades, 2006) . To rank the treatments for an outcome, we used surface under the cumulative ranking (SUCRA) probabilities, the larger the SUCRA, the more effective an intervention may be. We did our analysis with STATA version 15 (STATACORP, Texas, USA).
Chapter 4 Results
4-1. Results of the search
1974 possibly eligible studies were identified, and 12 additional studies were manually searched according to published reviews. After screening the title and the abstract, 1893 trials were excluded, and 93 papers were retrieved for full-text evaluation.
The authors were contacted of 5 studies, and 2 of them replied. Eventually, 22 articles meet the inclusion criteria for this review (Fig.1). The excluded 71 studies at full-text stage were listed in Table 7 with reasons.
4-2. Included studies
The characteristics of the included 22 studies are detaied in Table 6. Data from 4 studies were not available or incomplete in the content and no reply from the authors after requesting through e-mail(Lu and Chei, 2005, Flemmig et al., 1996, Jansson et al., 2003, Zingale et al., 2012). Of the 22 studies, 22 reported changes in PPD, and 20 reported changes in CAL. There were nine treatments among these 22 studies, and were listed as follows: Scaling and root planing or scaling alone (SRP/S, control), SRP/S + antimicrobial photodynamic therapy (aPDT), SRP/S + tetracycline fiber (TCF), SRP/S + metronidazole gel (MTZ), SRP/S + doxycycline gel (DOX), SRP/S + Minocycline gel (MIN), SRP/S + Minocycline microsphere (MIM), SRP/S + chlorhexidine chip (CHC), and SRP/S + chlorhexidine gel (CHG). Most of the studies did not record any severe
adverse events, only few studies reported minor side effects such as gingival swelling or gingival discomfort after administration of local antimicrobial agent(Radvar et al., 1996, Kasaj et al., 2007).
4-3. Risk of bias assessment
Risk of bias assessment of included studies was shown in Table 8. Since all the studies were included only if they were randomized controlled trials, the selection bias was assumed to be low. But unspecific information of random sequence generation and concealment of allocation were found to be unclear. Performance and detection biases were graded at high risk for open-labeled or unavailable double blinding trials. When the included study might have potentially conflicts of interest, it will be graded at high risk of other bias. As a result, most of the studies were at an unclear risk of bias.
4-4. Network meta-analysis
4-4-1 Changes of PPD in short-term follow-up
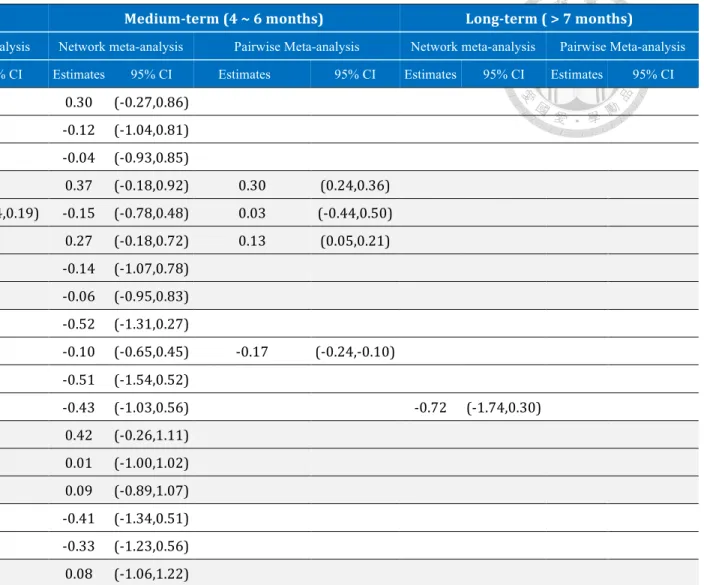
Network of eligible comparisons for changes of PPD in short-term follow-up group is presented in Fig. 2. Eight treatments yield in 28 pairwise comparisons, in which 10 of them were direct comparisons. In the short-term follow-up group, SRP + aPDT, SRP + TCF, and SRP + MTZ were the most frequently investigated treatments. Forest plot of treatment comparisons for PPD reduction is shown in Fig.8. Compared to SRP alone, SRP + TCF (0.56 mm, 95% CI: 0.29 ~ 0.82) and SRP + aPDT (0.45 mm, 95% CI: 0.06
~ 0.83) achieved significant reduction of PPD, whereas other antimicrobial agents only get insignificant additional PPD reduction. Table 3 shows summary of all pairwise comparisons by network meta-analysis in terms of PPD reduction and CAL gain in short-term follow-up. Compared to SRP alone, SRP in conjunction with CHC achieved the greatest additional PPD reduction than other antimicrobial agents (0.67 mm, 95%CI:
0.15-1.19). SRP + TCF and SRP + aPDT achieved 0.57mm (95%CI: 0.19-0.95) and 0.44mm (95%CI: 0.12-0.76) greater PPD reduction than SRP alone, respectively. SRP + MTZ, SRP + DOX, SRP + MIN, and SRP + CHG achieved additional 0.1 mm PPD reduction.
4-4-2 Changes of PPD in medium-term follow-up
Network of eligible comparisons for changes of PPD in medium-term follow-up group is presented in Fig. 3. Nine treatments yield in 36 pairwise comparisons, in which 13 of them were direct comparisons. In the medium-term follow-up group, SRP + aPDT, SRP + TCF, and SRP + MTZ were the most frequently investigated treatments. Forest plot of treatment comparisons for PPD reduction is shown in Fig.9. Compared to SRP alone, SRP + TCF (0.66 mm, 95% CI: 0.44 ~ 0.88) and SRP + aPDT (0.22 mm, 95%
CI: 0.01 ~ 0.42) achieved significant reduction of PPD, whereas other antimicrobial agents only get insignificant additional PPD reduction. Table 4 shows summary of all pairwise comparisons by network meta-analysis in terms of PPD reduction and CAL
gain in medium-term follow-up. Compared to SRP alone, SRP + CHC achieved the greatest additional PPD reduction than other treatments (0.65 mm, 95%CI: 0.21-1.10), SRP + TCF also achieved 0.64 mm (95%CI: 0.20-1.08), SRP + DOX and SRP + MIN achieved around 0.5 mm greater PPD reduction than SRP alone, while SRP+ MIM, SRP + MTZ, SRP + aPDT, and SRP + CHG achieved less than one third of a millimeter additional PPD reduction.
4-4-3 Changes of PPD in long-term follow-up
Network of eligible comparisons for changes of PPD in long-term follow-up group is presented in Fig. 4. Four treatments yield in 6 pairwise comparisons, in which 3 of them were direct comparisons. In the long-term follow-up group, SRP + aPDT was the most frequently investigated treatments. Forest plot of treatment comparisons for PPD reduction is shown in Fig.10. Compared to SRP alone, SRP + DOX (0.10 mm, 95% CI:
0.07 ~ 0.13) achieved significant reduction of PPD, whereas SRP + aPDT and SRP + MIM did not achieve additional PPD reduction. Table 5 shows summary of all pairwise comparisons by network meta-analysis in terms of PPD reduction and CAL gain in long-term follow-up. Only SRP + DOX achieved additional PPD reduction (0.10, 95%CI: -0.48-0.68) than SRP alone. SRP + aPDT and SRP + MIM achieved around 0.2 mm PPD increment than SRP alone.
4-4-4 Changes of CAL in short-term follow-up
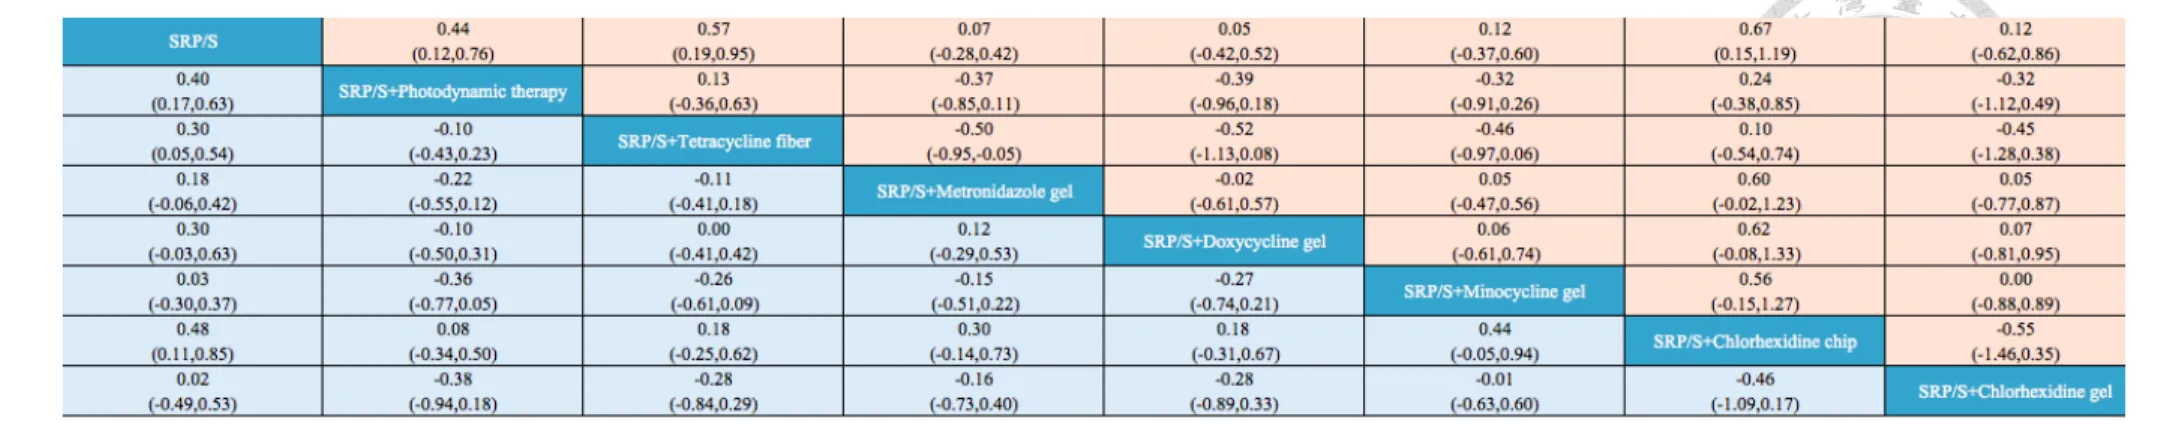
Network of eligible comparisons for changes of CAL in short-term follow-up group is presented in Fig. 5. Eight treatments yield in 28 pairwise comparisons, in which 10 of them were direct comparisons. In the short-term follow-up group, SRP + aPDT, SRP + TCF, and SRP + MTZ were the most frequently investigated treatments. Forest plot of treatment comparisons for CAL gain is shown in Fig.11. Compared to SRP alone, SRP + aPDT (0.40 mm, 95% CI: 0.17 ~ 0.62), SRP + DOX (0.30 mm, 95% CI: 0.28 ~ 0.32), and SRP + TCF (0.28 mm, 95% CI: 0.10 ~ 0.45) achieved significant gain of CAL, whereas other antimicrobial agents only get insignificant additional CAL gain. Table 3 shows summary of all pairwise comparisons by network meta-analysis in terms of PPD reduction and CAL gain in short-term follow-up. Compared to SRP alone, SRP + CHC achieved the greatest additional CAL gain (0.48, 95%CI: 0.11-0.85), SRP + aPDT and SRP + TCF achieved 0.40mm (95%CI: 0.17-0.63) and 0.30mm (95%CI: 0.05-0.54) than SRP alone respectively. Other treatments achieved a slightly smaller additional CAL gain than SRP alone.
4-4-5 Changes of CAL in medium-term follow-up
Network of eligible comparisons for changes of CAL in medium-term follow-up group is presented in Fig. 6. Nine treatments yield in 36 pairwise comparisons, in which 13 of them were direct comparisons. In the medium-term follow-up group, SRP + aPDT, SRP + TCF, and SRP + MTZ were the most frequently investigated treatments. Forest
plot of treatment comparisons for CAL gain is shown in Fig.12. Compared to SRP alone, SRP + TCF (0.29 mm, 95% CI: 0.04 ~ 0.55) achieved significant gain of CAL. SRP + CHX achieved 0.77 mm additional CAL gain alone, but the confidence interval is between -0.23 and 1.77, thus did not reach statistical significance. Table 4 shows summary of all pairwise comparisons by network meta-analysis in terms of PPD reduction and CAL gain in medium-term follow-up. Compared to SRP alone, SRP + DOX achieved the greatest additional CAL gain (0.70, 95%CI: 0.09-1.31), SRP + CHC achieved 0.61mm (95%CI: 0.18-1.02) greater CAL gain than SRP alone, other
treatments achieved a slightly smaller additional CAL gain than SRP alone.
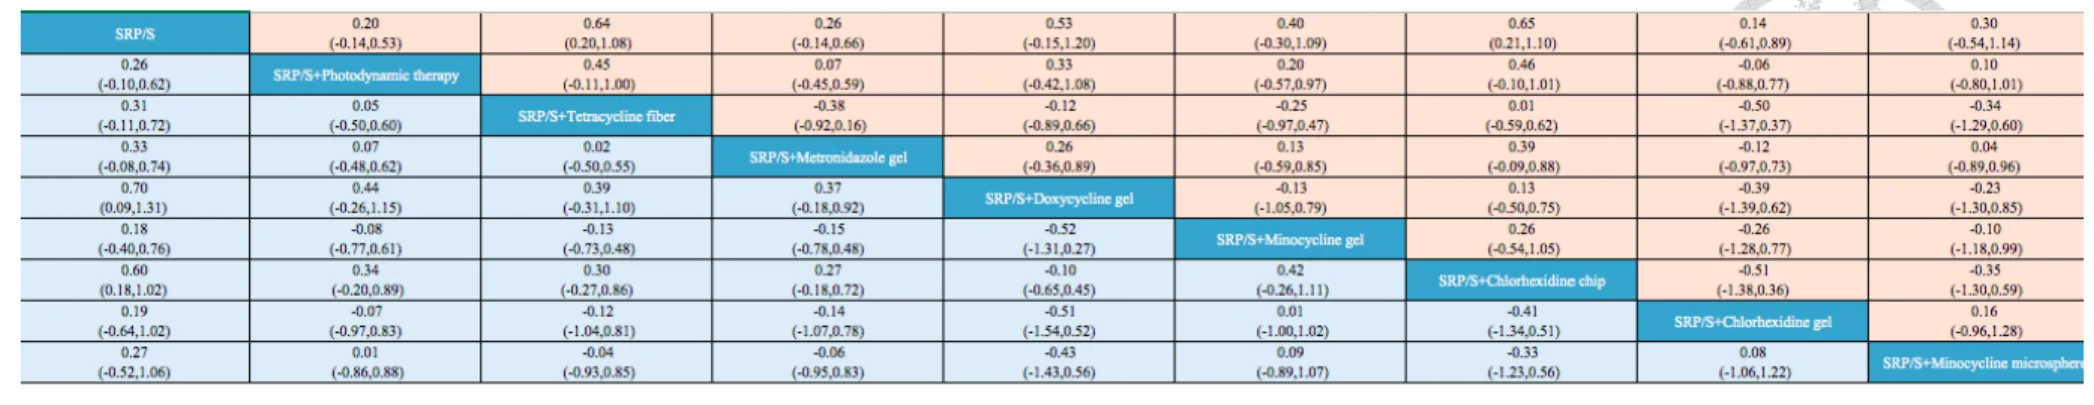
4-4-6 Changes of CAL in long-term follow-up
Network of eligible comparisons for changes of CAL in long-term follow-up group is presented in Fig. 7. Four treatments yield in 6 pairwise comparisons, in which 3 of them were direct comparisons. In the long-term follow-up group, SRP + aPDT was the most frequently investigated treatments. Forest plot of treatment comparisons for CAL gain is shown in Fig.13. Compared to SRP alone, SRP + DOX (0.20 mm, 95% CI: 0.15 ~ 0.25) achieved significant gain of CAL, whereas SRP + aPDT and SRP + MIM did not achieve additional CAL gain. Table 5 shows summary of all pairwise comparisons by network meta-analysis in terms of PPD reduction and CAL gain in long-term follow-up.
Only SRP + DOX achieved additional CAL gain (0.20, 95%CI: -0.43 ~ 0.83) than SRP
alone. SRP + aPDT and SRP + MIM achieved around 0.2 ~ 0.5 mm CAL loss than SRP alone.
4-5. Treatments ranking
We ranked the comparative effects of all antimicrobial agents with SUCRA (surface under the cumulative ranking) probabilities. For short-term PPD reduction, SRP + CHC ranked ahead (87.5%) for being the best intervention, SRP + TCF (83.4%) and SRP + aPDT (71.4%) had highest probability to be in the second and third ranking position respectively (Fig.14). SRP + DOX (30.6%) and SRP + MTZ (31.0%) were assigned to the last and second last position. For medium-term PPD reduction, SRP + CHC (79.4%) ranked for being the best intervention, SRP + TCF (78.4%) and SRP + DOX (67.5%) had highest probability to be in the second and third ranking position respectively (Fig.15). SRP + CHG (34.4%) and SRP + aPDT (35.9%) are the least desirable
treatment in PPD reduction. For long-term PPD reduction, SRP + DOX (68.3%) ranked as the best intervention, SRP + aPDT (40.3%) and SRP + MIM (33.7%) ranked as the second and third place (Fig.16).
For short-term CAL gain, SRP + CHC (85.6%) ranked ahead for being the best intervention, SRP + aPDT (78.1%) and SRP + TCF (64.2%) had the highest probability to be in the second and third ranking position(Fig.17). SRP + MIN (23.3%) and SRP + CHG (26.0%) were assigned to the last and second last position. For medium-term CAL
gain, SRP + DOX (85.9%) ranked ahead for being the best intervention, SRP + CHC (79.7%) and SRP + MTZ (51.9%) had the highest probability to be in the second and third ranking position(Fig.18). SRP + MIN (36.9%) and SRP + CHG (41.4%) are the least desirable treatment in CAL gain. For long-term CAL gain, SRP + DOX (81.2%) ranked as the best intervention, SRP + aPDT (40.8%) and SRP + MIM (16.0%) ranked as the second and third place (Fig.19).
4-6. Evaluating the inconsistency between direct and indirect evidence
In network meta-analysis, evidence from direct comparisons might be inconsistent with evidence from indirect comparisons, and validity of the meta-analysis may be affected. To evaluate inconsistency (design inconsistency, loop inconsistency, and side-splitting inconsistency) in different studies existed or not, we used a statistic model to check it. As a result, no statistical significant inconsistency in the analyses can be suggested among all the possible variables (Fig.20).
4-7. Comparisons between traditional pairwise and network meta-analysis
Table 1 compared the direct and indirect results in PPD reduction. Most of the point estimates displayed little differences, but the 95% confidence intervals of direct evidence and of network meta-analysis were overlapped substantially. The results of SRP + CHC compared to SRP alone revealed superior effect of SRP + CHC than SRP
alone both in pairwise and network meta-analysis. However, the confidence interval of pairwise meta-analysis has involved 0, which was not observed in network
meta-analysis. Table 2 compared results of CAL gain from pairwise meta-analysis to those of network meta-analysis. While there were small differences in the point estimates, the 95% confidence intervals were in general overlapped. Similar to results found in PPD reduction, SRP + CHC achieved greater effects than SRP alone in both kinds of meta-analysis, but the confidence interval of pairwise meta-analysis has involved 0 and this was not the case in network meta-anlysis.
4-8. Publicaiton bias
Publication bias might adversely affect the reliability of the conclusions of
meta-analysis. We therefore checked whether publication bias exists or not. Based on the funnel plot (Fig.21 ~ Fig.26), the graph is symmetric. Thus no evidence of
publication bias is suggested.
Chapter 5 Discussion
5-1 Summary of the main findings
The results of the present study suggested that the adjunctive use of TCF and CHC provide significant additional clinical benefits to the treatment of patients in
maintenance phase of CP in follow-up period up to six months. Other adjunctive antimicrobial agents only showed limited clinical improvement.
5-2. Comparisons with other studies or reviews
Persisting periodontal pockets represent a risk factor for both progression of periodontitis and future tooth loss during maintenance care(Matuliene et al., 2008).
Primary effects of periodontal healing are yielded during cause related phase, such as oral hygiene reinforcement and non-surgical periodontal treatment. Sites that are poorly responded to initial therapy may require additional treatment. Thus, we conducted this research to investigate effects of various adjunctive localized antimicrobial agents compared to scaling and root planing alone. To avoid the possibly interference of the clinical outcomes , we exclude the studies that involved furcation sites due to its complex and irregular anatomy which might impair professional plaque control procedures(Cattabriga et al., 2000, Pihlstrom et al., 1984, Del Peloso Ribeiro et al., 2007).
In present network meta-analysis, we found that adjunctive localized antimicrobial agents do get better results in terms of PD reduction and CAL gain
compared to SRP alone in the follow-up period up to six months. This result was in line with previous published systematic reviews(Bonito et al., 2005, Xue and Zhao, 2017, Matesanz-Perez et al., 2013). In the systematic review, Bonito conducted separate analysis of tetracycline, minocycline, metronidazole, chlorhexidine, and other antimicrobials as locally delivered adjuncts to SRP. As a result, differences between treatment and SRP alone group in the baseline-to-follow-up period typically favored treatment groups but usually only modestly (from about 0.1 mm to near 0.5 mm). Xue and Zhao evaluated efficacy of PDT adjunctive to SRP in residual pockets in their study.
They found that additional clinical improvement in the maintenance of residual pockets in favor of SRP + PDT compared to SRP alone to an extent about two thirds of a
millimeter. In our study, however, only TCF and CHC yielded in statistically significant difference in PPD reduction and only CHC reaches that difference in CAL gain.
5-3. Clinical implication of the results
Antimicrobials must reach their target sites and be maintained there long enough to achieve sufficient concentration(Goodson, 1989). The concentration required for efficacy is often estimated from the minimum inhibitory concentration (MIC). Gel solution material generally maintained MIC in a shorter period of time compared to
agents fabricated in a more solid formulation. MTZ is reported to maintain MIC within 24 hours(Stoltze, 1995), whereas MIN can maintain its concentration in about 4
days(Satomi A, 1987). In contrast, concentration of CHC remains above MIC for more than 99% of the periodontal pocket flora for up to 9 days(Stanley et al., 1989).
Sustained concentration of TCF can be maintained over 10 days(Tonetti et al., 1990).
This may partly explain why TCF and CHC achieved better results than other gel solution antimicrobial agents. Changes in frequency of agent application and time interval between each application may be an alternative way to keep effective antimicrobial concentration on the subgingival microflora.
Besides, based on the fact that SRP + TCF group yielded in 0.57 mm of mean PPD reduction and 0.30 mm of mean CAL gain in 3 months follow-up period, 0.64 mm of mean PPD reduction and 0.31 mm of main CAL gain in 6 months follow-up period, we may assume that almost half of the reduction of PPD in SRP + TCF group were
attributed to gingival recession. This result is in accordance with a previous study which showed gingival recession contributed two-thirds of the pocket reduction in adjunctive TCF therapy(Wilson et al., 1997). The cause of greater gingival recession in SRP + TCF group may be related to the mechanical trauma caused by placement of the fibers in the sulcus for a prolonged period(Wong et al., 1998).
On the other hand, the adjunctive use of PDT only reach significant difference
compared to SRP alone in short-term follow-up. The effectiveness of PDT would depend on three factors: photosensitizer, visible light, and oxygen. Different types of photosensitizer, light application devices, output power, wavelengths, and duration of exposure vary in different studies. Photosensitizers may not be able to reach
concentrations high enough to be absorbed by bacteria. The microenvironment of residual pocket which contained fewer oxygen than healthy sites(Mettraux et al., 1984) might hinder effectiveness of PDT(Henry et al., 1996). Another reason that changes in periodontal parameters did not improve significantly might be the difference in
frequency of PDT application. Chondros et al. only applied PDT once at baseline as adjunct to SRP, and no additional benefits in PPD reduction and CAL gain is achieved.
In contrast, significant PPD reduction and CAL gain can be achieved after single use of adjunctive PDT in other studies(Campos et al., 2013, Goh et al., 2017). The effect of repeated application of PDT has also been studied. Lulic et al. performed repeated application of PDT five times in 14 days interval and found significant PPD reduction and CAL gain can be achieved in six months follow-up. However, in a study comparing different frequency of PDT application (once vs twice in one-week interval), no
significant difference between these two groups can be detected(Muller Campanile et al.,
2015). Based on abovementioned controversial results, more studies may be required to investigate frequency of PDT application to achieve the optimal effect.
In the medium-term follow-up, SRP + DOX achieved additional CAL gain (0.70 95%CI: 0.09-1.31) than SRP alone, which is not in line with the results in short-term and long-term follow-up. The reason why SRP + DOX got this result in the network meta-analysis may be attributed to two facts. First, the performance of SRP + DOX in the 3-arm study(Salvi et al., 2002) is significantly better than the other two treatments (SRP + MTZ and SRP + CHC). Secondly, clinical results of SRP + MTZ or SRP + CHC in other studies of medium-term follow-up group all resulted in better outcomes than they achieved in this 3-arm study (Table 2). The reason for inferior results obtained by SRP+ MTZ and SRP + CHC in this 3-arm study may be ascribed to involving
smokers in the investigation. However, since there is only one study included SRP + DOX in the medium-term follow-up, we should interpret this result with caution.
The efficacy of repeated SRP in residual pockets are rather limited compared to those following the initial phase of subgingival instrumentation(Badersten et al. 1984;
Wennstrom et al. 2005). In the sites respond poorly to initial mechanical debridement, only 11-16% might be brought to a successful treatment endpoint following mechanical re-instrumentation(Wennstrom et al. 2005). In another study evaluating the outcome of re-instrumentation of residual pockets, showed that the overall probability of achieving
pocket closure 3 months after retreatment was about 45%, while for sites with a PPD of
> 6 mm, the probability was only 12%(Tomasi et al. 2008). Surgical intervention of deep periodontal pockets with intrabony defects has demonstrated good performance in PPD reduction of about 3 mm(Laurell et al. 1998; Tu et al. 2012). However, patients may be hesitated in willingness to take surgery as a treatment option. In fact, according to a study(Stabholz and Peretz 1999) evaluating dental anxiety among patients in various dental treatments, periodontal surgery caused second highest dental anxiety score, next to tooth extraction. Periodontal surgery can be a stressful event for many patients, and post-operative period may be accompanied by significant pain and discomfort(Baume et al. 1995). Therefore, if adjunctive methods to SRP can reduce PPD to below 5 mm, it will avoid further necessity of surgery, and will benefit most patients who are afraid of surgery. Furthermore, when PPD of teeth under maintenance care can be maintained below 5 mm, the percentage of tooth loss can be drastically reduced(Matuliene et al. 2008) up to 11 years follow-up.
According to previous studies(Magnusson et al., 1984, Sbordone et al., 1990), after SRP, subgingival microbiota containing large numbers of pathogenic microorganisms repopulated within 2 months in the absence of improved plaque control. More recently, various studies has pointed out that application of adjunctive antimicrobial agents resulted in significant reduction of bacteria for six months follow-up period(Chondros et
al., 2009, Paolantonio et al., 2008, van Steenberghe et al., 1999). Therefore, we may speculate that in the person whose oral hygiene can be adequately achieved, locally delivered antimicrobial agents may help in maintaining low concentration of microorganisms for a longer period of time than SRP alone does.
In the follow-up period for shorter than six months, all adjunctive treatments showed better results than SRP alone, but there were no significant differences between
different adjunctive treatments (Table1, Table 2). Thus we may judge these treatments from other points of view, such as easy-handling characteristics, probability of adverse events or development of resistant bacteria. Typically, a gel-like biomaterial is more easily to inject into sulcus than fiber or chip. Adverse events may happen during or after placement of local antimicrobial agents. Previous studies reported various rates of side effects, from 0 % to more than 60 %.(Killeen et al., 2016, Kinane and Radvar, 1999, Matesanz et al., 2013, Muller Campanile et al., 2015, Tonetti et al., 2012, Williams et al., 2001). Generally, most of the studies did not report severe adverse event. Mostly reported events were temporary discomfort in tooth and gingival tissue (i.e. gingival redness, tooth pain, tooth hypersensitivity, stomatitis). The discomfort feeling will be alleviated or subsided even without use of analgesics in a short period of time.
Antibiotic resistance of periodontal pathogens may develop in the procedure of
systemically or locally administered antibiotics, whereas PDT or CHC should be free of this consideration.
Chapter 6 Conclusion
To our knowledge, this study is the first network meta-analysis of adjunctive antimicrobial agents in treatment of residual pockets.
The results indicated that adjunctive local antimicrobial agents achieved a small additional treatment effect in PPD reduction and CAL gain compared with SRP alone in residual pocket for follow-up period up to six months. The most consistent advantages were attained with the use of TCF and CHC.
Further clinical trials of follow-up period for more than six months is needed to achieve a more convincing result. Properties of each adjunctive antimicrobial agent such as patient compliance, treatment time, cost-effectiveness should be taken into
consideration when we choose one particular agent to deal with residual pockets.
Appendix
Fig.1 flowchart of manuscripts screened through the review process Records identified through
database searching (n =1974)
ScreeningIncludedEligibility Identification
Additional records identified through other sources
(n =12)
Records screened (n =1986)
Records excluded (n =1893)
Full-text articles
assessed for eligibility (n =93)
Full-text articles excluded, with reasons!(n =71) -! Not an antimicrobial
agent
-! Monotherapy only -! Not used in maintenance
patient
-! Not administered locally -! Not in the sites with
residual pckets -! Used in fucation sites -! Only one qualified
treatment arm -! Insufficent data -! Not an randomized
controlled clinical trial Studies included in
qualitative synthesis (n =22)
Studies included in quantitative synthesis
(meta-analysis)! (n =22)
Fig.2 Networks of treatment comparisons for PPD reduction in short-term follow-up (≤
3 months). SRP/S=Scaling and root planing/Scaling. PDT=Photodynamic therapy.
CHX=Chlorhexidine chip. Xan-CHX=Xanthan-based chlorhexidine gel.
Fig.3 Networks of treatment comparisons for PPD reduction in medium-term follow-up (4 months ~ 6 months). MM=Minocycline microsphere.
Fig.4 Networks of treatment comparisons for PPD reduction in long-term follow-up (
> 6 months).
Fig.5 Networks of treatment comparisons for CAL gain in short-term follow-up ( ≤ 3 months).
Fig.6 Networks of treatment comparisons for CAL gain in medium-term follow-up (4 months ~ 6 months).
Fig.7 Networks of treatment comparisons for CAL gain in long-term follow-up ( > 6 months).
Fig.8 Forest plot of random effects meta-analysis evaluating the difference in PPD change in short-term follow up (≤ 3 months).
Fig.9 Forest plot of random effects meta-analysis evaluating the difference in PPD change in medium-term follow up (4 months ~ 6 months).
Fig.10 Forest plot of random effects meta-analysis evaluating the difference in PPD change in long-term follow up (> 6 months).
Fig.11 Forest plot of random effects meta-analysis evaluating the difference in CAL change in short-term follow up (≤ 3 months).
Fig.12 Forest plot of random effects meta-analysis evaluating the difference in CAL change in medium-term follow up (4 months ~ 6 months).
Fig.13 Forest plot of random effects meta-analysis evaluating the difference in CAL change in long-term follow up (> 6 months).
Fig.14 Cumulative probability of ranking evaluating the difference in PPD change in short-term follow-up (≤ 3 months).
Fig.15 Cumulative probability of ranking evaluating the difference in PPD change in medium-term follow-up (4 months ~ 6 months).
Fig.16 Cumulative probability of ranking evaluating the difference in PPD change in long-term follow-up (>6 months).
Fig.17 Cumulative probability of ranking evaluating the difference in CAL change in short-term follow-up (≤ 3 months).
Fig.18 Cumulative probability of ranking evaluating the difference in CAL change in medium-term follow-up (4 months ~ 6 months).
Fig.19 Cumulative probability of ranking evaluating the difference in CAL change in long-term follow-up (>6 months).
Fig.20 Inconsistency estimates of the network meta-analysis PD: difference in probing pocket depth change.
CAL: difference in clinical attachment level change.
Fig.21 Funnel plot of random effects meta-analysis evaluating the difference in probing pocket depth change in short-term follow up (≤ 3 months).
Fig.22 Funnel plot of random effects meta-analysis evaluating the difference in probing pocket depth change in medium-term follow up (4 months ~ 6 months).
Fig.23 Funnel plot of random effects meta-analysis evaluating the difference in probing pocket depth change in long-term follow up (> 6 months).
Fig.24 Funnel plot of random effects meta-analysis evaluating the difference in clinical attachment level change in short-term follow up (≤ 3 months).
Fig.25 Funnel plot of random effects meta-analysis evaluating the difference in clinical attachment level change in medium-term follow up (4 months ~ 6 months).
Fig.26 Funnel plot of random effects meta-analysis evaluating the difference in clinical attachment level change in long-term follow up (> 6 months).
!
PPD#reduction#
Short/term#(≤#3#months)# Medium/term#(4#~#6#months)# Long/term#(#>#7#months)#
Network meta-analysis Pairwise Meta-analysis Network meta-analysis Pairwise Meta-analysis Network meta-analysis Pairwise Meta-analysis Estimates 95% CI Estimates 95% CI Estimates 95% CI Estimates 95% CI Estimates 95% CI Estimates 95% CI SRP+PDT' v.s.' SRP' 0.44' (0.12,0.76)' 0.45' (0.06,0.83)' 0.20' (70.14,0.53)' 0.22' (0.01,0.42)' 70.13' (70.73,0.46)' 70.13' (70.72,0.45)'
SRP+TCF' v.s.' SRP' 0.57' (0.19,0.95)' 0.56' (0.29,0.82)' 0.64' (0.20,1.08)' 0.66' (0.44,0.88)' ' ' ' '
SRP+MTZ' v.s.' SRP' 0.07' (70.28,0.42)' 0.11' (70.08,0.31)' 0.26' (70.14,0.66)' 0.07' (70.17,0.32)' ' ' ' '
SRP+DOX' 'v.s.' SRP' ' 0.05' (70.42,0.52)' 0.05' (70.24,0.34)' 0.53' (70.15,1.20)' ' ' 0.10' (70.48,0.68)' 0.10' (0.07,0.13)'
SRP+MIN' v.s.' SRP' 0.12' (70.37,0.60)' 0.21' (70.06,0.48)' 0.40' (70.30,1.09)' 0.39' (70.09,0.87)' ' ' ' '
SRP+CHC' v.s.' SRP' 0.67' (0.15,1.19)' 0.70' (70.27,1.67)' 0.65' (0.21,1.10)' 0.91' (70.24,2.06)' ' ' ' '
SRP+CHG' v.s.' SRP' 0.12' (70.62,0.86)' 0.12' (70.20,0.44)' 0.14' (70.61,0.89)' 0.14' (70.21,0.49)' ' ' ' '
SRP+MIM' v.s.' SRP' ' ' ' ' 0.30' (70.54,1.14)' 0.30' (70.21,0.81)' 70.22' (70.98,0.54)' 70.22' (70.71,0.27)'
SRP+TCF' v.s.' SRP+PDT' 0.13' (70.36,0.63)' ' ' 0.45' (70.11,1.00)' ' ' ' ' ' '
SRP+MTZ' v.s.' SRP+PDT' 70.37' (70.85,0.11)' ' ' 0.07' (70.45,0.59)' ' ' ' ' ' '
SRP+DOX' v.s.' SRP+PDT' ' 70.39' (70.96,0.18)' ' ' 0.33' (70.42,1.08)' ' ' 0.23' (70.60,1.07)' ' '
SRP+MIN' v.s.' SRP+PDT' 70.32' (70.91,0.26)' ' ' 0.20' (70.57,0.97)' ' ' ' ' ' '
SRP+CHC' v.s.' SRP+PDT' 0.24' (70.38,0.85)' ' ' 0.46' (70.10,1.01)' ' ' ' ' ' '
SRP+CHG' v.s.' SRP+PDT' 70.32' (71.12,0.49)' ' ' 70.06' (70.88,0.77)' ' ' ' ' ' '
SRP+MIM' v.s.' SRP+PDT' ' ' ' ' 0.10' (70.80,1.01)' ' ' 70.09' (71.05,0.88)' ' '
SRP+MTZ' v.s.' SRP+TCF' 70.50' (70.95,70.05)' 70.51' (70.85,70.17)' 70.38' (70.92,0.16)' 70.45(70.95,0.05)' ' ' ' ' '
SRP+DOX' v.s.' SRP+TCF' ' 70.52' (71.13,0.08)' ' ' 70.12' (70.89,0.66)' ' ' ' ' ' '
SRP+MIN' v.s.' SRP+TCF' 70.46' (70.97,0.06)' 70.51' (70.81,70.22)' 70.25' (70.97,0.47)' 70.28(70.73,0.17)' ' ' ' ' '