國立臺灣大學電機資訊學院電機工程學系 博士論文
Department of Electrical Engineering
College of Electrical Engineering and Computer Science
National Taiwan University Doctoral Dissertation
於社群網路中之高效能鏈結預測與群組查詢 Efficient Link Prediction and Group Query
in Social Networks
陳怡伶 Yi-Ling Chen
指導教授:陳銘憲博士 Advisor: Ming-Syan Chen, Ph.D.
中華民國 106 年 1 月 January, 2017
誌謝
在博士班的旅程中,首先特別要感謝我的指導教授陳銘憲老師,一 路上給予我許多幫助,用幽默的言語鼓勵我,並提供了許多中肯的建 議。陳老師精準的眼光和判斷,在諸多關鍵時刻,為我指引了明確的 方向。而陳老師做研究的積極態度、為人處世的剛柔並濟,都是我學 習的典範。陳老師不僅是我的論文指導教授,更是我人生的良師。
在過去幾年間,有幸能與李旺謙老師、楊得年老師、沈之涯老師、
鄭文皇老師、游創文老師一起合作發表研究成果,每位老師的研究主 題和風格雖不盡相同,但對於學術的熱忱都是一致的。在每篇論文從 無到有的過程中,非常感謝諸位老師的無私相授,讓我學習到許多做 研究的方法和態度。而在美國伊利諾大學芝加哥分校訪問的一年期間,
很幸運地能與 Prof. Philip S. Yu 一起合作,俞教授豐富的學術涵養與對 社會時事的關心,都讓我非常敬佩且獲益良多。
在博士論文計畫審查階段,非常感謝林守德老師和于天立老師指出 許多可以進一步深入研究的要點,讓論文的內容更加豐富。而在博士 學位考試階段,更要感謝陳良弼老師、曾新穆老師、楊得年老師、沈 之涯老師費心審閱並給予指教,諸位老師的建議是讓本篇論文更加進 步的關鍵。
此外,感謝 NetDB 實驗室的每一位成員給予我的陪伴、鼓勵和協 助,你們在我讀博士班的過程中帶來了許多歡笑和溫暖。在學術上因 為與你們一起鑽研而進步,而生活也因為與你們一起分享而精彩,這 份一起努力打拼的革命情感我永遠難忘。也謝謝一路上幫我加油打氣 的許多朋友,特別是遠在美國的信妤學姊和雅婷學姊,以及從高中畢 業後未曾間斷聯繫的瑋玲、秀帆、珮珊、如君,你們對我的關心和幫 助我始終感銘於心。最後,我要向我的家人致上最誠摯的謝意,你們 的愛是最堅強的後盾,支持著我完成博士班這個重要里程碑。
雖然即將結束學生身份,但在人生各個方面,學習的旅程依然持 續。我會帶著大家給予的支持和鼓勵,心懷感激地繼續努力,把博士 班所獲得的能力和知識做出更好的發揮。每一天都是一個新的練習,
願能在每次練習中繼續成長蛻變,往期許的樣貌前進。
摘要
隨著社群網站的普及與蓬勃發展,許多推薦系統開始利用社群網路 中的資訊來提供對使用者有助益的建議,諸多與社群網路分析相關的 研究也隨之展開。近來社群網路的規模快速增長,導致推薦系統的運 算成本顯著增加。對於要處理社群網路資料以提供建議的推薦系統而 言,社群網路的複雜性和巨大規模帶來了沈重的運算負擔。因此,在 本論文中,我們針對社群網路中的三個重要推薦問題進行研究,並致 力於提升它們的運算效率。
首先,我們聚焦於兩個使用者間的關係來研究大型網路中的鏈結預 測問題。在進行鏈結預測時,許多特徵值需要被計算並且整合以便進 行推薦,而這些運算成本會隨網路規模成長而快速增加。先前部分關 於網路處理之研究嘗試透過稀疏化縮小網路規模,以便降低運算成本。
然而,重要的資訊可能在稀疏化過程中被移除,因而導致預測準確率 大幅下降。為了解決這個問題,我們提出了一個名為 DEDS 的架構,
它能建立具有高度準確率的整體分類器,同時能降低預測所需的時間。
DEDS 包含了多樣的稀疏化方法,而這些方法是為了保存網路中的不 同特性所設計的。因此,DEDS 能夠產生出具有顯著結構差異性的稀 疏網路,並且增加整體分類器的多樣性,從而提升預測效果。
接著我們將討論範疇從兩個使用者間的關係擴展到一群使用者之 間的關係,並研究社群群組查詢問題與活動規劃的相關應用。考慮所 有使用者間的社交鏈結以推薦一群相互認識的活動參加者,這是一個 非確定性多項式時間複雜性類(NP-hard)問題。除了找一群相互熟識 的活動參加者外,選定一個所有參加者皆有空的活動時間也是活動規 劃的關鍵要素。因此,我們還需要額外考慮使用者的有空時間,而社 交連結複雜性和使用者行程的多樣性使得這個問題變得更加困難。在 本論文中,我們提出社群時域群組查詢(Social-Temporal Group Query)
來找到合適的活動時間與一群具有最小社群距離總和的參加者。我們 並設計了兩個演算法,分別是 SGSelect 和 STGSelect,它們包含了多種 有效的修剪策略(pruning strategy)來大幅減少執行時間。實驗結果顯 示,我們設計的演算法比起基準方法有明顯的效率提升。我們也進行
了使用者研究,將所提出的演算法與人工活動規劃進行比較。研究結 果顯示所提出的演算法能取得較高品質的答案,且需要的規劃工作量 較少,因此能夠增加使用者發起活動的意願。
最後,我們研究了連續群組查詢問題,以便有效支援一連串的推薦 任務。在規劃活動時,使用者通常不容易將所有條件一次設定完備並 找到完美的活動參加者群組與活動時間。幸好透過前述的社群時域群 組查詢,使用者可以很容易地調整參數並且獲得其他推薦結果以供選 擇。有鑒於使用者可能反覆變動參數以便微調結果,我們進一步提出 連續社群群組查詢(Consecutive Social Group Query)來支援此需求。
考量到利用先前查詢的中間解將能增進後續查詢的效率,我們設計了 一個名為累積搜尋樹(Accumulative Search Tree)的樹狀結構,用緊緻 形式暫存歷史查詢的中間解以供重複利用。為了提升查找效率,我們 進一步設計了一個名為社群邊界(Social Boundary)的索引結構,在處 理特定參數的連續社群群組查詢時,可快速地取得所需使用的中間解。
根據實驗結果顯示,透過所設計的暫存機制,連續查詢所花的處理時 間將可進一步被顯著降低。
關鍵字: 演算法設計與分析、社群網路、鏈結預測、網路稀疏化、
查詢處理、索引結構
Abstract
As the development and popularization of social networking websites, many recommendation systems tend to leverage the information in social net- works to provide helpful suggestions for users, and a great deal of research studies on social network analysis are thereby motivated. Recently, the sizes of social networks have been increasing rapidly, and this growth results in a significant increase in the computational cost of the sophisticated recommen- dations. The huge size and complexity of social networks create a consid- erable burden for recommendation systems while processing the information from social networks to provide suggestions. Therefore, in this dissertation, we study three important recommendation problems in social networks and aim to improve their efficiency.
First, we focus on the relationship between two users and study the link prediction problem in large-scale networks. During the link prediction, nu- merous feature values need to be calculated and then combined to make rec- ommendations, and the computational cost grows quickly as the network size becomes larger. Some previous studies involving network processing attempt to lower the computational cost by reducing the network size via sparsifica- tion. However, sparsification might remove important information and hurt the prediction accuracy. To address this issue, we propose a framework called Diverse Ensemble of Drastic Sparsification (DEDS), which constructs ensem- ble classifiers with good accuracy while keeping the prediction time short.
DEDS includes various sparsification methods that are designed to preserve different measures of a network. Therefore, DEDS can generate sparsified networks with significant structural differences and increase the diversity of the ensemble classifier, which is key to improving prediction performance.
Second, we extend the scope from the relationship between two users to the relationship among a group of users, and study the social group query problem with its applications in activity planning. Considering social links among all users to recommend a mutually acquainted group of attendees for
an activity is an NP-hard problem. In addition to finding a group of atten- dees familiar with each other, selecting an activity period available to all is also essential for activity planning. Therefore, we need to further consider the available time of users, which makes the problem even harder due to the com- plexity of social connectivity and the diversity of user schedules. In this dis- sertation, we propose the Social-Temporal Group Query (STGQ) to find suit- able time and attendees with minimum total social distance. We design two algorithms, SGSelect and STGSelect, which include various effective pruning strategies to substantially reduce running time. Experimental results indicate that SGSelect and STGSelect are significantly more efficient than baseline approaches. We also conduct a user study to compare the proposed approach with manual activity coordination. The results show that our approach ob- tains higher quality solutions with less coordination effort, thereby increasing users’ willingness to organize activities.
Finally, we study the consecutive group query problem to support a se- quence of recommendations. When planning an activity, it is difficult for a user to specify all the conditions right at once to find the perfect group of at- tendees and time. Fortunately, with the aforementioned social-temporal group query, it is easy for the user to tune the parameters to find alternative recom- mendations. As users may iteratively adjust query parameters to fine tune the results, we further propose Consecutive Social Group Query (CSGQ) to support such needs. Envisaging that exploiting the intermediate solutions of previous queries may improve processing of the succeeding queries, we de- sign a new tree structure, namely, Accumulative Search Tree, which caches the intermediate solutions of historical queries in a compact form for reuse. To facilitate efficient lookup, we further propose a new index structure, called So- cial Boundary, which effectively indexes the intermediate solutions required for processing each CSGQ with specified parameters. According to the exper- imental results, with the caching mechanisms, processing time of consecutive queries can be further reduced considerably.
Keywords: Algorithm Design and Analysis, Social Networks, Link Pre- diction, Network Sparsification, Query Processing, Index Structure
Contents
口試委員會審定書 i
誌謝 iii
摘要 v
Abstract vii
1 Introduction 1
1.1 Motivation and Overview of the Dissertation . . . 1
1.1.1 Efficient Link Prediction in Large-Scale Networks . . . 3
1.1.2 Efficient Social-Temporal Group Query . . . 4
1.1.3 Efficient Consecutive Group Query Processing . . . 4
1.2 Organization of the Dissertation . . . 5
2 Ensemble of Diverse Sparsifications for Link Prediction in Large-Scale Net- works 7 2.1 Introduction . . . 7
2.2 Related Works . . . 10
2.3 Framework Overview . . . 12
2.3.1 Proximity Measures in Link Prediction . . . 12
2.3.2 Supervised Framework for Link Prediction . . . 13
2.3.3 Data and Evaluation Metrics . . . 15
2.4 Diverse Ensemble of Drastic Sparsification . . . 15
2.4.1 Diverse Sparsification Methods . . . 16
2.4.2 Ensemble with Diversity . . . 19
2.4.3 Feature Subset Selection . . . 21
2.5 Strategies for Ensemble Generation . . . 22
2.5.1 Accuracy-Based Weight Setting . . . 23
2.5.2 Ensemble Size Augmentation . . . 26
2.6 Analysis on Accuracy and Efficiency . . . 27
2.6.1 Prediction Accuracy . . . 28
2.6.2 Computational Efficiency . . . 30
2.7 Summary . . . 31
3 Efficient Social-Temporal Group Query with Acquaintance Constraint 33 3.1 Introduction . . . 33
3.2 Related Works . . . 38
3.3 Social Group Query . . . 38
3.3.1 Problem Definition . . . 39
3.3.2 Algorithm Design . . . 41
3.4 Social-Temporal Group Query . . . 52
3.4.1 Problem Definition . . . 52
3.4.2 Algorithm Design . . . 53
3.5 Experimental Results . . . 58
3.5.1 Experiment Setup . . . 58
3.5.2 Performance Analysis of SGQ and STGQ . . . 59
3.5.3 User Study of Manual Activity Coordination . . . 66
3.6 Summary . . . 68
4 Efficient Processing of Consecutive Group Queries for Social Activity Plan- ning 69 4.1 Introduction . . . 69
4.2 Related Works . . . 71
4.3 Consecutive Social Group Query . . . 72
4.3.1 Accumulative Search Tree and Social Boundary . . . 73
4.3.2 Solution Acquisition Using AST and SB . . . 76
4.4 Index Construction and Maintenance . . . 78
4.4.1 Node Indexing of AST Using SB . . . 78
4.4.2 Updating of AST and SB . . . 87
4.5 Solution Optimality and Extensions . . . 89
4.5.1 Solution Optimality . . . 89
4.5.2 Extensions in Temporal Dimension . . . 93
4.6 Experimental Results . . . 94
4.6.1 Performance Analysis of CSGQ . . . 95
4.7 Summary . . . 98
5 Conclusion and Future Work 99 Bibliography 101 Appendices 109 A Detailed Proof . . . 109
A.1 Proof of Theorem 4.5.1 . . . 109
B Pseudo Codes . . . 112
List of Figures
2.1 Flow chart of the DEDS framework. . . 9 2.2 An illustrative example for the usage of the three snapshots in the DEDS
framework, where CN , J C, and P A stand for the proximity measures common neighbors, Jaccard’s coefficient, and preferential attachment, re- spectively. The thick lines indicate the newly generated edges which do not exist in the preceding snapshot. . . 13 2.3 (a) An example network with its four different sparsified networks, (b),
(c), (d), (e), obtained from degree-based sparsification, random-walk-based sparsification, short-path-based sparsification, and random sparsification, respectively. . . 19 2.4 Performance comparison between the ensemble without diversity and the
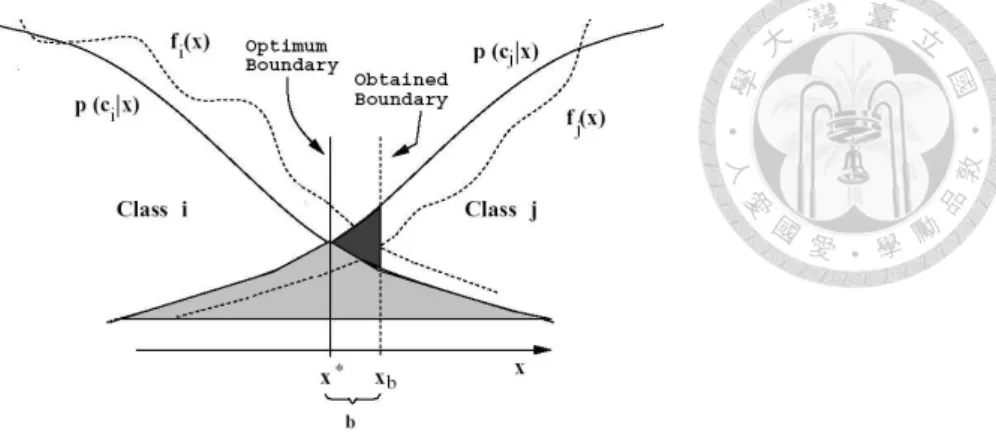
ensemble with diversity. (condmat, sparsification ratio = 10%) . . . 20 2.5 Error regions associated with approximating the a posteriori probabilities
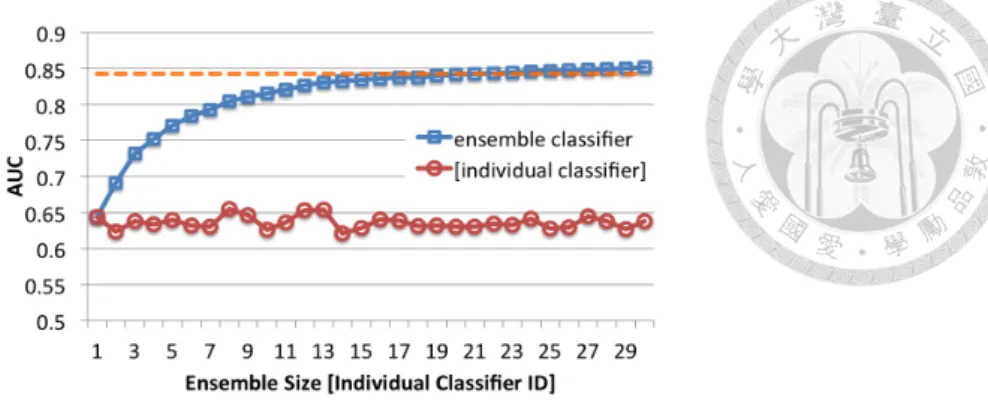
[56]. . . 23 2.6 Comparison of AUC for different ensemble sizes. The dash line indicates
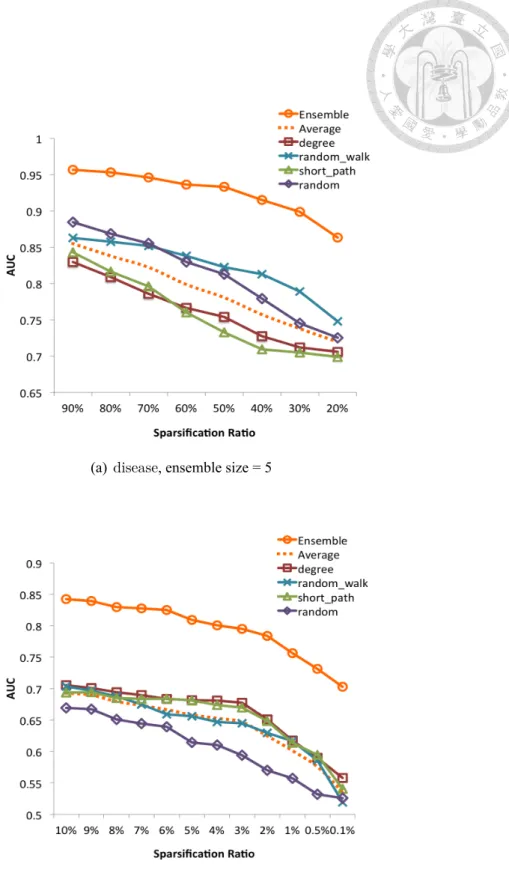
the AUC of the classifier trained from the original network. (condmat, sparsification ratio = 15%) . . . 27 2.7 Performance of four different individual classifiers, their average (denoted
as ”Average”), and the ensemble classifier at different sparsification ratios. 29
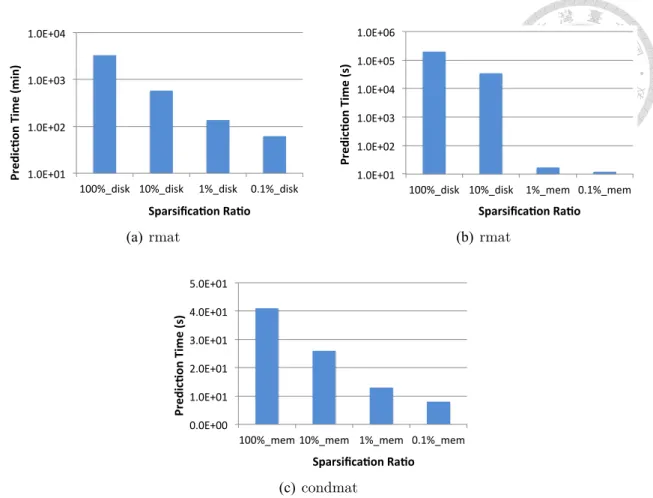
2.8 Running time under different sparsification ratios: (a) the network is stored in the disk, (b) the original network is stored in the disk but can fit into main memory after being sparsified, and (c) the network is cached in main
memory. . . 31
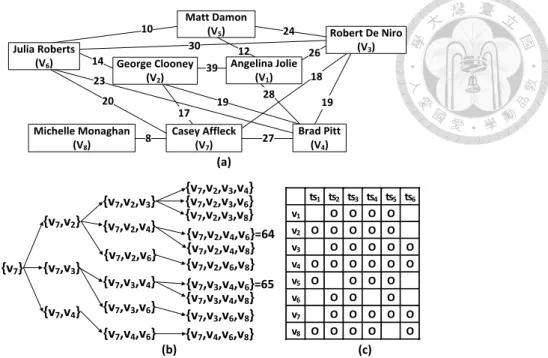
3.1 An illustrative example for STGQ. (a) The sample social network, (b) the dendrogram of candidate group enumeration and (c) schedules of candi- date attendees. . . 35
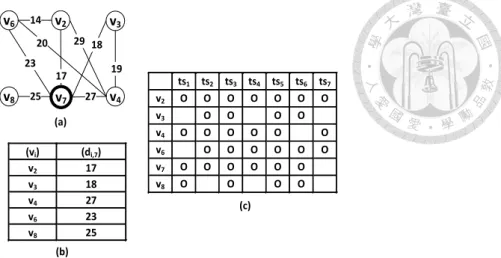
3.2 Another illustrative example for SGQ and STGQ. (a) The sample social network, (b) the social distances of candidate attendees and (c) the sched- ules of candidate attendees. . . 50
3.3 Experimental results of SGQ. . . 60
3.4 Analysis on pruning ability of proposed strategies. . . 62
3.5 Experimental results of STGQ. . . 64
3.6 Experimental results with the YouTube dataset. . . 65
3.7 Experimental results of the user study. . . 66
4.1 T1and T2are two dendrograms with different k, and T3is the accumulative search tree. . . 73
4.2 An illustrative example for CSGQ. (a) The sample social network, (b) the initial accumulative search tree and (c) the accumulative search tree after the second query. . . 77
4.3 Experimental results of CSGQ. . . 96
List of Tables
2.1 Statistics of network characteristics for different sparsified networks. . . . 19 3.1 The percentage of prunings located near the root of the dendrogram (i.e.,
with|VS| ≤ ⌊p2⌋). . . 63 4.1 The (s,k)-SBs constructed after the first SGQ. . . . 76 4.2 (a) The social distances from different vertices to v7 under various s, and
(b) variations of node P 5. . . . 83 4.3 The (s,k)-SBs after updated according to the second SGQ. . . . 88
Chapter 1 Introduction
1.1 Motivation and Overview of the Dissertation
As the development and popularization of social networking websites, many recom- mendation systems tend to leverage the information in social networks to provide helpful suggestions for users, and a great deal of research studies on social network analysis are thereby motivated. For example, link prediction can recommend movies or restaurants to users based on their friends’ opinions, and it can also suggest people that users may be friend with (e.g., the “people you may know” feature in Facebook and LikedIn). Re- cently, the sizes of social networks have been increasing rapidly, and this growth results in a significant increase in the computational cost of the sophisticated recommendations. For example, the number of monthly active users on Facebook reaches 1.79 billion in 2016.1 The huge size and complexity of social networks create a considerable burden for rec- ommendation systems while processing the information from social networks to provide suggestions. Therefore, in this dissertation, we study three important recommendation problems in social networks and aim to improve their efficiency. The challenges of these recommendation problems are introduced below.
First, we focus on the relationship between two users and study the link prediction problem in large-scale networks. During the link prediction, numerous feature values
1The statistics provided by Facebook. http://newsroom.fb.com/company-info/.
need to be calculated and then combined to make recommendations, and the computational cost grows quickly as the network size becomes larger. Some previous studies involving network processing attempt to lower the computational cost by reducing the network size via sparsification. However, sparsification might remove important information and hurt the prediction accuracy. Therefore, the primary challenge is to reduce the network size considerably while maintaining high prediction accuracy.
Second, we extend the scope from the relationship between two users to the relation- ship among a group of users, and study the social-temporal group query problem with its applications in activity planning. While the first problem we study (i.e., link prediction) focuses on predicting the existence of a link between particular two users, the second prob- lem considers existing links among all users to recommend a mutually acquainted group of attendees for an activity. This is an NP-hard problem, and the computational cost also grows rapidly as the network size increases. In addition to finding a group of attendees familiar with each other, selecting an activity period available to all attendees is also es- sential for activity planning. Therefore, we need to further consider the available time of users, which makes the problem even harder due to the complexity of social connectivity and the diversity of user schedules.
Third, we study the consecutive group query problem to support a sequence of recom- mendations. When planning an activity, it is difficult for a user to specify all the condi- tions right at once to find the perfect group of attendees and time. Fortunately, with the aforementioned social-temporal group query, it is easy for the user to tune the parameters to obtain alternative recommendations. Allowing tuning parameters to try consecutive queries easily is a great advantage of the planning service over the current practice of manual planning. However, answering each of the consecutive queries individually will lead to repeated exploration of similar solution space, since these queries are issued by the same user with slightly adjusted parameters. Therefore, new challenges arise in the design of an effective index structure for maintenance and examination of the intermediate results to facilitate efficient processing of consecutive queries.
In the following, we provide overviews for the aforementioned three problems studied
in this dissertation and the proposed solutions.
1.1.1 Efficient Link Prediction in Large-Scale Networks
Since managing massive networks is complex and time-consuming, various studies have focused on network sparsification, simplification, and sampling [16] [47] [25] [33]
[45] [54]. Many of these algorithms are designed to preserve certain properties of inter- est while reducing the size of networks, so that the sparsified or simplified networks may remain informative for future targeted applications. For example, the simplification al- gorithm in [16] is designed as a preprocessing step prior to network visualization, while the sparsification algorithm in [47] is designed to sparsify the network before clustering.
These existing algorithms are effective in their target applications. However, to the best of our knowledge, none of these works has been specifically designed with classifier ensem- bling to facilitate link prediction. Such algorithms may remove the part of the network that is informative for link prediction, and hence lead to a substantial decrease in prediction accuracy.
To address this issue, we propose a framework called Diverse Ensemble of Drastic Sparsification (DEDS), which constructs ensemble classifiers with good accuracy while keeping the prediction time short. DEDS includes various sparsification methods that are designed to preserve different measures of a network. Therefore, DEDS can generate sparsified networks with significant structural differences and increase the diversity of the ensemble classifier, which is key to improving prediction performance. According to the experimental results, when a network is drastically sparsified, DEDS effectively relieves the drop in prediction accuracy and raises the AUC value. With a larger sparsification ratio, DEDS can even outperform the classifier trained from the original network. As for the efficiency, the prediction cost is substantially reduced after the network is sparsified.
If the original network is disk-resident but can fit into main memory after being sparsified, the improvement is even more significant.
1.1.2 Efficient Social-Temporal Group Query
For social activity planning, three essential criteria are important: (1) finding attendees familiar with the initiator, (2) ensuring most attendees have tight social relations with each other, and (3) selecting an activity period available to all. In this dissertation, we propose the Social-Temporal Group Query (STGQ) to find suitable time and attendees with minimum total social distance. By minimizing the total social distance among the attendees, we are actually forming a cohesive subgroup in the social network. In the field of social network analysis, research on finding various kinds of subgroups, such as clique, k-plex and k-truss has been conducted (e.g., [6, 18, 43, 55, 59]). There are also related works on group formation (e.g., [3, 44, 57]), team formation (e.g., [2, 24, 41]), and group query (e.g., [27,28,60]). While these works focus on different scenarios and aims, none of them simultaneously encompass the social and temporal objectives to facilitate automatic activity planning. Therefore, the STGQ problem is not addressed previously.
In our study of STGQ, we first prove that the problem is NP-hard and inapproximable within any ratio. Next, we design two algorithms, SGSelect and STGSelect, which in- clude various effective pruning techniques to substantially reduce running time. Experi- mental results indicate that SGSelect and STGSelect are significantly more efficient and scalable than the baseline approaches. Our research results can be adopted in social net- working websites and web collaboration tools as a value-added service. We also conduct a user study to compare the proposed approach with manual activity coordination. The re- sults show that our approach obtains higher quality solutions with less coordination effort, thereby increasing users’ willingness to organize activities.
1.1.3 Efficient Consecutive Group Query Processing
According to the feedbacks from the user study we conduct, it is difficult for an activ- ity initiator to specify all the conditions right at once to find the perfect group of attendees and time, and hence the initiator tends to tune the parameters to find alternative solutions.
As users may iteratively adjust query parameters to fine tune the results, we further study
the problem of Consecutive Social Group Query (CSGQ) to support such needs. Some ex- isting studies (e.g., [14, 34, 63, 64]) return multiple subgraphs with diverse characteristics in one single query. However, since these studies are not specifically designed for activ- ity planning, social connectivity and tightness are not their major concern. Therefore, the returned subgroups are not guaranteed to achieve social cohesiveness. Moreover, without feedback and guidance from user-specified parameters, most returned subgraphs in the diversified query are likely to be redundant (i.e., distant from the desired results of users).
On the other hand, session query and reinforcement learning in retrieval (e.g., [20,26,50]) that allow users to tailor the query have attracted increasing attentions. However, these studies are designed for document retrieval and hence cannot handle the social network graph and user schedules. Therefore, these aforementioned research works are not appli- cable for automatic activity planning, and the CSGQ problem is not addressed previously.
Anticipating that the users would not adjust the parameters drastically, we envisage that exploiting the intermediate solutions of previous queries may improve processing of succeeding queries. In our study of CSGQ, we design two new data structures to facilitate the above idea and efficiently support a sequence of group queries with varying param- eters. We first design a new tree structure, namely, Accumulative Search Tree, which caches the intermediate solutions of historical queries in a compact form for reuse. To fa- cilitate efficient lookup, we further propose a new index structure, called Social Boundary, which effectively indexes the intermediate solutions required for processing each CSGQ with specified parameters. According to the experimental results, with the caching mech- anisms, processing time of consecutive queries can be further reduced considerably.
1.2 Organization of the Dissertation
The rest of this dissertation is organized as follows. In Chapter 2, we propose the DEDS framework consisting of four different sparsification methods and show that, while using only a small portion of the edges causes considerable performance deterioration, our ensemble classifier with high diversity can counter the drop in prediction accuracy. In
Chapter 3, we formulate STGQ for automatic activity planning, and propose Algorithm SGSelect and Algorithm STGSelect with various strategies to find the optimal solution ef- ficiently. In Chapter 4, we further introduce CSGQ, and then design new data structures to avoid redundant exploration of solution space and speed up the processing of consecutive queries. Finally, Chapter 5 concludes this dissertation and presents the future directions.
Chapter 2
Ensemble of Diverse Sparsifications for Link Prediction in Large-Scale
Networks
2.1 Introduction
Link prediction is to forecast the existence of a link between two vertices, and it is an important research topic in network analysis, since many major problems involving net- works can benefit from the process. Recently, the sizes of networks have been increasing rapidly, and this growth results in a significant increase in the computational cost of link prediction. Moreover, these networks may become too large to be stored in main mem- ory. Consequently, processing these networks requires frequent disk access, which may lead to considerable deterioration in performance. As a result, prediction tasks can take days to complete, meaning that dynamic friend suggestions or product recommendations cannot be made to users or customers in a timely manner, and the recommendations may therefore become less useful as time passes.
In link prediction, there are several measurements, known as proximity measures, used to indicate how likely it is for a non-neighboring vertex pair to be connected via an edge in the near future. A possible solution for speeding up link prediction is to design algo-
rithms to approximate each of the proximity measures. For example, the authors in [51]
and [49] proposed methods to achieve a close approximation of proximity measures such as Katz [22] and rooted PageRank [29]. However, building robust and high-accuracy classifiers for link prediction often requires various proximity measures. It would be very complicated if we were to design different algorithms to approximate each of these prox- imity measures. Therefore, a general and flexible solution for lowering computational costs is required.
Inspired by previous research that simplifies large networks to decrease computational costs, we found that reducing the size of networks provides a more general solution.1 Once a network has been sparsified, most proximity measures can benefit from the size reduction of the network and can be calculated faster. If the network is too large to be stored in main memory, decreasing its size also helps to lower the number of disk accesses. Furthermore, when the sparsification ratio is sufficiently small, the sparsified network may be able to fit into main memory, which means the burden of disk access is relieved. However, with such drastic sparsification, many edges in the network are removed, and the information that can be used in link prediction becomes rather limited. In turn, the prediction accuracy would drop significantly under such severe conditions. Therefore, the primary challenge is to reduce the network size considerably while maintaining high prediction accuracy.
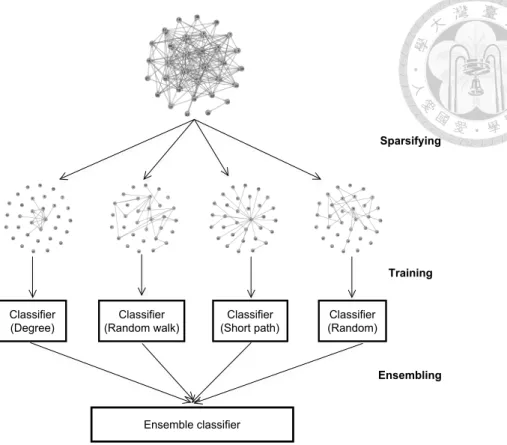
In this chapter, we address this issue by proposing a sparsification framework for link prediction called Diverse Ensemble of Drastic Sparsification (DEDS), which consists of sparsifying, training, and ensembling, as shown in Figure 2.1. Specifically, we design four different methods to sparsify the original network, train individual classifiers from the sparsified networks, and ensemble these classifiers appropriately to improve prediction performance. The rightmost sparsified network in Figure 2.1 is obtained from the most straightforward random sparsification. In addition, DEDS incorporates three more so- phisticated sparsification methods, which are based on heuristics for preserving the edges required by different proximity measures. DEDS is able to generate sparsified networks
1Certain previous studies have proposed methods that remove vertices and edges to simplify the network (e.g., [25] and [45]), while other methods only remove edges (e.g., [33] and [47]). In our study, we do not remove vertices, since any vertex may be the target that we want to generate a prediction for.
Classifier (Degree)
Classifier (Random walk)
Classifier (Short path)
Classifier (Random)
Sparsifying
Ensemble classifier
Training
Ensembling
Figure 2.1: Flow chart of the DEDS framework.
with significant structural differences, and this increases the diversity of the correspond- ingly trained classifiers, which is key to creating an effective ensemble classifier. As shown in the experimental results, the proposed DEDS framework can effectively relieve the drop in prediction accuracy, while considerably reducing running time.
The main contributions of this chapter are summarized as follows.
• We propose a novel network sparsification framework called DEDS to slim down large networks while preserving important proximity measures that are used in link prediction. Specifically, we design four different sparsification methods by cate- gorizing the proximity measures and then devising heuristics to preserve the edges required by these measures. The proposed DEDS framework can generate sparsi- fied networks with significant structural differences and increase the diversity of the ensemble classifier. We also prove that adopting accuracy-based weighting enables DEDS to further reduce the prediction error. Experimental results show that when the network is drastically sparsified, DEDS can effectively relieve the drop in pre- diction accuracy and considerably raise the AUC value. With a larger sparsification
ratio, DEDS can even outperform the classifier trained from the original network.
• Our proposed DEDS framework is able to significantly reduce the running time of link prediction tasks. According to the experimental results, the prediction cost is substantially reduced after the network is sparsified. Moreover, if the network is too large to be stored in main memory, DEDS helps to lower the number of disk accesses by reducing the network size. When the sparsification ratio is sufficiently small, DEDS provides further efficiency by relieving the burden of disk access, since the sparsified network can fit into main memory.
• In the proposed DEDS framework, all the individual classifiers remain unentan- gled before the final decision is generated, meaning that each individual classifier can be trained and run independently. This enables DEDS to fully utilize all the CPUs or cores to simultaneously train and run the maximum number of individual classifiers. As a result, DEDS can maximize the ensemble size based on the user’s computational ability and considerably increase prediction accuracy.
The rest of this chapter is organized as follows. In Section 2.2, we introduce related works. Section 2.3 provides preliminaries for a supervised framework of link prediction, and describes the datasets and evaluation metrics used throughout this study. In Section 2.4, we propose four different sparsification methods and show that, while using only a small portion of the edges causes considerable performance deterioration, our ensemble classifier with high diversity can counter the drop in prediction accuracy. In Section 2.5, we analyze two strategies which further raise the performance of the ensemble classifier.
More detailed experimental results, such as efficiency analysis, are provided in Section 2.6. We summarize this chapter in Section 2.7.
2.2 Related Works
Since managing massive networks is complex and time-consuming, various studies have focused on network sparsification, simplification, and sampling [16] [47] [25] [33]
[45] [54]. Many of these algorithms are designed to preserve certain properties of inter- est while reducing the size of networks, so that the sparsified or simplified networks may remain informative for future targeted applications. For example, the simplification al- gorithm in [16] is designed as a preprocessing step prior to network visualization, while the sparsification algorithm in [47] is designed to sparsify the network before clustering.
These existing algorithms are effective in their target applications. However, to the best of our knowledge, none of these works has been specifically designed with classifier en- sembling to facilitate link prediction. Such algorithms may remove the part of the network that is informative for link prediction, and hence lead to a substantial decrease in predic- tion accuracy. Moreover, the existing network sparsification algorithms are not designed to deal with drastic sparsification, and most of them have used a sparsification ratio in the range of tens of percent. In our study, we make use of even smaller sparsification ra- tios (e.g., 5%) and explain how prediction accuracy can be maintained under such severe conditions.
Certain previous studies have succeeded in preserving one of the proximity measures used in the link prediction task. For example, the method in [45] can recover the shortest- path distance between a vertex pair from the simplified graph, while that in [54] can pre- serve the quality of the best path between a vertex pair. However, various proximity measures are required to achieve high accuracy in link prediction; thus, merely focusing on a single measure is not sufficient. In this chapter, we first discuss the properties of the different proximity measures used in link prediction, and then we propose a novel spar- sification framework that aims to preserve the discrimination ability of these measures to provide good prediction accuracy.
Another area of related work is graph partitioning, which includes a focus on handling large-scale graphs. Many useful graph partitioning tools already exist (e.g., Chaco [15]
and METIS [21]), and certain recent studies continue to focus on graph partitioning [62]
[53]. A common goal of graph partitioning is to divide a large graph into smaller disjoint components of approximately the same size, which together can cover the entire origi- nal graph. In our work, we also create multiple small and even-sized components from
the original large-scale network. However, these components are not necessarily disjoint, and some informative edges may exist in multiple components. Furthermore, these com- ponents together are not required to cover the entire original network. Each component may include only a small portion of edges (e.g., 1% of the original network), and even if tens of components are created, the edges used are still less than the edges in the original network.
2.3 Framework Overview
Before introducing the details of the DEDS framework, we provide in Section 2.3.1 preliminaries on the proximity measures that are commonly used in link prediction tasks.
We also introduce in Section 2.3.2 the method for leveraging these proximity measures under a supervised link prediction framework. In Section 2.3.3, we describe the datasets and the evaluation metrics used throughout this chapter.
2.3.1 Proximity Measures in Link Prediction
Most existing link prediction methods involve calculating proximity measures for a non-neighboring vertex pair, viand vj, where the higher the measures are, the more likely vi and vj are to be connected via an edge in the near future. According to [29], most basic link prediction methods generate proximity measures based on the neighborhood information of vi and vj, or on the path information between vi and vj. The methods that rely on neighborhood information include common neighbors, Jaccard’s coefficient [46], Adamic/Adar [1], and preferential attachment [5]. The common neighbors method calculates the number of neighbors that vi and vj have in common, while the Jaccard’s coefficient method modifies the common neighbors method by normalizing it with the total number of neighbors that vi and vj have. The Adamic/Adar method modifies the common neighbors method by giving more weight to the neighbor that is rarer (i.e., the neighbor that is connected to fewer other vertices). In the preferential attachment method, the proximity measure is determined by multiplying the number of neighbors of viand vj.
(time)
1st snapshot at t1 2nd snapshot at t2 3rd snapshot at t3
v2
v6
v1 v3
v4 v5
v7
v2
v6
v1 v3
v4 v5
v7 C N J C P A …
( V1, V2) 1 1 1 …
( V1, V3) 1 1 / 2 2 … ( V1, V4) 0 0 1 … ( V1, V7) 0 0 1 …
… … … … …
v2
v6
v1 v3
v4 v5
v7
v2
v6
v1 v3
v4 v5
v7
C N J C P A … P r e d i c t i o n ( V1, V3) 1 1 / 2 2 … y e s
( V1, V4) 0 0 2 … n o
( V1, V7) 0 0 2 … n o
( V2, V3) 1 1 / 2 2 … y e s
… … … … … …
v2
v6
v1 v3
v4 v5
v7
L a b e l ( V1, V2) p o s it i v e ( V1, V3) n e g a t i v e ( V1, V4) n e g a t i v e
… …
sparsify sparsify
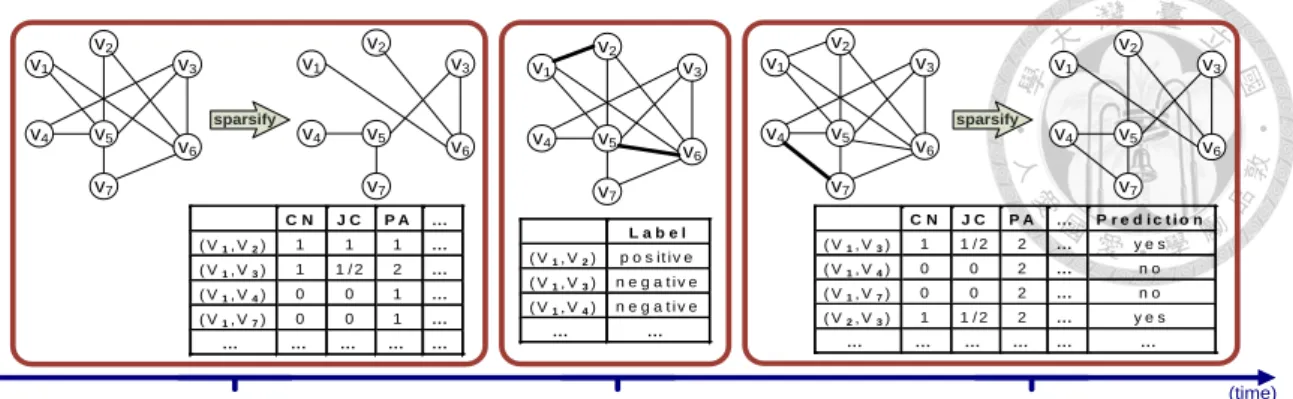
Figure 2.2: An illustrative example for the usage of the three snapshots in the DEDS framework, where CN , J C, and P A stand for the proximity measures common neighbors, Jaccard’s coefficient, and preferential attachment, respectively. The thick lines indicate the newly generated edges which do not exist in the preceding snapshot.
The methods that rely on path information include Katz [22], hitting time [29], variants of PageRank [7] (e.g., rooted PageRank [29]), SimRank [19], and PropFlow [31]. A description and comparison of the methods listed above (with the exception of the recently proposed PropFlow) can be found in [29].
2.3.2 Supervised Framework for Link Prediction
In the proposed DEDS framework, we adopt the common proximity measures men- tioned in the previous subsection within a supervised framework. As shown in [31], using scores generated from the same proximity measure, a supervised method can outperform an unsupervised method. A supervised method is also more capable of handling the dy- namics and capturing the interdependency of topological properties in the network. There- fore, recent link prediction works have begun to use a supervised framework.
A supervised framework like DEDS works as illustrated in Figure 2.2. The first snap- shot of the original network is taken to generate feature values (i.e., the scores generated from proximity measures). Before computing the proximity measures of vertex pairs in the first network snapshot, we sparsify the snapshot using the proposed sparsification meth- ods, which will be described later in Section 2.4.1. The computational cost of calculating proximity measures can be reduced considerably, since the network size is significantly lowered. Note that before sparsifying the network snapshot, the non-neighboring vertex
pairs are marked in main memory or the disk.2 This prevents unnecessary prediction of the vertex pairs that are originally connected but have their connecting edges removed during sparsification. For example, even though the edge between the vertex pair (v1, v5) is removed during sparsification, we can still avoid making a redundant prediction on this vertex pair.
After a given period, a second snapshot of the network is taken.3 Since the network is dynamic, this second snapshot can be used to verify whether an originally non-neighboring pair vi and vj in the first snapshot is now connected or not, and class labels are thereby generated. Taking the example illustrated in Figure 2.2, the vertex pair (v1, v2) is newly connected in the second snapshot, and hence this pair is a positive instance. While the first snapshot is sparsified in order to generate proximity measures efficiently, the second snapshot is fully preserved. This ensures that the class labels generated from the second snapshot are all correct.
Besides the first and the second network snapshots, there is a third snapshot used to capture the most recent network. We use this last network snapshot to calculate the latest proximity measures and make predictions for users. Since the goal of the drastic sparsi- fication is to generate the prediction much faster, the third snapshot is sparsified before calculating the proximity measures. Some may think that the training process using the first and second network snapshots can be conducted offline without rushing, so we do not need to sparsify the first network snapshot. However, the sparsification of the first snapshot is actually necessary and even vital to prediction accuracy. If the first snapshot is not sparsified, most proximity measures, such as the common neighbors and the Katz, tend to have much higher values. As a consequence, the classifier trained with these over- estimated values cannot make accurate predictions in the third network snapshot, which is sparsified and tends to have lower values.
2With the help of data structures such as B-tree, we can decide quickly whether a vertex pair has a link in the original network or not, even if this information is stored in the disk.
3The timing for taking these snapshots of the network (i.e., t1and t2) is discussed in [31].
2.3.3 Data and Evaluation Metrics
To evaluate the improvement of prediction accuracy introduced by the DEDS frame- work, we use two real datasets provided in the LPmade package [30]: condmat (110.5K edges) and disease (15.6K edges). Besides the real datasets, we also carry out the evalua- tion of efficiency on a larger synthetic dataset rmat (10M edges), which is produced using the R-MAT [8] graph generating algorithm. The R-MAT algorithm is able to quickly gen- erate large networks that match patterns in real-world networks. The parameters a, b, c, and d used in network generation are set to be 0.6, 0.15, 0.15, and 0.1, which follow the settings in the previous study [32].
In terms of evaluation metrics, the receiver operating characteristic (ROC) curve is an effective method for illustrating the performance of a binary classifier system, since it shows the performance of the classifier under the entire operating range. The ROC curve displays the true positive rate (TPR) versus the false positive rate (FPR), and each point on this curve is produced by varying the decision threshold of the proximity measures.
Since it would be too space-consuming to generate ROC curves for all of the classifiers under various sparsification ratios, the following evaluation is based on the area under the ROC curve (AUC). AUC is a related scalar measure of ROC, and it can be seen as a summary of performance. Besides using AUC to evaluate the performance over all decision thresholds, we also adopt the common mean square error (MSE) to measure the performance at a specific decision threshold that is selected during the training phase.
2.4 Diverse Ensemble of Drastic Sparsification
When only a small portion of edges are preserved during sparsification, the information that can be used in link prediction becomes extremely limited. Therefore, the challenge is to maintain high prediction accuracy while drastically reducing the network size. The proposed DEDS framework solves this problem by using the wisdom of crowds; that is, ensemble. The concept of ensemble is to build different experts (i.e., individual classifiers) and then let them vote. Just as considering various opinions may help people make better
decisions, using different classifiers allows for more accurate link prediction. One popular and simple ensemble method is bagging, which assigns equal weighting to each classifier.
Bagging can be used to average the numerical outputs or vote for the classified label, and it provides the DEDS framework with more flexibility in the selection of classification algorithms. In this study, we present the results with the classic C4.5 [40], and the results with naive Bayes show similar trends. However, if a particular classification algorithm is found to be more suited to handling a certain network, users can easily replace the current algorithm used in DEDS without modifying the framework structure.
To obtain an effective ensemble classifier, previous studies [56] [17] [23] suggest that the diversity among individual classifiers plays an important role. Without diversity, the individual classifiers tend to produce similar judgments, and combining these similar judg- ments will not improve the final decision. Therefore, in order to increase diversity and preserve various important properties, DEDS incorporates four sparsification methods to generate a variety of sparsified networks. We introduce these sparsification methods in Section 2.4.1, and in Section 2.4.2, we analyze how the ensemble with diversity can result in a better performance. In Section 2.4.3, we further accelerate the link prediction process by feature selection.
2.4.1 Diverse Sparsification Methods
In the DEDS framework, the proximity measures described in Section 2.3 are adopted as features for building the classifier for link prediction. Since these proximity measures have different properties, a single type of sparsified network is unable to sufficiently pre- serve them all. Therefore, we generate various types of sparsified networks, and in each network, certain proximity measures can benefit from the edges preserved. As a result, these proximity measures can be more discriminative. Furthermore, as previously men- tioned, diversity is an important factor in obtaining an effective ensemble. By generating different sparsified networks with various sparsification methods, we can increase the va- riety of classifiers trained from these sparsified networks. In the following paragraphs, we
introduce the four sparsification methods used in the DEDS framework, namely, degree- based sparsification, random-walk-based sparsification, short-path-based sparsification, and random sparsification.
• Degree-based sparsification. In degree-based sparsification, each edge is first given a score in proportion to the summation of the degrees at its two ends. We then repeatedly select the edge with the highest score, until the percentage of se- lected edges meets the sparsification ratio. As mentioned, the proximity measures adopted in the DEDS framework can be roughly divided into two categories: one based on neighborhood information, and the other based on path information. Most proximity measures based on neighborhood information involve counting the num- ber of common neighbors. To further illustrate this, let us assume there is a con- nected vertex pair of vx and vy. During sparsification, if the degree of either vxor vyis large, removing the edge connecting the pair may affect many common neigh- bor counts. Let the degree of vxto be dx, which means vxhas dx−1 neighbors other than vy. When we remove the edge connecting vx and vy, the number of common neighbors between vy and each of the dx− 1 neighbors of vx will decrease by one, since vx is no longer a neighbor of vy after sparsification. For the dy − 1 neighbors of vy, the common neighbor vy also disappears between vxand each of these dy− 1 vertices. In total, removing the edge connecting vx and vy may cause as many as dx+ dy− 2 non-neighboring vertex pairs to lose their common neighbors.4 There- fore, we choose to remove the edge with the smaller summation of the degrees at its two ends, in order to reduce the loss of common neighbors.
• Random-walk-based sparsification. Certain proximity measures based on path information (e.g., hitting time, rooted PageRank, and PropFlow) involve random walks between non-neighboring vertices. Therefore, in this sparsification method, we aim to preserve the edges that are most frequently used by the random walk.
We first conduct random walk rehearsals on randomly selected vertex pairs in the
4There are dx+ dy− 2 vertex pairs that lose common neighbors, but only the non-neighboring vertex pairs will affect prediction accuracy. Therefore, dx+ dy− 2 is actually a worst-case analysis.
original network, and then we calculate the score of each edge in proportion to the total visited count during the random walk rehearsals. Thereafter, we repeatedly select the edge with the highest score, until the percentage of selected edges meets the sparsification ratio.
• Short-path-based sparsification. In addition to random walk, certain proximity measures based on path information (e.g., Katz) involve short paths between non- neighboring vertices. Therefore, in this sparsification method, we aim to preserve the edges that appear frequently in certain short paths, as these edges are likely to be shortcuts or important bridges. We first compute the shortest paths that do not exceed a length threshold L, and the score of each edge is calculated in proportion to the frequency that this edge appears in the paths. We then repeatedly select the edge with the highest score, until the percentage of selected edges meets the sparsifica- tion ratio. In most previous studies of link prediction, the path-oriented proximity measures do not involve long paths since they are computationally expensive, and using the maximum length of the paths used in proximity measures (e.g., 5 in [31]) as L will suffice. When the original network is too large to be stored in main mem- ory, the sketch-based index structure proposed in [13] can help to compute the paths much faster, while keeping the estimation error below 1% on average.
• Random sparsification. The random sparsification method is the most straight- forward among the four methods, whereby edges are randomly selected from the original network until the percentage of selected edges meets the sparsification ra- tio. This sparsification prevents the DEDS framework from being over-fitted for any specific type of proximity measure, and also allows the DEDS framework to be more generalized to accommodate potential new proximity measures in the future.
Since the original network is comparatively large, the sparsification process that deals with the original network may take longer. However, the sparsification can be done of- fline, and then predictions can be generated online in a timely fashion using the smaller sparsified network.
(a) (b) (c) (d) (e)
(a)(a)(a)(a)(a) (b)(b)(b)(b)(b) (c)(c)(c)(c)(c) (d)(d)(d)(d)(d) (e)(e)(e)(e)(e)
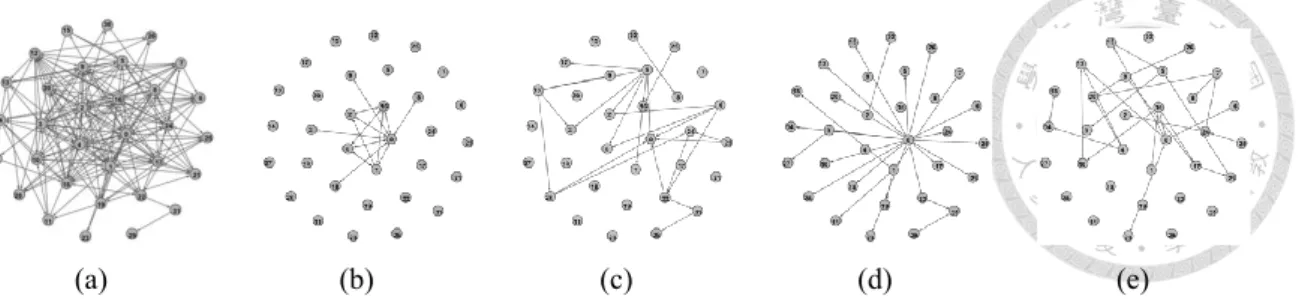
Figure 2.3: (a) An example network with its four different sparsified networks, (b), (c), (d), (e), obtained from degree-based sparsification, random-walk-based sparsification, short- path-based sparsification, and random sparsification, respectively.
Table 2.1: Statistics of network characteristics for different sparsified networks.
Mean SD RSD
Characteristics random_spar diverse_spar random_spar diverse_spar random_spar diverse_spar
Assortativity Coef. -0.244 -0.337 0.018 0.292 7% 86%
Average Clustering Coef. 0.033 0.097 0.006 0.067 17% 69%
Median Degree 2 0.5 0 1 0% 200%
Max Degree 23.25 49.75 0.96 23.82 4% 48%
Number of SCCs 116 258 7.26 90.41 6% 35%
Largest SCC 283.25 129 7.68 104.09 3% 81%
Largest SCC Diameter 7.5 5.5 1.29 2.38 17% 43%
2.4.2 Ensemble with Diversity
Figure 2.3 displays an example network and its four sparsified networks obtained by the sparsification methods introduced in Section 2.4.1. It can be seen that these sparsi- fied networks have significant structural differences. These sparsified networks also ex- hibit different quantitative characteristics. Table 2.1 provides various network statistics to contextualize the diversity of these sparsified networks. Here we compare two groups of sparsified networks, namely, random_spar (which includes four randomly sparsified net- works) and diverse_spar (which includes four sparsified networks obtained from different sparsification methods). For each sparsified network, we calculate various characteristics as described below. To measure the tendency of finding connected vertex pairs that are each highly connected, we use the assortativity coefficient. In order to measure how likely vertices in the network are to be connected in dense groups, we use the average clustering coefficient. To more fully grasp the broad topological structure of the network, we also calculate the size and diameter of the strongly-connected components (SCCs). For sim- plicity and easy comparison, we do not list the values for each of the sparsified networks separately. Instead, we provide summarized statistics for the four sparsified networks in
0 0.05 0.1 0.15 0.2 0.25 0.3 0.35 0.4 0.45 0.5
0.4 0.45 0.5 0.55 0.6 0.65 0.7 0.75 0.8
MSE
AUC
AUC MSE
(a) Four individual classifiers generated from the same type of sparsified networks, and two ensem- ble classifiers without diversity (shown from left to right).
0 0.05 0.1 0.150.2 0.25 0.3 0.35 0.4 0.450.5
0.4 0.45 0.5 0.55 0.6 0.65 0.7 0.75 0.8
MSE
AUC
AUC MSE
(b) Four individual classifiers generated from dif- ferent types of sparsified networks, and two en- semble classifiers with diversity (shown from left to right).
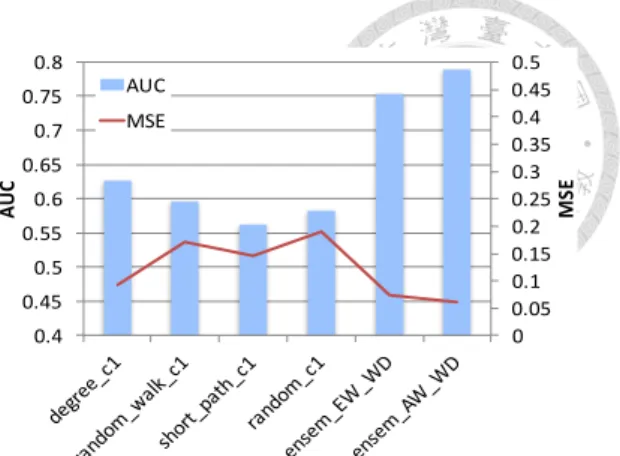
Figure 2.4: Performance comparison between the ensemble without diversity and the en- semble with diversity. (condmat, sparsification ratio = 10%)
each group, which include the mean, the standard deviation (SD), and the relative standard deviation (RSD). The RSD is widely used to measure the degree of dispersion, and a larger RSD means the data has more variability. As the results show, the RSD of diverse_spar is always significantly higher than the RSD of random_spar, which indicates that the network characteristics of the sparsified networks obtained from different sparsification methods are much more diverse.
In Figure 2.4, experimental results are provided to compare the ensemble without di- versity and the ensemble with diversity. Here we present the results with condmat, and the other real dataset disease exhibits similar trends. In Figures 2.4(a) and 2.4(b), there are seven individual classifiers (i.e., random_c1-4, degree_c1, random_walk_c1, and short_path_c1, where the prefix of each classifier indicates its corresponding type of sparsified network), and four ensemble classifiers composed of these individual classi- fiers. Note that the AUC of the individual classifiers is relatively low, with most of them under 0.6. In contrast, if we combine these weak individual classifiers, even the AUC of the worst ensemble classifier can exceed 0.68, which is an improvement of 17% compared with the average of its four individual classifiers.
We can further note that there exists a large difference among the ensemble classi- fiers. The two ensemble classifiers in Figure 2.4(a) (i.e., ensem_EW_WOD and en-
sem_AW_WOD, where WOD means without diversity) can reach 0.68 and 0.71, which is an average improvement of 17% and 22%, respectively. On the other hand, the two en- semble classifiers in Figure 2.4(b) (i.e., ensem_EW_WD and ensem_AW_WD, where WD means with diversity) can reach 0.75 and 0.79, which shows an average improve- ment of 27% and 34%, respectively.5 The ensemble classifiers in Figure 2.4(b) have no larger ensemble size than the ensemble classifiers in Figure 2.4(a), and the key difference that makes the former outperform the later is the diversity. Specifically, the four individ- ual classifiers composing the ensemble classifiers in Figure 2.4(b) are trained from four different types of sparsified networks with significant structural differences, as shown in Figure 2.3 and Table 2.1. In addition to AUC, the ensemble classifiers with higher di- versity also have better MSE values. As shown by the experimental results, the average MSE of the ensemble classifiers in Figure 2.4(b) is reduced by 25% as compared with the average MSE of the ensemble classifiers in Figure 2.4(a). The above analysis indicates that, although the total number of edges preserved in the sparsified networks are limited, ensembling with various types of sparsified networks can increase the diversity to help relieve the drop in accuracy and maintain a solid performance.
2.4.3 Feature Subset Selection
As shown in Section 2.4.2, different types of sparsified networks are diverse and have significant structural differences. Therefore, the features (i.e., the proximity measures) are not likely to be equally effective in the correspondingly trained classifiers. For the applications that need to provide online predictions efficiently, using feature selection to form a proper feature subset for each classifier can further accelerate the prediction and re- duce the delay. Among the existing feature selection algorithms, the category of wrapper methods usually outperforms the category of filters methods, since the former evaluates feature subsets based on the adopted prediction model. However, most wrapper methods need to test numerous combinations of features and hence become computationally in-
5In our study, we also found that weight setting will affect performance, and the difference between equal weighing (denoted with EW) and accuracy-based weighting (denoted with AW) will be analyzed later in Section 2.5.1.
tensive, especially when we have multiple classifiers to train. Therefore, we consider a simple alternative, which evaluates the performance of each feature in different sparsified networks separately.
Specifically, in the preprocessing stage, each feature will have four scores determined by its discrimination ability (e.g., AUC) in the four different sparsified networks. Later in the training process, if any feature has one score below a specified threshold, this feature will not be adopted to make prediction in the corresponding type of sparsified network.
In this way, only the features have enough discrimination ability for this type of sparsified network are kept to build the classifier. An intuitive threshold is the average of all the scores, which picks out features with relatively stronger discrimination ability. If the user wants to further accelerate the online prediction, the threshold can be raised to reduce the number of features.
According to the experimental results, embedding feature selection as a preprocessing stage saves 21% on running time on average, ranging from 15% to 37%. Meanwhile, the AUC of the ensemble classifier only slightly drops by 0.007, which is less than 1%. The results indicate that the feature selection effectively preserves the features with high dis- crimination ability in each sparsified network, and therefore is able to reduce considerable running time without sacrificing much on the prediction accuracy. Moreover, when new features are proposed in the future, it is difficult for users without expert knowledge to decide which ones are worth adopting. The feature selection here can help automatically determine whether the new features perform well enough in a certain sparsified network, and it can also eliminate the outdated features to save computational cost. Therefore, incorporating the feature selection also enhances the flexibility to adopt new features in DEDS.
2.5 Strategies for Ensemble Generation
As shown in Section 2.4, the ensemble classifier with high diversity can greatly out- perform every individual classifier. In this section, we analyze two strategies that further