含電能管理之太陽能與風力複合發電系統的研製
黃仲欽1 蔡政宏2 楊瑞錶2 蔡宗志1
1臺灣科技大學電機系
2中華科技大學電機系
摘 要
本文旨在設計及製作一包含電能管理之太陽能與風力複合型發電系統,該 系統以直流/直流升壓型功率轉換器 (dc/dc boost power converter),搭配最大功 率追蹤 (maximum power point tracking) 控制法則,使太陽能電池與風力發電 機輸出最大功率。另外,文中亦提出直流升/降壓式截波器 (dc boost/buck chopper) 作為蓄電池儲、釋能控制,完成系統能量平衡管理,提高供電可靠度。
在發電系統方面採用三相三階層變流器 (three-phase three-level dc/ac inverter) 作為直流/交流轉換之用,一方面利用三階層架構減少輸出電壓之諧波含量,
另一方面將再生能源 (renewable energies) 輸出之直流電轉變成交流電,供給 三相負載獨立使用或傳輸至電力網路,達到分散式供電系統 (distributed gen- erated system) 之功能。最後本系統完成一 520 W 的獨立供電 (stand-alone) 系 統及市電並聯 (grid-connected) 系統,在獨立供電模式下其額定輸出線電壓有 效值為 220 V,頻率為 60 Hz;在並聯運轉下,可提供實功率及虛功率至電力 網路。整體系統的運轉效率為 83%,三相三階層變流器輸出線電壓之總諧波失 真率 (total harmonic distortion) 為 2.7%,並能符合 IEEE Std. 519 之規範。
關鍵詞: 最大功率追蹤,三相三階層變流器,分散式供電系統,獨立供電,市 電並聯。
DESIGN AND IMPLEMENTATION OF A HYBRID SOLAR-WIND POWER CONVERSION SYSTEM WITH ELECTRICAL ENERGY MANAGEMENT
Jonq-Chin Hwang1 Cheng-Hung Tsai2 Jui-Piao Yang2 Zong-Zhi Tsai1
1Department of Electrical Engineering National Taiwan University of Science and Technology
Taipei, Taiwan 106, R.O.C.
2Department of Electrical Engineering China University of Science and Technology
Taipei, Taiwan 115, R.O.C.
Key Words: maximum power point tracking (MPPT), three-phase three- level inverter, distributed generated system, isolated power supply, utility grid-connected.
ABSTRACT
A hybrid solar-wind power conversion system with energy manage- ment is designed and realized in this paper. This system adopts a dc-dc boost power converter as well as the perturb-and-observe algorithm for maximum power point tracking (MPPT) of solar and wind generation to
achieve the most effective use of renewable energy. In addition, the dc-dc buck-boost chopper is also proposed as battery regulation for system management, to improve the reliability of the system. In addition, a three-phase three-level inverter is implemented because of its superior harmonic quality. Furthermore, the proposed system can be operated ei- ther in a stand-alone fashion or connected with a utility grid to achieve a distributed generated system. A prototype 520 W hybrid power conver- sion system is realized to provide proper power in grid-connected opera- tion or 220 V, 60 Hz rated line-voltage for a stand-alone station. The ex- perimental results show the efficiency of the whole system is 83%. Fur- thermore, the total harmonic distortion of the line voltage is 2.7%, which meets IEEE Std. 519.
I. INTRODUCTION
In recent years, the active development in renewable energies, which include solar energy, and wind power, not only reduces the consumption of petroleum but also meets the general requirement of balancing environmental pro- tection and economic development [1-4]. Taiwan is an energy-importing nation with more than 97% of energy consumption supplied by imported fuels [5, 6]. However, systems based on either wind or solar energy are unreliable due to seasonal and diurnal variations of these resources, especially in Taiwan. Therefore, a system that is based fully on renewable resources, but, at the same time reliable, is necessary and a hybrid solar-wind power conversion system with battery bank meets these requirements [7, 8].
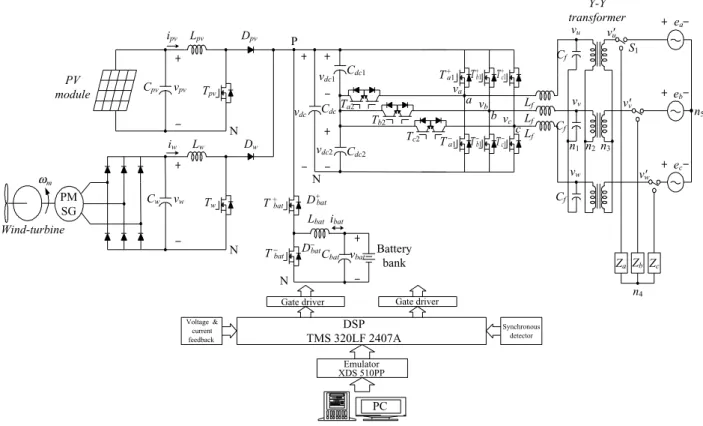
A block diagram of the proposed system is shown in Fig. 1. The wind energy conversion system incorporated in the proposed scheme consists of a wind turbine coupled to a permanent magnet synchronous generator (PMSG). An ac-dc power electronic interface with diode bridge rectifier and a dc-dc boost converter are used for maximum power point tracking (MPPT) and dc output regulation due to simple hardware and easy control. The perturb-and-ob- serve method is used to adjust the duty cycle of the boost converter to achieve the MPPT and output voltage regula- tion. The solar generation system consists of a dc-dc boost converter to deliver the output power of the solar panels and regulate the dc output voltage. The MPPT of the solar panels’ output power is also achieved by the application of the perturb-and-observe method. Furthermore, a manage- ment system is designed to manage the power flow be- tween the subsystem components in order to satisfy load requirements.
This paper is structured as follows. In Section II, analysis of the solar and wind generation system, control strategy analysis of the three-phase three-level inverter and
charging/discharging control of the battery regulation sys- tem are discussed. In Section III, the energy management technique is also discussed. Sections IV and V provide the experimental results and conclusions, respectively.
II. SYSTEM DESCRIPTION
The proposed system is composed of the following subsystems:
1. A 520 W solar and wind energy conversion system with MPPT strategy.
2. Three-phase three-level inverter.
3. DC buck-boost chopper.
1. The Solar and Wind Energy Conversion System with MPPT
The hybrid generation system consists of solar and wind energy generation in this paper. The circuit configu- ration of the solar and wind generation system is shown in Fig. 2 and Fig. 3, respectively. In the wind generation sys- tem, the primary machine is coupled to a permanent mag- net synchronous generator. Since the output of the dc link voltage is proportional to the speed of the generator, speed sensorless control is adopted [9]. An ac-dc power elec- tronic interface with diode bridge rectifier and a dc-dc boost converter are used to track and extract maximum power available from the wind energy system for a given wind velocity and deliver this power to a 48 V dc link. For the MPPT control, the perturb-and-observe method is used because of its simple structure and few parameters.
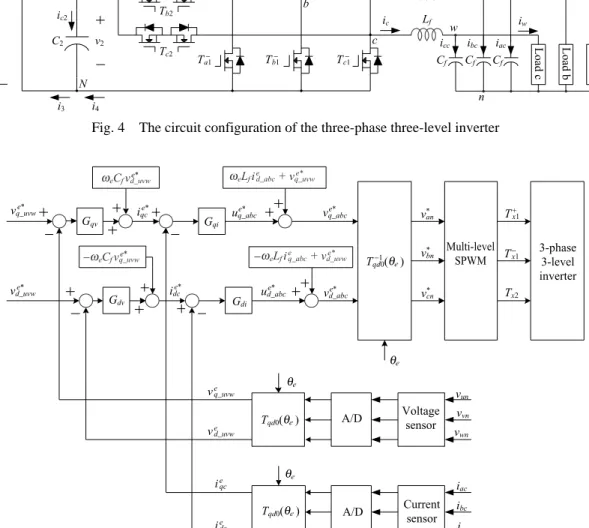
2. The Control Strategy of Three-Phase Three-Level Inverter
Fig. 4 shows the circuit configuration of the three- phase three-level inverter. It is used as an isolated power supply system when operating in voltage control mode
Gate driver Gate driver
Synchronous detector
Emulator XDS 510PP
PC DSP TMS 320LF 2407A
Voltage &
current feedback
Y-Y transformer
PV module
ωm
PM SG Wind-turbine
Battery bank N
N
N N
T−a1 T−b1 T−c1
T+a1 T+b1 T+c1
Ta2
Tb2
Tc2
Tpv
Tw
Lpv P
Lw
Lbat
Cpv
Cw
Dpv
Dw
Cbat
Cdc
Cdc1
Cdc2
Lf
Lf
Lf
Cf
Cf
Cf
eb
ec
vpv
vw
iw
ipv
ibat
vdc
vdc1
vdc2
vbat
va
vb
vc
vu
vv
vw
Za Zb Zc
ea
S1
v'u
v'v
v'w
D+bat
T+bat
D−bat
T−bat
a b
c
n1 n2n3
n4
n5
Fig. 1 The structure of the proposed solar-wind generation system
PV module vpv
ipv Lpv
Tpv
Dpv
Cdc Rdc vdc
idc
Fig. 2 The circuit configuration of the solar generation system
Cdc Rdc vdc
idc
eas
ebs
ecs
Ls
Ls
Ls
rs
rs
rs
ias
ibs
ics
Equivalent circuit of the PMSG
vw
iw
Tw
Lw Dw
s
vas
vbs
vcs
Fig. 3 The circuit configuration of the wind generation system
and used to connect with the utility grid when operating in current control mode.
i The Voltage Control Mode
The voltage and current dynamic equation of the in- ductor Lf and capacitor Cf as shown in Fig. 4 referenced to
the synchronous reference frame can be expressed as:
_
_ _ _ _
e q abc
e e e e
q abc q uvw f q abc f e f d abc
v v r i L di L i
dt ω
− = + + (1)
_
_ _ _ _
e d abc
e e e e
d abc d uvw f d abc f e f q abc
v v r i L di L i
dt ω
− = + − (2)
_
_ _ _
e q uvw
e e e
q abc q uvw f e f d uvw
i i C dv C v
dt ω
− = + (3)
_
_ _ _
e d uvw
e e e
d abc d uvw f e f q uvw
i i C dv C v
dt ω
− = − (4)
where the vde_abc and veq_abcare the output, d− and q− the axis voltage of the inverter, vde_uvw and vq uvwe_ are the d− and q− axis load terminal voltage, _
e d abc
i and iq abce_ are the output, d− and q− the axis currents of the inverter,
_ e d uvw
i and iq uvwe_ are the d− and q− axis load currents, rf is the equivalent resistor of the inductor and transformer.
Assume that the voltage commands of the load ter- minal are
*
* *
*
sin sin( 120 ) sin( 120 )
un e
vn m e
wn e
v t
v v t
v t
ω ω ω
⎡ ⎤ ⎡ ⎤
⎢ ⎥= ⎢ − °⎥
⎢ ⎥ ⎢ ⎥
⎢ ⎥ ⎢⎣ + °⎥⎦
⎣ ⎦
(5)
Lf
Lf
Lf
n T+c1
T+b1
T+a1
Tc1−
Tb1−
Ta1−
C1
C2
a
b
c g
Ta2
Tb2
Tc2
ia
ib
ic vdc
P
N i1
i3 i4 ig
v1
v2
i2
u
v
w
iu
iv
iw
Cf Cf Cf
iac
ibc
icc Load c Load b Load a
ic1
ic2
Fig. 4 The circuit configuration of the three-phase three-level inverter
veq_uvw
Gdi
Gqv
Gdv
Gqi
vq_abce*
ue*q_abc
ve*d_abc
ud_abce*
vun
vvn
vwn
ved_uvw
ieqc
iedc
iac
ibc
icc
T+x1
T−x1
Tx2
v*an
v*bn
v*cn
Multi-level SPWM
3-phase 3-level inverter
Voltage sensor A/D
A/D Current
sensor θe
θe
θe
Tqd0−1( )θe
Tqd0( )θe
Tqd0( )θe idce*
iqce*
vq_uvwe*
vd_uvwe*
eCfvd_uvw
ω e*
eCfvq_uvw
ω e*
_
eLfied_abc + vq_uvw
ω e*
eLfieq_abc + vd_uvw
ω e*
−
Fig. 5 The block diagram of the voltage control mode for three-level inverter
where v*m is the phase peak voltage command. The d − q axis of equ. (5) can be expressed in the synchronous ref- erence frame as:
* _
* *
_
* 0 _
0
0
e q uvw e
d uvw m
e uvw
v
v v
v
⎡ ⎤ ⎡ ⎤
⎢ ⎥ ⎢ ⎥=
⎢ ⎥ ⎢ ⎥
⎢ ⎥ ⎢ ⎥⎣ ⎦
⎣ ⎦
(6)
The current command of the capacitor can be ob- tained from equ. (3) and (4).
* * *
_ _ _
( )
e e e e
qc qv q uvw q uvw e f d uvw
i =G D v −v +ωC v (7)
* * *
_ _ _
( )
e e e e
dc dv d uvw d uvw e f q uvw
i =G D v −v −ωC v (8)
where “D” is the operator and the Gqv and Gdv are the PI control gains.
Then, the voltage equation of the inverter can be ob- tained in the following by equ. (1) and (2) ignoring the effect of rf :
* * *
_ ( ) _ _
e e e e e
q abc qi qc qc e f d abc q uvw
v =G D i −i +ωL i +v (9)
* * *
_ ( ) _ _
e e e e e
d abc di dc dc e f q abc d uvw
v =G D i −i −ω L i +v (10) The control block diagram of the decoupled equ. (9) and (10) is shown in Fig.5.
ii Current Control Mode
Assume that the capacitor Cf is small enough that the
vq_abce*
ue*q_abc
id_abce*
iq_abce*
vd_abce*
ud_abce*
Multi-level SPWM
Tx2
T−x1
T+x1
3-phase 3-level inverter v*an
v*bn
v*cn
GdiL
GqiL
ia
ib
ic
ieq_abc
ied_abc
Current sensor A/D
2 3
Qe*
vm
2 3
Pe*
vm
Pe*
Qe*
d-limiter q-limiter
Tqd0( )θe
θe
θe
Tqd0−1( )θe
im*2 = id_abce*2 + iq_abce*2
eLfiq_abce* + ved_uvw
ω
−
eLfid_abce* + veq_uvw
ω
Fig. 6 The block diagram of the current controller for three-level inverter
output instantaneous real and reactive power can be set as:
_ _ _ _
3( )
2
e e e e
e q uvw q uvw d uvw d uvw
p = v i +v i (11)
_ _ _ _
3( )
2
e e e e
e d uvw q uvw q uvw d uvw
q = v i −v i (12)
Because the ac current source is connected parallel to the voltage source, the peak voltage of the inverter is the same as the utility grid and can be expressed as:
_ _ e 0
q uvw e
m d uvw
v
v v
⎡ ⎤ ⎡ ⎤
=
⎢ ⎥ ⎢ ⎥
⎢ ⎥ ⎣ ⎦
⎣ ⎦ (13)
From equ. (13), (11) and (12), the following can be obtained:
_
3 2
e
e m d abc
p = v i (14)
_
3 2
e
e m q abc
q = v i (15)
According to the power command p*e and qe*, four power distribution states will be obtained. When p*e is positive, it means the inverter provides power to the utility grid. When p*e is negative, the power flow is the reverse.
When qe* is positive, it means the inverter will provide reactive power and when negative, the reverse.
The following equations can be derived from the equ.
(1) and (2) as the current controller of the inverter, ne- glecting the effect of rf :
* * *
_ ( _ _ ) _ _
e e e e e
q abc qiL q abc q abc e f d abc q uvw
v =G D i −i +ωL i +v (16)
* * *
_ ( _ _ ) _ _
e e e e e
d abc diL d abc d abc e f q abc d uvw
v =G D i −i −ωL i +v (17)
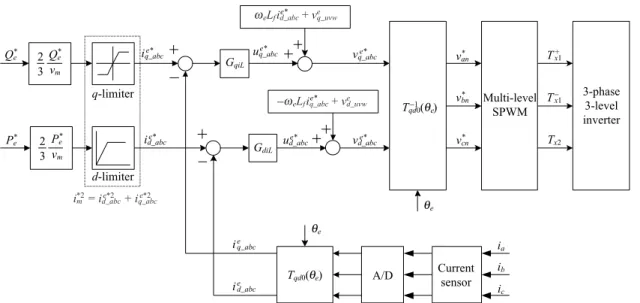
where the GqiL and GdiL are the PI current controller gains. From equ. (16) and (17), the current control mode of the d− and q− axis independent current con- troller can be obtained. As shown in Fig. 6, the power factor of the utility grid can be improved by reactive power compensation.
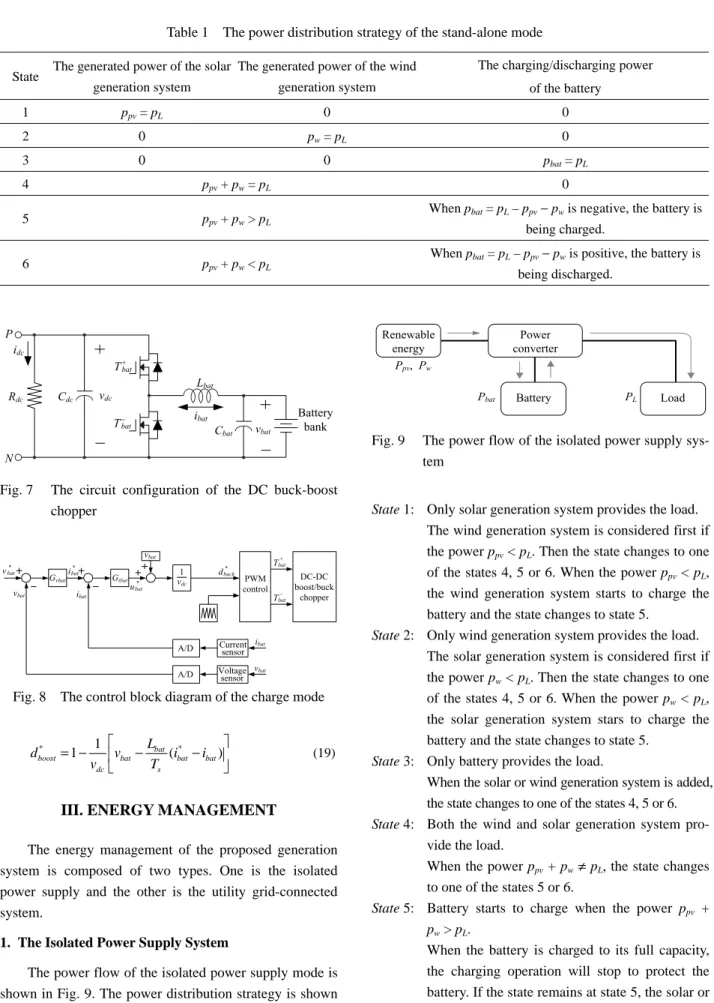
3. DC Buck-Boost Chopper
The circuit configuration of the dc buck-boost chop- per is shown in Fig.7. When the solar-wind generation system provides more power than the load demand, the chopper will operate in step-down voltage mode to charge the battery by Tbat+ on and Tbat− off. The charging current ibat can be also adjusted by the duty cycle dbuck of the switch Tbat+ . The control diagram of the battery charge mode is shown in Fig. 8. The command of duty cycle
*
dbuck for the switch Tbat+ can be expressed as:
* 1 *
( )
bat
buck bat bat bat
dc s
d v L i i
v T
⎡ ⎤
= ⎢ + − ⎥
⎣ ⎦ (18)
When the solar-wind generation system provides less power than the load demand, the chopper will operate in step-up voltage mode to discharge the battery by Tbat+ off and Tbat− on. Therefore, the command of duty cycle dboost* for the switch Tbat− can be expressed as:
Table 1 The power distribution strategy of the stand-alone mode
State The generated power of the solar generation system
The generated power of the wind generation system
The charging/discharging power of the battery
1 ppv = pL 0 0
2 0 pw = pL 0
3 0 0 pbat = pL
4 ppv + pw = pL 0
5 ppv + pw > pL
When pbat = pL – ppv− pw is negative, the battery is being charged.
6 ppv + pw < pL
When pbat = pL – ppv− pw is positive, the battery is being discharged.
N P
vdc
Cdc
Rdc
idc
T+bat
T−bat
Cbat
Lbat
Battery vbat bank
ibat
Fig. 7 The circuit configuration of the DC buck-boost chopper
Gvbat Gibat
vbat
1 vdc
Current sensor Voltage sensor
PWM control ibat
DC-DC boost/buck
chopper
A/D
A/D
ibat
vbat
vbat
T −bat
T +bat
d *buck
u *bat
v *bat i *bat
Fig. 8 The control block diagram of the charge mode
* 1 *
1 bat( )
boost bat bat bat
dc s
d v L i i
v T
⎡ ⎤
= − ⎢ − − ⎥
⎣ ⎦ (19)
III. ENERGY MANAGEMENT
The energy management of the proposed generation system is composed of two types. One is the isolated power supply and the other is the utility grid-connected system.
1. The Isolated Power Supply System
The power flow of the isolated power supply mode is shown in Fig. 9. The power distribution strategy is shown in Table 1 and described in the following.
Power converter Renewable
energy
Battery Load
Pbat PL
Ppv, Pw
Fig. 9 The power flow of the isolated power supply sys- tem
State 1: Only solar generation system provides the load.
The wind generation system is considered first if the power ppv < pL. Then the state changes to one of the states 4, 5 or 6. When the power ppv < pL, the wind generation system starts to charge the battery and the state changes to state 5.
State 2: Only wind generation system provides the load.
The solar generation system is considered first if the power pw < pL. Then the state changes to one of the states 4, 5 or 6. When the power pw < pL, the solar generation system stars to charge the battery and the state changes to state 5.
State 3: Only battery provides the load.
When the solar or wind generation system is added, the state changes to one of the states 4, 5 or 6.
State 4: Both the wind and solar generation system pro- vide the load.
When the power ppv + pw≠ pL, the state changes to one of the states 5 or 6.
State 5: Battery starts to charge when the power ppv + pw > pL.
When the battery is charged to its full capacity, the charging operation will stop to protect the battery. If the state remains at state 5, the solar or wind generation system is forced to turn off. The
Table 2 The power distribution in the grid-connected mode
State The generated power of the solar generation system
The generated power of the
wind generation system The utility grid-connected power
1 ppv=pL 0 0
2 0 pw=pL 0
3 0 0 pG=pL
4 ppv+pw=pL 0
5 ppv+pw>pL When pG=pL−ppv−pw is negative, the system provides power to the utility grid.
6 ppv+pw<pL When pG=pL−ppv−pw is positive, the utility grid provides power.
48 V The dc link bus voltage under energy balanced condition 50 V T −bat (off ) Stop discharging
46 V T +bat (off ) Stop charging 54 V The critical voltage from discharge to charge mode
42 V The critical voltage from charge to discharge mode Charging
range
Discharging range
DC bus link voltage
Fig. 10 The judge between dc bus voltage and battery charge/discharge operation
battery still provides the load. The state changes to 4 or 6.
State 6: The battery will discharge to supply power to the load when the power ppv + pw < pL.
The battery will stop discharging for the purpose of protection after the battery expends its final voltage. If the state remains at 6, the three-level inverter is forced to shut off and can not absorb power from the battery. The power generated from solar and wind will save to the battery when the load decreases. The state will change to 4 or 5.
As shown in Fig. 10, the dc bus voltage will increase due to the output power of the solar and wind generation system being more than the load demand. When the dc bus voltage approaches 50 V and the battery is discharging, the battery stops discharging. If the dc bus voltage increases to 54 V, the battery starts to charge. When the output power of the solar and wind generation system are less than the load demand, the dc bus voltage will decrease. After the dc bus voltage decreases to 46 V while the battery is being charged, the battery stops charging. When the dc bus volt- age decreases to 42 V, the battery starts to discharge.
2. Utility Grid-Connected System
Power converter Renewable
energy
Battery Load
Utility grid
Pbat PL
PG
Ppv, Pw
Fig. 11 The power flow of the utility grid-connected sys- tem
The power flow of the proposed system which is con- nected in parallel with the utility grid is shown in Fig. 11.
The strategy of power distribution for the proposed system is also shown in Table 2. The main function of the battery is to be an uninterruptible power system (UPS) for par- ticular facilities when the utility grid fails to operate. The system can be also viewed as a stand-alone system. The strategy for the energy balance is described in the follow- ing.
State 1: Only solar generation system provides the load.
The wind generation system is off and the utility grid doesn’t involve power distribution. The wind generation system is considered first if the power ppv < pL. Then the state changes to one of the states 4, 5 or 6. The wind generation system is operated and the extra power transfers to the utility grid if the power ppv > pL. The state changes to state 5.
State 2: Only wind generation system provides the load.
The solar generation system is off and the utility grid doesn’t involve power distribution. The so- lar generation system is considered first if the power pw < pL. Then the state changes to one of the states 4, 5 or 6. The solar generation system is operated and the extra power transfers to the utility grid. Then the state changes to state 5 if the power pw > pL.
State 3: When faults occur in the wind or the solar gen- eration system, the utility grid provides the load.
After the renewable energy generation system recovers, the state changes to one of the states 4, 5 or 6.
State 4: The solar and wind generation system provide the load. The state changes to one of the states 5 or 6 if the power ppv + pw≠ pL.
State 5: Due to the proposed system providing more power than the load requires, the extra power transfers to the utility grid. The utility grid can be viewed as an infinite load, so there is no need to consider providing too much power to the utility.
State 6: When the proposed system provides less power than the load requires, the utility grid provides the load. The utility grid can be viewed as an in- finite voltage source, so there is no need to con- sider providing insufficient power to the utility.
IV. EXPERIMENTAL RESULTS
The proposed system is implemented according to the Fig. 1. The system specifications and parameters are listed below.
● System specifications and parameters
Inverter output power : 520 W
DC link voltage command : 48 V
Open circuit voltage of the solar cell : 36~42 V Rectified output voltage of the wind turbine : 7.7~20.8 V The terminal voltage of the battery bank : 36 V Switching frequency of the power transistor : 10 kHz The boost inductance Lpv of the solar generation system
: 0.5 mH The capacitance Cpv of the solar generation system
: 1000 μF
The boost inductance Lw of the wind generation system : 0.5 mH The capacitance Cw of the wind generation system
: 1000 μF
Pole number of the wind generator : 8 The rated power of the wind generator : 340 W The rated current of the wind generator : 14 A The rated speed of the wind generator : 3000 rpm The inductance Lbat of the buck/boost chopper : 0.5 mH The capacitance Cbat of the buck/boost chopper
: 1000 μF
DC link capacitor Cdc, Cdc1, Cdc2 : 3300 μF Y-connected voltage ratio of the power transformer
(a) 0
90 540 450 360 270 180
Time (1s/div) Time (1s/div)
(b) -120
0 120 240 360 480 600 Pw (W)
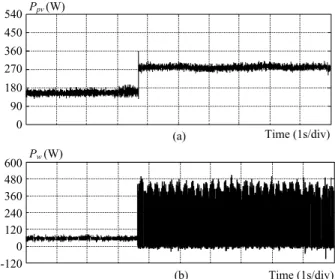
Ppv (W)
Fig. 12 The transient waveforms when the solar genera- tion system is operating in MPPT mode (a) The output power ppv of the solar cell (b) The output average power pw of the wind generation system
: 1:10
The filtered inductance Lf of the inverter output terminal : 0.5 mH The filtered capacitance Cf of the inverter output terminal
: 20 μF
● The specifications of the stand-alone mode
Peak output phase voltage : 180 V(max)
The frequency of the output phase voltage : 60 Hz
● The specifications of the grid-connected mode
The rated output current : 1.36 A(rms)
The utility line voltage : 220 V(rms)
Fig. 12(a) shows the transient responses of the MPPT for the solar generation system. From the figure, we can observe that the output power of the solar system without MPPT control is 150 W. When operating in MPPT mode, the output power is 280 W. As shown in Fig. 12(b), the output power of the wind generation system without MPPT control is 50 W. When operating in MPPT mode, the output average power is 120 W.
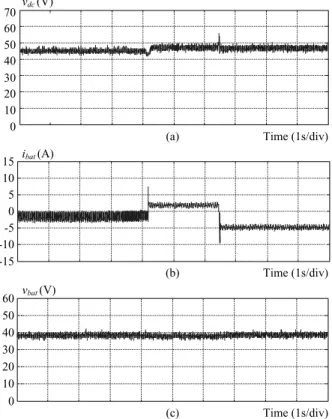
Fig. 13 shows the unfiltered line voltage waveforms and THD of the two-level and three-level inverter in steady state. As shown in the figure, the THD of the three-level inverter is less than the two-level. Fig. 14 shows the charge/discharge waveform of the battery with energy management when the load increases from 142 W to 265 W then decreases to 18 W while the maximum solar generation output power is 205 W. From Fig. 14(b), the charging current is 1.8 A when the load requires 142 W
-80 -60 -40 -20 0 20 40 60 80vab (V)
vab (V)
-80 -60 -40 -20 0 20 40 60 80
Time (4 ms/div) Time (4 ms/div)
(b) (a)
Mag. (% of Fundamental)
0 5 10 15 20 25 30
0 20 40 60 80 100
Harmonic order (c)
3 level THDv = 4.79%
2 level THDv = 5.79%
Fig. 13 The output voltage of the two-level and three- level inverter when the switching frequency is 10 kHz (a) The unfiltered output line voltage vab of the two-level inverter (b) The unfiltered output line voltage vab of the three-level inverter (c) The THD of the two-level and three-level inverter output voltage
and the solar generation output power is more than the load requires. The discharging current is 1.7 A when the load requires 265 W. The charging current is 5.2 A when the load requires 18 W and the solar generation output power is more than the load.
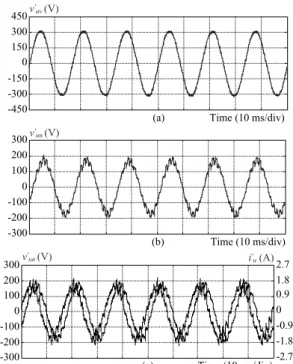
Fig. 15 shows the inverter output voltage waveform of balanced three-phase load 520 W when the system operates in stand-alone mode. From Fig. 15(a) to (c), the effective value of the line voltage is 220 V. In addition, the THD is 2.57% which meets IEEE Std. 519. Fig. 16 shows the tran- sient waveforms of the inverter output voltage and current while the balanced three-phase load is increasing from 347 W to 520 W while the system operates in stand-alone mode.
From the figure, we can observe that the dc link voltage reaches steady state quickly when the load varies. The in- verter output voltage will recover to the command value
vdc (V)
ibat (A)
vbat (V) 0 10 20 30 40 50 60 70
-15 -10 -5 0 5 10 15
(c) 0
10 20 30 40 50 60
Time (1s/div)
(b) Time (1s/div)
(a) Time (1s/div)
Fig. 14 The charging/discharging waveform of the battery when the solar generation system provides maxi- mum power 205 W and the load increases from 142 W to 265 W, then decreases to 18 W (a) The dc bus voltage vdc (b) The battery current ibat (c) The battery voltage vbat
after 1.5 cycles. When the peak load current varies from 1.27 A to 1.92 A, it takes only 3 cycle time.
Fig. 17 shows the transient waveforms of the inverter output voltage and current while providing real power 348 W and reactive power +320 VAR to utility grid while the system operates in grid-connected mode. From Fig. 17(a), the effective value of the line voltage is 217 V. Fig. 17(b) shows the peak phase voltage about 177 V. Fig. 17(c) shows the peak phase current about 1.78 A and the power factor about 0.737 and the THD about 10%. The above experimental results, indicate that the proposed system with energy management is feasible.
V. CONCLUSION
A prototype DSP implementation of the proposed hy- brid solar-wind generation system with energy manage- ment based on an MPPT controller has been designed and realized in this paper. A dc-dc boost converter with the perturb-and-observe algorithm is used to achieve maxi-
-450 -300 -150 0 150 300 450
(a)
-450 -300 -150 0 150 300 450
Time (10 ms/div) Time (10 ms/div)
Time (10 ms/div) (b)
-450 -300 -150 0 150 300 450
(c) v'uv (V)
v'vw (V)
v'wu (V)
Fig. 15 The steady state waveform of the inverter output voltage when system operates in stand-alone mode for balanced three-phase load 520 W (a) The line voltage vuv' (b) The line voltage vvw' (c) The line voltage vwu'
0 10 20 30 40 50 60 70
(a) Time (20 ms/div)
(b) Time (20 ms/div) -300
-200 -100 0 100 200 300
-4.2 -2.8 -1.4 0 1.4 2.8 4.2
(c) Time (20 ms/div) vdc (V)
v'un (V)
i'u (A)
Fig. 16 The transient waveforms of the inverter output voltage and current while the balanced three- phase load is increasing from 347 W to 520 W for the system operates in stand-alone mode (a) The dc bus voltage vdc (b) The u phase voltage v'un (c) The u phase current iu'
-450 -300 -150 0 150 300 450
(a) Time (10 ms/div)
-300 -200 -100 0 100 200 300
(b) Time (10 ms/div)
-300 -200 -100 0 100 200 300
(c) Time (10 ms/div)-2.7 -1.8 -0.9 0 0.9 1.8 i'u (A)2.7 v'un (V)
v'un (V) v'uv (V)
Fig. 17 The transient waveforms of the inverter output voltage and current while providing real power 348 W and reactive power +320 VAR to utility grid while the system operates in grid-connected mode (a) The line voltage vuv' (b) The phase voltage vun' (c) The phase current iu' leads the phase voltage vun'
mum power generation. In addition, the current and volt- age control mode of the three-level inverter is adopted to operate in stand-alone and utility grid-connected systems, respectively. Furthermore, the dc-dc buck-boost chopper with power reversal feature is also used to regulate the battery for different power distribution schemes to achieve energy balance. Finally, the experimental results verify the effectiveness and feasibility of the proposed control sys- tem.
ACKNOWLEDGEMENTS
This work was supported by the National Science Council of the Republic of China, under contract NSC 93-2213-E-011-009.
REFERENCES
1. Akkaya, R. and Kulaksiz, A. A., “A Microcontrol- ler-Based, Stand-Alone, Photovoltaic Power System for Residential Appliances,” Applied Energy, Vol. 78, No. 4, pp. 419-431 (2004).
2. Ghoneim, A. A., “Design Optimization of Photovoltaic Powered Water Pumping Systems,” Energy Conversion and Management, Vol. 47, No. 11-12, pp. 1449-1463 (2006).
3. Poullikkas, A., “Implementation of Distributed Gen- eration Technologies in Isolated Power Systems,” Re- newable and Sustainable Energy Reviews, Vol. 11, No.
1, pp. 30-56 (2007).
4. Han, S. G., Yu, I. K., and Park, M., “PSCAD/EMTDC- Based Simulation of Wind Power Generation System,”
Renewable Energy, Vol. 32, No. 1, pp. 105-117 (2007).
5. Tsai, W. T., Chou, Y. H., and Chang, Y. M., “Progress in Energy Utilization from Agrowastes in Taiwan,”
Renewable and Sustainable Energy Reviews, Vol. 8, No. 5, pp. 461-481 (2004).
6. Tsai, W. T. and Chou, Y. H., “An Overview of Renew- able Energy Utilization from Municipal Solid Waste (MSW) Incineration in Taiwan,” Renewable and Sus- tainable Energy Reviews, Vol. 10, No. 5, pp. 491-502 (2006).
7. Nehrir, M. H., LaMeres, B. J., Venkataramanan, G.,
Gerez, V., and Alvarado, L., “An Approach to Evaluate the General Performance of Stand-Alone Wind/Photo- voltaic Generating Systems,” IEEE Transactions on Energy Conversion, Vol. 15, No. 4, pp. 433-439 (2000).
8. Valenciaga, F., Puleston, P. F., and Battaiotto, P. E.,
“Power Control of a Solar/Wind Generation System without Wind Measurement: A Passivity/Sliding Mode Approach,” IEEE Transactions on Energy Conversion, Vol. 18, No. 4, pp. 501-507 (2003).
9. Tan, K. and Islam, S., “Optimum Control Strategies in Energy Conversion of PMSG Wind Turbine System without Mechanical Sensors,” IEEE Transactions on Energy Conversion, Vol. 19, No. 2, pp. 392-399 (2004).
Manuscript Received: April 07, 2008 First Revision Received: Feb. 03, 2009 Second Revision Received: June 17, 2009 and Accepted: June 18, 2009