科技部補助專題研究計畫報告
含電紡纖維之聚丙烯奈米複材製備與微結構鑑定(第3年)
報 告 類 別 : 成果報告 計 畫 類 別 : 個別型計畫 計 畫 編 號 : MOST 106-2221-E-006-210-MY3 執 行 期 間 : 108年08月01日至109年07月31日 執 行 單 位 : 國立成功大學化學工程學系(所) 計 畫 主 持 人 : 王紀 計畫參與人員: 碩士班研究生-兼任助理:盧傳曜 碩士班研究生-兼任助理:張晏賓 碩士班研究生-兼任助理:黃正傑 碩士班研究生-兼任助理:項揚 碩士班研究生-兼任助理:呂品賢 碩士班研究生-兼任助理:蔡孟慈 碩士班研究生-兼任助理:郭印川 報 告 附 件 : 出席國際學術會議心得報告本研究具有政策應用參考價值:■否 □是,建議提供機關
(勾選「是」者,請列舉建議可提供施政參考之業務主管機關)
本研究具影響公共利益之重大發現:□否 □是
中 華 民 國 109 年 10 月 15 日
中 文 摘 要 : 本三年計畫使用三種電紡纖維分散方法製備聚丙烯複材;(1)以傳統 單針電紡製程電紡取得奈米纖維膜,超音波震盪分散懸浮於水相中 的電紡纖維膜後,添加聚丙烯微粒,再經超音波分散快速共沉澱過 濾後得不同纖維含量的複材、(2)設計雙針電紡製程,同時電紡 PBT溶液與iPP溶液,使用電壓其中一針為正電壓、另一針為負,在 收集板上可得交錯的PBT纖維與iPP纖維,以此複合纖維膜為master batch添加入大量的iPP後可得複材,(3)設計同軸電紡製程,內管流 體為iPS溶液外管流體為iPP溶液,電紡可得芯鞘型iPS/iPP纖維膜 ,此芯鞘型纖維膜為master batch添加入大量的iPP後加熱混鍊冷卻 可得複材。主要學術成就有三項:(I)成功製備電紡纖維及其聚丙烯 複材。發現iPS纖維時可誘導聚丙烯形成beta晶體,纖維含量0.1 wt%可形成~55%的beta晶體,聚丙烯奈米複材beta晶體含量隨以下兩 條件而增加:降溫速率變大、等溫結晶溫度的下降。(II) 透過光強 度分析法分析電紡所得PET、PTT及PBT纖維誘發iPP形成穿晶之過程 ,可得知PBT纖維誘發iPP的成核能力遠優於其他兩種電紡纖維,成 核能力的順序依次為PBT>PET>PTT。(III) 使用PBT纖維時可大幅 提升iPP基材結晶溫度14-18oC,但只可誘導聚丙烯形成alpha晶體 ,無法形成beta晶體。 中 文 關 鍵 詞 : 奈米纖維、聚丙烯複材、 beta晶體、單針電紡、雙針電紡、同軸電 紡
英 文 摘 要 : Three approaches for the dispersion of electrospun fibers were attempted to prepare the iPP composites. (1) Using single-needle electrospinning to produce nonwoven fibers, followed by ultrasonic treatment of the aqueous suspension filled with nonwoven fabrics and iPP powders, (2) using double-needle electrospinning to obtain the nonwoven mixture of iPP and PBT fabrics, and (3) using coaxial electrospinning to obtain the core/shell iPS/iPP fibers, followed by micro-compounding to prepare the iPP
nanocomposites with desired compositions. Three main
achievements are obtained: (I) Based on the results of DSC, POM, SAXS and WAXD, we found that iPS fibers are good
nucleating agent to induce the beta -form iPP at the fiber surface. The amount of beta -form iPP crystallites is increased with by (1) increasing cooling rate from 200oC melt or (2) decreasing isothermal crystallization
temperature. (II) By measuring the transmitted light intensity under cross-polarized configuration, the induction temperature for the iPP crystallization was determined. We compared the nucleating ability of electrospun PET、PTT and PBT fibers that induced the
transcrystallization of iPP. The nucleating ability of PBT fibers was much better than the others. (III) PBT
nanofibers are excellent alpha-form nucleating agents for iPP matrix to elevate the crystallization temperature up to 14-18 oC, regardless of the cooling rate applied.
英 文 關 鍵 詞 : nanofibers, iPP nanocomposites, beta-form crystallites, one-needle electrospinning, double-needle electrospinning, coaxial electrospinning
科技部補助專題研究計畫成果報告
(□期中進度報告/■期末報告)
含電紡纖維之聚丙烯奈米複材製備與微結構鑑定
計畫類別:■個別型計畫 □整合型計畫
計畫編號:MOST 106 -2221-E-006-210-MY3
執行期間: 106 年 8 月 1 日至 109 年 7 月 31 日
執行機構及系所:
成功大學化工系
計畫主持人:
王紀
共同主持人:
計畫參與人員:盧傳耀、張晏賓、黃正傑、項揚、呂品賢、
蔡孟慈、郭印川
本計畫除繳交成果報告外,另含下列出國報告,共 _3_ 份:
□執行國際合作與移地研究心得報告
■出席國際學術會議心得報告
□出國參訪及考察心得報告
中 華 民 國 109 年 10 月 15 日
附件一本計畫第一年研究成果
Abstract:
This 1st year research mainly contains two parts. The first is the investigation of iPP
composited filled with electrospun iPS fibers, and the second is the study of iPP composites filled with electrospun PVA fibers. For a better dispersion of nanofibers in the iPP matrix, we tried to separate the individual fibers by using the ultrasonic treatment of the as-spun fibers in its non-solvent baths. Two different magnitudes of applied energy for ultrasonic treatment to study its effect on the fiber separation and the subsequent iPP composite performance.
At this stage, results of DSC, POM, SAXS and WAXD have been obtained. In general, we found that iPS fibers are good nucleating agent to induce the -form iPP at the fiber surface. The amount of -form iPP crystallites is increased with by (1) increasing cooling rate from 200oC melt, (2) decreasing isothermal crystallization
temperature, (3) increasing the sPS fiber content, but becoming saturated at filler content higher than 0.1 wt%. High energy ultrasonic treatment is not helpful to separate the individual fibers, and sometimes damage the fiber surface, leading the difficult for the fiber to induce transcrystallization of iPP matrix; this is seen for the PVA fibers, which lose the nucleating ability after ultrasonic treatment.
摘要
第一年研究探討以電紡絲方法製備 iPS 與 PVA 奈米纖維後,添加於 iPP 基材中 形成奈米複材,進而研究此複材的結晶與熱行為。為了將電紡所得纖維膜內相糾 纏的奈米纖維打開分散,本次實驗以超音波震盪含纖維膜的非溶劑懸浮液,了解 震盪能量對纖維膜分散性的影響。實驗發現過度震盪(震盪能量高時)纖維表面結 構受損影響其誘導聚丙烯結晶的能力。使用 iPS 纖維時可誘導聚丙烯形成晶 體,纖維含量 0.1 wt%可形成~55%的晶體, 聚丙烯奈米複材晶體含量隨以下 兩條件而增加,(1)降溫速率變大、(2)等溫結晶溫度的下降。若使用電紡所得 PVA 纖維製備複材時,聚丙烯結晶速率並沒有提升,意即電紡纖維失去了原有的成核 能力,可能的原因為超音波震盪將纖維表面的結構破壞,使其失去成核劑的功能。
Part I: Investigation of iPS fiber/iPP matrix nanocomposites
Two different methods (MA and MB methods) are used to prepare iPP nanocomposites filled with electrospun iPS fibers.
SEM image of iPS fibers after ultrasonic treatment in water bath by MA method.
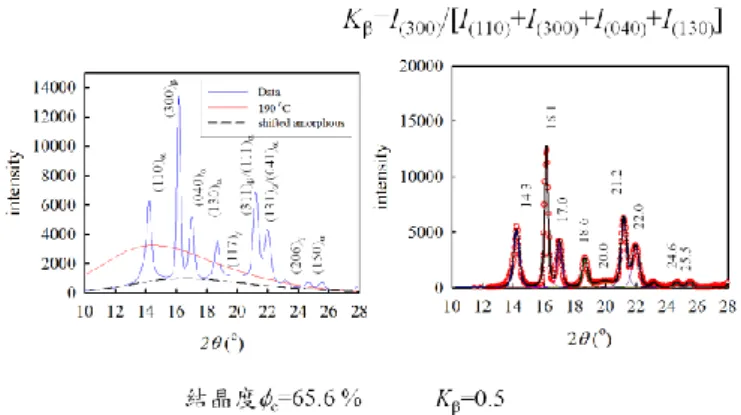
Figure 1. WAXD intensity profile of iPP nanocomposites filled with 0.1 wt% iPS
fibers (left), which are isothermally crystallized at 125oC. Right: peak separation of the crystalline reflections after subtraction from the amorphous halo (dashed line in the left figure). MA method is used for the composite preparation.
Table 1. Effects of sample preparation (MA, and MB) on the iPP crystallinity, -form, long period, lamellar thickness, amorphous layer thickness and linear crystallinity. Samples are isothermally crystallized at 125 oC.
Figure 2. WAXD intensity profile of iPP nanocomposites filled with 0.1 wt% iPS
fibers (left), which are dynamically crystallized at different rates from 200 to 25oC. MA method is used for the composite preparation. Right: cooling rate dependence of the sample crystallinity and the fraction of –form crystallites, K .
Table 2. Effects of sample preparation (MA, and MB) on the iPP crystallinity, -form, long period, lamellar thickness, amorphous layer thickness and linear crystallinity. Samples are dynamically crystallized from 200 to 25oC at different cooling rates.
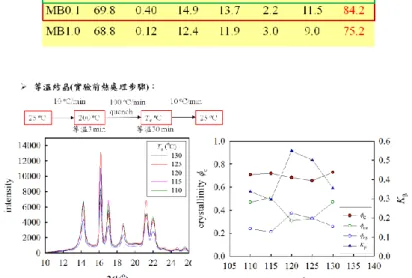
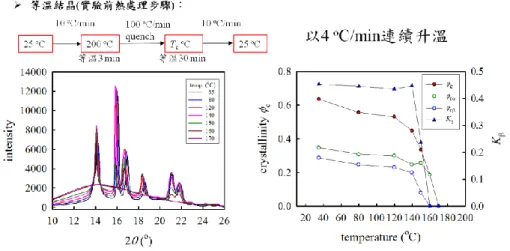
Figure 3. WAXD intensity profile of iPP nanocomposites filled with 0.1 wt% iPS
fibers (left), which are isothermally crystallized at different temperatures. Right: Crystallization temperature dependence of sample crystallinity and the fraction of
–form crystallites. MA method is used for the composites.
Figure 4. SAXS results of iPP composites filled with 0.1 wt% iPS fibers isothermally
crystallized at different temperatures. MA method is used for the sample preparation. Upper left: Iq2 versus q plot. Lower left: one-dimension correlation function. Right: Crystallization temperature dependence of long period (LB and Lc), lamellar thickness
Figure 5. WAXD intensity profiles of iPP nancomposites filled with 0.1 wt% iPS
fibers during 4oC/min heating at different temperatures.
Figure 6. SAXS intensity profiles of iPP nancomposites filled with 0.1 wt% iPS
fibers during 4oC/min heating at different temperatures.
Figure 7. Melting behavior of iPP nanocomposites filled with (a) 0, (b) 0.01, (c) 0.1
and (d) 1.0 wt% iPS fibers. Prior to 10 oC/min heating, the composites are dynamically crystallized from 200 to 110oC at different cooling rates (R). The cooling rate dependence of -form content is shown in (e).
結論
for iPP nanocomposites filled with electrospun iPS fibers
1. iPS 纖維具有晶型成核能力,MA0.1 複材經過 125 oC 等溫結晶或 60 oC/min 動態降溫之 K為 0.5,且其特徵長度 L B、Lc及 lc皆較純 iPP 多約 2.5 nm。 2. 法 MB 製備之複材,其特徵長度 LB、Lc及 lc與純 iPP 相比並無太大差異, 且相同纖維添加濃度之情況下,K較法 MA 更低。 3. 添加纖維濃度到 1.0 wt%並未能增加 K。(纖維添加濃度 0.1 wt%較佳) 4. MA0.1 複材,在熱處理條件為動態降溫時,降溫速率越快則 K越多。若 降溫速率為 60、20、5 oC/min 時其特徵長度 L B、Lc及 lc並無太大差異;降溫速 率為 2 oC/min 時可得較大之特徵長度 L B、Lc及 lc,多約 2.5 nm。 5. MA0.1 複材,在熱處理條件為等溫結晶時,複材在 120 oC 等溫結晶之 K 可達 0.55;在 125 oC 等溫結晶之 K亦有 0.5。但在 125 oC 等溫結晶之特徵長度 最大。Part II: Investigation of PVA fiber/iPP matrix nanocomposites
Two different methods are applied to prepare PVA/water solutions with different concentrations. The solution properties are measured and the electrospinnability of the as-prepared solutions are compared.
Method 1: PVA pellets are directly added into a hot DI water pre-heated at above
85oC, followed by strongly stirred for 4 hours, and then gradually cooled down to room temperature.
Method 2: PVA pellets are firstly added to DI water at room temperature, which is
strongly stirred. The whole system is gradually heated to 90oC, and maintained at 90oC for four hours, followed by gradually cooled to room temperature. Both methods provide transparent aqueous solutions of PVA. However, the solution properties and electrospinnability of as-prepared solutions are slightly different. This is due to the fact that the hydrolysis of our PVA is 98~99%, and the molecular weight is high (1.46x10⁵~1.86x10⁵ g/mol).
Figure 1. Images of Taylor cone and electrospinning jet during electrospinning of the
7 wt% PVA aqueous solutions prepared by different methods (Method 1 and Method 2).
Figure 2. 液柱看似斷掉頻率計算: 由影片中連續截圖數張圖,再計算液柱最接近
cone 的斷掉 40 次的張數,每張圖間隔 0.4 ms,即可知道斷掉 40 次所需時間,計 算頻率=40/時間。看似斷掉頻率= 30 -1750 Hz。
Figure 3. Determination of the travelling length of straight jet end. High speed
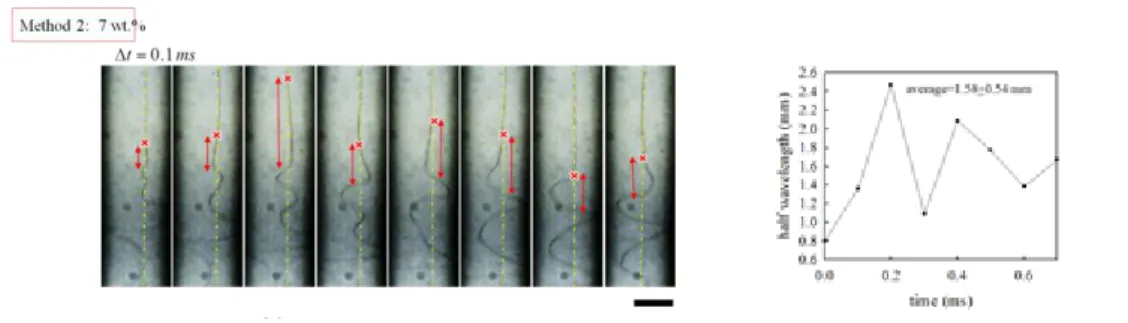
Figure 4. Determination of the wavelength during jet whipping. High speed camera
images.
Figure 5. Determination of the axial velocity and later velocity of the whipping wave.
Figure 6. SEM images and fiber diameter histogram of PVA nanofibers electrospun
from Method 2, and Method 1.
Figure 8. Preparation of iPP composites filled with electrospun PVA fibers.
Figure 9. OM observation of iPP nanocomposites filled with PVA nanofibers during
cooling 4oC/min from 200 to 30oC. Note: the PVA fibers loss its nucleating ability towards iPP crystallization after the ultrasonic treatments. It is attributed to the damage of the fiber surface after ultrasonic treatment.
Figure 10. DSC cooling curves (left) and subsequent heating curves (right) of neat
iPP and iPP nanocomposites filled with 0.1 wt% electrospun PVA nanofibers. Note: the PVA fibers loss its nucleating ability towards iPP crystallization after the ultrasonic treatments. It is attributed to the damage of the fiber surface after ultrasonic treatment.
結論
for PVA nanofibers and its iPP composites
1. 以 Method 2 與 Method 1 製備 PVA 水溶液所得 7 wt.%水溶液在 25 oC 下的黏
度分別為 370 與 680 cP。同為 Method 1 所得,7 與 9 wt.% PVA 水溶液的黏度 分別為 680 與 2180 cP。
2. 電紡不同配法的 7 和 9 wt.% PVA 水溶液皆可看到液柱有看似斷掉的過程以及 液柱中段有深淺變化,其中電紡 Method 1 製備所得 PVA 溶液看似斷掉頻率 是 Method 2 約 60 倍;同為 Method 1 製備所得 PVA 溶液的 9 wt.%看似斷掉 頻率略小於 7 wt.%。Method 2 製備所得 7 wt% PVA 溶液的深淺變化比 Method 1 明顯很多。 3. 觀察 Method 2 製備所得 7 wt.% PVA 水溶液液柱尾端上下移動頻率為 1110 Hz,第一波甩動的半波長為 1.58 mm,液柱尾端波縱向及橫向速度分別約為 5.57 m/s 及 1.83 m/s。 4. 乾平玻片收集電紡 Method 2 製備所得 7 wt.% PVA 水溶液的液柱,可以觀察 到少量有方向性以及大量沒方向性的液柱,AFM 觀察出具方向性的結構表面 高低落差較大。 5. 利用非溶劑正丙醇收集電紡 Method 2 製備所得 7 wt.% PVA 水溶液的液柱, 凹槽玻片及 silicon rubber spacer 玻片收集且在正丙醇未乾的情況下觀察,液 柱邊界有方向性,且內部有顆粒狀微結構;待正丙醇完全乾掉後,可以觀察 到液柱內部有線狀結構以及顆粒狀結構,且在 POM 下會亮。利用 AFM 觀察 液柱表面有 nodulars,波峰與波峰間距離為 209 nm。 6. PVA 纖維表面有規則鋸齒狀結構,寬度約 0.98 nm,且經過超音波震盪後, 可以觀察到有 necked 的結構,推測可能是液柱內相分離後產生的結構。PVA 纖維膜容易被經超音波震散分離,需用低功率震盪,避免震碎纖維,有沾黏 的纖維膜不利於震散。經超音波震盪完的纖維在正丙醇內沉降速度很慢,藉 由此因素,緩慢倒入 iPP,來達到纖維與 iPP 均勻混摻的效果。經超音波震盪 PVA 纖維不能誘導 iPP 穿晶,且此製作過程可能降低 iPP 的結晶能力。
本計畫第二年研究成果
1. 摘要第二年研究成果分為兩部分;第一部分以電紡法製備 PBT 奈米纖維,探討 加工變數對纖維直徑的影響。第二部分設計雙針(double needle)電紡製程,同時 電紡 PBT 溶液與 iPP 溶液,使用電壓其中一針為正電壓、另一針為負,在收集 板上可得交錯的 PBT 纖維與 iPP 纖維,以此複合纖維膜為 master batch 添加入大 量的 iPP 後可製備纖維分散均勻的聚丙烯複材;現階段已完成 DSC 量測非等溫 結晶動力與熔點、以 WAXD 探討熱處理條件對複材結晶度與晶型之影響。 第一部分使用 TFA 為溶劑以電紡法製備奈米直徑 PBT 纖維,探討電紡不同 黏度(o)溶液時,Taylor cone、液柱長度、液柱直徑(dj)及纖維直徑(df)的變化,透 過液柱直徑及纖維直徑對溶液黏度做全對數圖可得 scaling law 關係:dj~ o0.06與 df~ o0.73。相較於相同操作條件下電紡 PET 溶液,結果顯示在相同溶液黏度,電 紡 PBT 溶液所得液柱直徑較電紡 PET 溶液粗,但所得纖維直徑較細。以偏光顯 微鏡在全偏光模式下觀察電紡 PBT 所得纖維誘發 iPP 在纖維表面上形成穿晶之 過程,並分析其穿透光強度變化,藉由穿透光強度會隨晶核增加上升的關係,可 得晶核在纖維表面出現的初始溫度(Ti)。比較同為聚酯類高分子之 PET、PTT 及 PBT 纖維誘發 iPP 在纖維表面上之成核能力,結果顯示 PBT 纖維誘發 iPP 成核 能力遠優於其他兩種。 本研究第二部分以雙針電紡製程成功得到分散均勻 PBT/iPP 纖維,其中 PBT 纖維直徑為 271 nm、含量為58 wt%。使用 PBT 纖維時可大幅提升 iPP 基材結晶 溫度14-18oC,但只可誘導聚丙烯形成晶體,無法形成晶體。 關鍵字: PBT 奈米纖維、穿晶、聚丙烯複材、 晶體、雙針電紡 Abstract
Electrospun PBT nanofibers were prepared from a TFA-based solvent. The effects of solution viscosity (o) on Taylor cone, jet length, jet diameter (dj) and fiber
diameter (df) were investigated. The double-logarithmic plots of jet and fiber
diameters versus solution viscosity revealed that two scaling laws existed for the present solution, i.e., dj~ o0.06 and df~ o0.73. We compared the electrospinning of
PBT/TFA solutions with that of PET/TFA solutions under the same conditions. It showed that under the same solution viscosity, the jet diameter of PBT/TFA solution is larger than that of PET solution. However, the diameter of as-spun PBT fibers is smaller. Transcrystallization of iPP on the single PBT fiber was investigated by polarized optical microscopy. By measuring the transmitted light intensity under cross-polarized configuration, the induction temperature for the iPP crystallization was determined. We compared the nucleating ability of electrospun PET、PTT and PBT fibers that induced the transcrystallization of iPP. The nucleating ability of PBT fibers was much better than the others.
Double-needle electrospinning was performed to obtain the nonwoven mixture of iPP and PBT fabrics. In other words, simultaneous electrospinning of PBT/TFA solution and iPP/oDCB solution was carried out from two separate needles, at which one was subjected a positive voltage, but the other was subjected to a negative voltage. By means of this design, the mutual repulsion between the PBT fibers and iPP fibers, provided that the same polarity of applied voltage was applied, was resolved. The as-prepared nonwoven mixture of PBT and iPP fibers could be used as a master batch to prepare iPP nanocomposites filled with well-dispersed PBT nanofibers with a desired fiber content. At this stage, the as-spun PBT/iPP fibers were characterized to contain 58 wt% PBT fibers with an average PBT diameter of 271 nm. The as-spun fiber mixture was further characterized by DSC and WAXD to understand the non-isothermal crystallization kinetics and crystal modification developed. Our results showed that PBT nanofibers are excellent -form nucleating agents for iPP matrix to elevate the crystallization temperature up to 14-18 oC, regardless of the cooling rate applied.
Keywords: polybutylene terephthalate nanofiber, transcrystallization, iPP nanocomposites, -form crystallites, double-needle electrospinning
Part I: Solution concentration effect on the electrospun PBT fibers
2. 結果與討論
2.1常溫電紡 PBT/TFA 溶液製程
圖2-1為 PBT/TFA 與 PET/TFA 溶液黏度對體積分率作圖,PBT/TFA 溶液中 PBT 的含量的增加會使黏度增加,相同的體積分率時,PBT 溶液黏度比 PET 溶 液高;當 PBT 與 PET 溶液分別達到7.0 與10.5 wt%時為圖中直線轉折點,表示 高分子鏈在此濃度開始糾結,直線斜率分別為3.80與3.81;由分子鏈糾結濃度的 高低我們可以推測 PBT 的分子量較高。PBT/TFA 與 PET/TFA 溶液的導電度皆隨 著濃度的增加而降低,測量純 TFA 溶劑為2.90 S/cm。電紡製程的穩定操作電壓 與高分子溶液的黏度和流量有關,在此以 cone 的形狀與大小在5分鐘內不改變 定義為穩定電紡,不同濃度的 PBT/TFA 溶液的加工視窗,如圖2-2。由於 TFA 會 與空氣中的水氣反應進而影響電紡絲的製程,因此在電紡過程會持續給予氮氣 (流量為60 cc/min)避免 Taylor cone 與空氣中的水氣反應。當給予的電壓低於最低 可操作電壓時可觀察到 dripping mode,在超過最高可操作電壓時可觀察到 multi-jet mode;相同濃度下,使用越高的流量就必須有更高的操作電壓,選用相 同的操作參數如圖中星形標記的位置所示:V = 9.3 kV,Q = 1.0 mL/h,H = 14 cm, 氮氣流量 = 60 cc/min。
電紡不同濃度溶液所得 cone 高與液柱長如圖2-3與圖2-4所示,黏度的增加使 cone 高由0.83降至0.39 mm,Lj由7.67上升至20.11 mm。在電紡14 wt% 溶液所得 液柱影像,觀察到液柱下垂,推測原因為液柱太遠離針,電場力不夠支撐液柱重 量。收集電紡不同黏度溶液所得纖維於 SEM 下觀察,如圖2-5,纖維直徑隨著黏 度增加而有明顯的變粗,由354增加至1125 nm;分別量測電紡不同濃度溶液所得 液柱雷射繞射圖譜與繞射強度分布圖,peak 為繞射光第一亮峰位置對應的物理 意義為1.43/dj,所得液柱直徑並沒有固定趨勢,其值大約都在5 m 左右。將液柱 與纖維直徑對溶液黏度作圖,如圖2-6,發現 PBT 溶液黏度的改變對於液柱與纖 維直徑有一指數關係,dj~o0.06、df~o0.73,表示溶液黏度對於液柱直徑的影響很 小,對於纖維直徑影響較顯著,而電紡 PET 溶液系統所得溶液黏度對於液柱與 纖維直徑的指數關係為 dj~o0.06、df~o0.78。在相同的黏度時,電紡 PBT 溶液所 得液柱直徑較電紡 PET 溶液粗,而電紡 PBT 溶液所得纖維直徑較電紡 PET 溶液 細,推測其原因可能為 PBT/TFA 溶液的導電度高於 PET/TFA 溶液,因此在相同 的操作條件下得到較細的電紡纖維。且相同黏度下,PBT/TFA 溶液濃度較低, 電紡所得纖維較細。以上結果整理於表2-1,溶液黏度對於電紡製程的影響主要 在液柱長度與纖維直徑上,電紡高溶液黏度所得纖維會因液柱中所含的 PBT 比 例較多,溶劑揮發後自然就會有較粗的纖維,液柱長度則決定了 whipping 的位 置,越遠離針底則電場越小,故較長的液柱在 whipping 後拉伸的濃度也較小, 所以影響纖維直徑的原因是 whipping 位置的改變與液柱中高分子濃度不同。 2.2. 電紡溶液所得纖維性質 將電紡不同濃度溶液所得纖維膜於 DSC 中以10oC/min 升溫所得曲線如圖 2-7、表2-2所示,各纖維膜的熔化峰 (Tm) 在222 oC 附近。由文獻可知 PBT 的 完美結晶熱為 140.0 J/g,則經由 PBT 纖維膜之熔化熱可計算結晶度,電紡12 wt% PBT 溶液所得纖維膜之結晶度(DSC)最高。圖2-8為電紡10 wt% PBT 溶液所 得順向纖維膜在逐步升溫回火過程之 radial average 結果,在每個回火溫度 (Ta) 停留5分鐘收集訊號。隨 Ta由30 oC 增加到225 oC,晶體的繞射峰增強,透過布拉 格公式計算繞射平面間距。PBT 之晶體為 triclinic crystal,布拉格繞射峰及其對 應的平面間距出現在2 = 8.96o (001)、15.66o (
10
1
)、16.97 o (010)、20.27o (10
2
)、 22.96o (100),其中2 = 8.96o (001)在常溫時即存在,其他的繞射峰隨 T a增加越來 越明顯 ,240 oC 時晶體完全熔化。 2.3.探討電紡 PBT 纖維誘發聚丙烯在纖維表面形成穿晶能力 本研究中所使用的電紡纖維包含 PET、PTT 及 PBT 纖維,三種高分子同為 聚酯類,同時具有剛性的對亞苯基鏈和軟性的碳鏈,但三者的碳鏈長度不同,PET 纖維由本實驗室李明峰碩士論文中電紡20 wt% PET/TFA 溶液並在操作條件為電 壓10.0 kV、流量1.0 mL/h、工作距離14 cm 下所得;PTT 纖維由本實驗室鄭詠文碩士論文中電紡20 wt% PTT/TFA 溶液並在操作條件為電壓10.5 kV、流量1.0 mL/h、工作距離14 cm 下所得;PBT 纖維則由本次實驗電紡12 wt% PBT/TFA 溶 液並在操作條件為電壓9.3 kV、流量1.0 mL/h、工作距離14 cm,氮氣流量為60 cc/min 下所得。所得纖維以 SEM 拍攝纖維形態,可得直徑分布如圖2-9所示。纖 維的平均直徑約在600~800 nm 之間。將電紡纖維以10 oC/min 升溫可得圖2-10的 DSC 曲線,PET 纖維在升溫過程中於122.2 oC 有一冷結晶峰,在253.4 oC 有一熔 融峰;PTT 與 PBT 纖維的熔融峰相近,分別在224.1和222.4 oC,由文獻可知 PET、 PTT 及 PBT 完美結晶熱分別為135.0、145.6及140.0 J/g,將所得纖維結晶度(DSC) 連同 Tg、Tm整理於表2-3中。所有纖維在穿晶實驗中皆會升溫到200 oC,而由此 可知所有纖維皆未熔化。在以往許多穿晶研究的文獻中,常利用定溫時不同時間 下晶核出現的數量來比較成核能力的優劣,但這種分析方法容易受限於纖維太細 且晶核數量多時,無法準確觀察纖維表面的成核情況。於是本研究利用 POM 在 全偏光條件下,拍攝纖維產生穿晶的過程;在動態降溫過程中,晶核陸續出現造 成穿透樣品的光強度會逐漸上升,藉由軟體讀取不同溫度所攝照片的穿透光強度 變化對溫度做圖,即可決定出晶核出現的初始溫度。以此方法分析所得結果可能 會因選擇分析的範圍大小而有所差異。若分析範圍為整張照片,則會因纖維所佔 面積比例太少造成晶核出現時光強度的變化非常微弱,不夠靈敏,因此分析範圍 不宜太大。後續分析皆框選纖維附近某個範圍,且量測面積固定長寬為210 x 27 m2,如圖2-11中白色虛線框所示。另外不宜用所取範圍內光強度最大值的變化 來分析,此乃因背景若有擾動時而影響結果不同造成誤判,因此以穿透光強度平 均值之變化分析較為客觀。
圖2-11 (a)、(b)分別為降溫速率1、2 oC/min 下 PBT 纖維誘發 iPP 在纖維表
面形成穿晶之過程,當降溫速率增加時,初始成核溫度較低。且當畫面中晶體長 滿時,降溫速率愈快 iPP 穿晶層較薄,亦可說明開始成核溫度是較低的。利用穿 透光強度分析如圖2-12所示,得到不同降溫速率下的 Ti,將上述得到的 Ti對降溫 速率作圖,可得圖2-13,其中 PET 纖維誘發 iPP 在纖維表面形成穿晶的結果引用 自本實驗室吳怡君碩士論文,由此可知固定降溫速率下,纖維誘發 iPP 形成穿晶 的能力:PBT > PET > PTT,其中 PBT 纖維誘發 iPP 的成核能力遠優於其他兩者。 當降溫速率為0 oC/min 時可能代表達到平衡的狀態,所得到的 T i會是可形成穿晶 的最高溫度 (Tmax),當降溫速率大時,因受 CCD 拍攝解析度限制,每張照片拍 攝時間也較長,相對間隔的溫度差較大,無法得知光強度開始上升的準確溫度。 當降溫速率小時,CCD 拍攝照片溫度間隔會變小,能準確的偵測到不同溫度下 的光強度變化,因此將速率1、2及4 oC/min 的點作線性迴歸外插到降溫速率為0 oC/min 時,可得 PET、PTT 及 PBT 纖維誘發 iPP 形成穿晶的最高溫度分別為
表2-1、溶液黏度對電紡 PBT/TFA 溶液的影響。 表2-2、電紡不同濃度溶液所得PBT纖維於DSC之第一次升溫曲線之結果。 表3-3、電紡所得PET、PTT及PBT纖維直徑與熱性質比較。 圖2-1、PBT/TFA溶液黏度與體積分率之關係圖。[PET/TFA實驗結果引用自 本實驗室李明峰碩士論文] 圖2-2、電紡不同濃度PBT/TFA 溶液可操作電壓範圍對流量作圖。[實心符 號為最低可操作電壓,空心符號為最高可操作電壓,H = 14 cm,氮氣流量 = 60 cc/min]
圖2-3、電紡不同PBT/TFA濃度溶液所得cone高及液柱長的影像。 [Q = 1.0 mL/h,V = 9.3 kV,H = 14 cm,氮氣流量 = 60 cc/min] 圖2-4、不同PBT/TFA溶液黏度對Hc及Lj的影響。 圖2-5、電紡不同PBT/TFA濃度溶液所得纖維之SEM與其直徑分布圖。 圖2-6、電紡不同黏度之PBT/TFA溶液所得液柱直徑與纖維直徑關係圖。 [PET/TFA實驗結果引用自本實驗室李明峰碩士論文]
圖2-7、電紡不同濃度PBT/TFA溶液所得纖維膜以10 oC/min升溫之 DSC曲 線。 圖2-8、電紡10 wt% PBT/TFA溶液所得順向纖維膜逐步升溫2D-WAXD圖案 之繞射強度分布。 [radial average] 圖2-9、電紡PET、PTT及PBT溶液所得纖維形態與直徑分布圖。 圖2-10、PET、PTT及PBT電紡纖維膜第一次升溫所得DSC曲線。[插圖為局 部放大圖10 oC/min升溫]
圖2-11、不同降溫速率下,iPP在PBT纖維表面穿晶形成過程(a)1, (b)2 oC/min。 圖2-12、不同降溫速率下,iPP在PBT纖維表面形成穿晶過程之光強度變化 圖。 圖2-13、不同降溫速率下,iPP在電紡所得PET、PTT及PBT纖維表面形成穿 晶過程所得Ti對降溫速率做圖。[PET纖維實驗結果引用自本實驗室吳怡君碩 士論文].
結論
常溫電紡 PBT/TFA 溶液製程 1. 改變 PBT/TFA 溶液濃度可以有效控制 cone、液柱與纖維形態,其關係為: dj~o0.06、df~o0.73。 2. 相同的溶液濃度下,PBT/TFA 溶液黏度與導電度較 PET/TFA 溶液高。相同 溶液黏度下,PBT/TFA 溶液濃度較低,電紡 PBT 溶液所得纖維較電紡所得 PET 纖維細,液柱直徑則相反。 temperature (oC) 125 130 135 140 145 150 int ensi ty of transmi tt ed li ght ( a .u .) 0 1 2 4 7 10 cooling ratePET、PTT 及 PBT 電紡纖維誘導 iPP 在纖維表面形成穿晶
1. 降溫速率越快,iPP 在電紡纖維上的成核起始溫度 Ti越低。
2. 透過光強度分析法分析 PET、PTT 及 PBT 電紡纖維誘發 iPP 在纖維表面 上形成穿晶之過程,可得知 PBT 誘發 iPP 的成核能力遠優於其他兩種電 紡纖維,成核能力的順序依次為 PBT>PET>PTT。
Part II: Preparation of PBT/iPP nanocomposites by double-needle
electrospinning and its non-isothermal crystallization studies
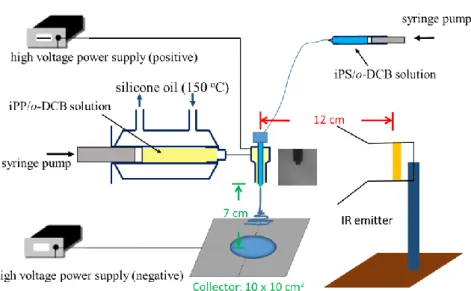
Figure 1 shows the schematics of the electrospinning setup for collecting the
PBT/iPP fibers by using two spinnerets to simultaneously spin the PBT/TFA solution and the iPP/o-DCB solution. Since iPP cannot dissolve in o-DCB at room temperature, high temperature electrospinning should be applied to avoid the clogging of the spin-line at the Taylor cone. Thus, a heating jacket with the circulating silicone oil at a temperature of ca. 130 oC was used to maintain the iPP/o-DCB solution at a temperature sufficiently higher than the gel temperature of the solution. The temperature of the Taylor cone was measured to be 69.5 oC. The concentrations of the iPP/o-DCB solution and PBT/TFA solution were 8 and 10 wt%, respectively. A continuous process for electrospinning was reached by using the applied voltages of 8.3 and 10.3 kV for the iPP solution and PBT solution, respectively, at a fixed tip-to-collector distance of 7 cm for both solutions. By controlling the flow rate, the compositions of the PBT/iPP fibers on the collector can be determined. In this preliminary study, we applied the flow rates of 1 mL/h for both solutions, and the fiber composition was theoretically derived to be PBT/iPP= 58.3/41.7.
In order to obtain a uniform dispersion of PBT fibers in the iPP fibers, a rotating long rod with a diameter of 1.012 cm was used a grounded collector during electrospinning. The rotation speed of the rod was controlled to be 500 rpm, giving rise to a fiber collecting speed of 26.5 cm/s. To be a meaningful comparison, single electrospinning of the iPP/o-DCB solution was first performed to obtain the random iPP fiber membranes on the rod collectors. After changing the rod collector, single electrospinning of the PBT/TFA solution was followed to obtain the neat PBT fiber membranes. Afterwards, co-electrospinning of the iPP solution and PBT solution was conducted to receive the PBT/iPP fiber membranes for comparison. Figure 2 shows the SEM images of neat iPP, neat PBT and PBT/iPP fibers collected in this manner. Based on the statistical analyses of 500 measurements, PBT fibers with an average diameter of 271 nm can be produced at a tip-to-collector distance (H) of 7 cm. On the other hand, slightly wet iPP fibers are produced at H= 7 cm; the average width was
1531 nm. For the PBT/iPP fibers, the average width is ca. 1157 nm.
Figure 3 shows the cooling curves of the (a) neat iPP and (b) PBT/iPP fibers at
different rates after holding at 200 oC for 3 min. At 200 oC, the iPP fibers were completely melted but the PBT fibers remained intact since the melting temperatures of iPP fiber and PBT fibers were 160, and 222 oC, respectively. During cooling, iPP underwent the melt crystallization so that an exothermic peak was detected. The peak temperature (Tc) and crystallization enthalpy (Hc) were measured; the corresponding
values are plotted as a function of cooling rate (R), as shown in Figures 4 and 5, respectively. It is found that Tc decreases with increasing R for both neat iPP and
PBT/iPP fibers. With adding PBT fibers in the iPP matrix, the Tc is about 14 oC higher
than that of the neat iPP fibers, regardless of the cooling rate applied. It indicates that the presence of the PBT fibers can enhance the crystallization of iPP. Since the content of iPP in the blend fibers was reduced, compared to the neat iPP sample, the value of Hc was decreased. Provided that the values of Hc were used to calculate
the iPP content, the weight percentage of iPP in the blend sample is ca. 56%, which is higher than the theoretical calculated value of 42 wt%.
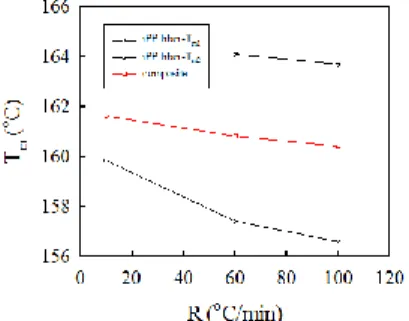
Figure 6 shows the melting curves at a heating rate of 10 oC/min for the (a) neat iPP fibers and (b) PBT/iPP fibers after cooling from 200 oC at different R. For the neat iPP fibers, two melting peaks are observed for samples cooled at high cooling rate; they are denoted by Tm1, and Tm2, respectively. Double melting behavior of iPP is
often reported in the literature; they are attributed to the melting of the subsidiary (daughter) lamellae and the main (mother) lamellae since only -form iPP is detected by WAXD. For the PBT/iPP fibers, single melting peak is observed regardless of the cooling rate applied. The melting enthalpy (Hm) was also determined for comparison
to reveal the effect of cooling rate. The cooling rate dependence of Tm and Hm for
the neat iPP and PBT/iPP fibers are shown in Figures 7 and 8, respectively. For the blend fibers, the melting temperature of the iPP component is in between Tm1 and Tm2
of the neat iPP fibers at a fixed cooling rate of R. Provided that the values of Hm
were used to calculate the iPP content, the weight percentage of iPP in the blend sample is ca. 57%.
To reveal the effect of PBT fibers on the developed crystal modification of iPP, WAXD experiments were carried out on the PBT/iPP fibers; the 2D WAXD pattern is shown in Figure 9. Also included are the 2D WAXD patterns of the neat iPP fibers and neat PBT fibers; they are all crystallized at a cooling rate of 60 oC/min from 200
oC after being held for 3 min. Figure 10 shows the radial averaged intensity profiles
for the neat iPP, neat PBT and PBT/iPP fibers. After peak separation, the ratio of the integrated area of the crystalline reflections to the total reflection area was determined to represent the sample crystallinity. The derived crystallinity for the neat iPP and neat
PBT fibers are 48.8% and 58.1%, respectively. It is important to note that only -form iPP is detected in the PBT/iPP fibers; it implies that PBT only induces the -form iPP at its fiber surface. In other words, PBT fibers can act as a good -form nucleating agent for iPP matrix.
Figure 1. Schematics of co-electrospinning setup used to prepare PBT/iPP fiber mixtures for the subsequent crystallization study. The rotating roller is used to attain a good dispersion of PBT fibers and iPP fibers. The angle between the two spinnerets is 120 o.
Figure 2. SEM images of the as-spun fibers and the corresponding histogram of fiber diameter distribution, (a) PBT fibers, (b) iPP fibers, and (c) PBT/iPP fibers.
Figure 3. DSC cooling curves of (a) iPP fiber, (b) PBT/iPP fibers at different cooling rates R after being held at 200 oC for 3 min.
Figure 4. Effect of cooling rate on the crystallization temperature Tc.
Figure 5. Effect of cooling rate on the crystallization enthalpy Hc.
Figure 6. DSC heating traces of (a) neat iPP fibers and (b) PBT/iPP fibers after nonisothermal crystallization at different cooling rates R. The heating rate is 10
oC/min.
Figure 7. Effect of cooling rate on the melting temperature Tm.
Figure 8. Effect of cooling rate on the melting enthalpy Hm.
Figure 9. 2D WAXD patterns of the (a) neat PBT fibers, (b) neat iPP fibers, and (c) PBT/iPP fibers after a cooling rate of 60 oC/min from 200 oC.
Figure 10. WAXD intensity profiles of the neat iPP, neat PBT, and PBT/iPP fibers after a cooling rate of 60 oC/min from 200 oC.
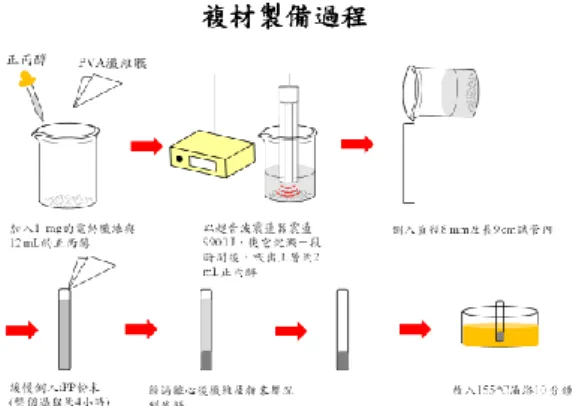
本計畫第三年研究成果
Master batch of core/shell iPS/iPP fibers prepared from electrospinning Preparation of shell solution: 1 wt% iPP/o-DCB
1. 將油浴槽預熱 120 oC、高溫烘箱 100 oC、循環油浴槽 150 oC。 2. 加熱套管與漏斗於高溫烘箱內 100 oC 預熱。
3. 依序以重量百分比秤量 iPP、o-DCB、Bu4NClO4 ,放入 sample 瓶內。
4. 將磁攪拌子加入 sample 瓶,放入油浴加熱 30 min,呈現均勻一相後,將溶 液由漏斗放入套管、推桿推入擠出空氣。
5. 將裝有溶液之套管(1)放上木架、(2)接上油管、固定位置、(3)油管通入熱油(準 備夾子輕夾套管,以免套管掉落)。
Preparation of core solution: 12 wt% iPS/o-DCB
1. 油浴槽預熱至 160 oC。
2. 以重量百分比秤量 iPS、o-DCB、Bu4NClO4 。
3. 依序將 iPS、o-DCB、Bu4NClO4 放入 25 mL 錐形瓶內。
4. 將磁攪拌子加入錐形瓶,冷凝回流 5 hr。
5. 室溫下靜置 30 min 後,倒入針筒內以進行後續實驗。
Electrospinning process and parameters
Tip-to collector distance H: 7 cm
Flow rate Q: (core solution) 12 wt% iPS/o-DCB 1.0 mL/h (shell solution) 1 wt% iPP/o-DCB 0.5 mL/h Applied voltage at the spinneret V: (top) 15.7 kV
Applied voltage at the collector: (bottom) -1.0 kV IR emitter:溫度設定= 700 oC, 與針距離= 12 cm
The schematics of the coaxial electrospinning is shown in Figure 1. It is noted that the temperature control of the iPP solution is the most important factor for this coaxial electrospinning experiment. This is because that iPP cannot be dissolved in o-DCB solvent at room temperature. Elevated temperatures at ca. 100 oC is generally required to dissolve the iPP powders to form a one-phase solution. Depending upon the iPP concentration, the one-phase solution will form either gel or precipitates as the solution temperature is gradually reduced. The higher the iPP concentration in the solution, the lower the temperature at which the one-phase solution undergoes phase transition. This transition temperature is important according to our DSC study (Figure 2). To avoid the interruption of electrospinning during long time experiments (ca. 8 hrs), we chose the 1 wt% iPP/o-DCB solution as our model solution for electrospinning; this is because the transition temperature is a little high at ~70 oC so that our present setup can provide the sufficiently high temperature by heating jacket and IR emitter to ensure the continuous process for
obtaining the core/shell fibers iPS/iPP. The circulating silicone oil is maintained at 150 oC to avoid the precipitation (gel) of the iPP/o-DCB solution during processing. Prior to electrospinning, it is important to obtain the gel (precipitating) temperature of the iPP/o-DCB solution. To this end, DSC cooling traces of iPP solutions with various concentrations from 100oC to 30oC are shown in Figure 2 (left), with different cooling rates. For the 8 wt% iPP solution cooled at a rate of 20 oC/min, an exothermic peak associated with the gelation is seen at ~68oC. As the cooling rate is reduced, the gel temperature is gradually increased. The melting temperature of the gels developed at different cooling rates is determined from the DSC melting traces at a constant heating rate of 10 oC/min, as shown in the right figure. It is noted that the melting temperature of the gel is significantly higher than the gel temperature. Moreover, the melting temperature of the gel is increased with decreasing rate of cooling. To determine the thermodynamic gel temperature, the plot of Tgel versus
cooling rate is shown in Figure 3. The thermodynamic gel temperature Tgel,0 is
obtained from the extrapolation of Tgel to the zero cooling rate. Moreover, the
exothermic enthalpy associated with the gelation during solution cooling is also recorded and is normalized with the iPP content to derive the H’gel, which is the
indicator the amount of iPP involved in the gelation (precipitation). These values are displayed in Table 1. As expected, as the iPP content is decreased from 8 to 5 wt%, more iPP gel content evolves at a lower temperature of ~71oC. Thus, in order to perform the electrospinning of 1 wt% iPP solution, a solution temperature of 70 oC is sufficient to prevent the clogging phenomenon at the needle spinneret.
SEM images of the collected fibers are shown in Figure 4, and its fiber diameter distribution is also displaced from the measurement of 500 fibers. As can be seen that the obtained fibers are not perfect since some spherical particles are still seen; it implies the difficulty for a continuous electrospinning for 8 hr in order to obtain a sufficient amount (~ 1 gram) of master-batched fibers for later compounding to prepare the iPP composites. Nevertheless, the majority of the core/shell fibers are round fibers with an average diameter of 228 65 nm.
Since the concentrations and flow rates of the core solution of iPS and shell solution of iPP are known, the composition of the cire/shell fibers is estimated to be 90.86 wt% of the iPS. Thus, this fiber member containing high amount of iPS fiber is used as a master batch to prepare the composites by using a microcompounder (Figure 5) to proceed the melt blending. The advantage of the melt blending is the intensive high shear stresses induced in the compounder through twin-screw extruder so that the entangled iPS fibers can be separated each other to disperse more uniformly in the iPP melt matrix.
We can envision that the shell component of iPP is completely miscible with the melt matrix of iPP. Thus it is easier for the iPP chains in the melt matrix to diffuse into the gap in between the core/shell fibers to facilitate better dispersion of iPS in the iPP matrix in this manner via the intensive shear mixing in the microcompounder. The processing parameters for the melt blending are: 180 oC for 2 min mixing with a rotating screw of 100 rpm. The iPP composites filled with 0, 0.1, 0.5, 1, and 5 wt% iPS fibers are prepared as shown in Figure 6 for further investigation.
Effects of cooling rate on the -form formation in the iPP composites
Samples filled with different concentrations (0, 0.1, 0.5, 1.0 and 5.0 wt%) of iPS fibers were cooled from 200 °C to 30 °C at different cooling rates R, followed immediately by heating trace at 10 °C/min. Figure 7 shows the DSC cooling traces of the neat iPP (left) at different cooling rates of 1, 2, 5, 10 and 20 oC/min, and the subsequent heating traces at a heating rate of 10 oC/min (right). At a high cooling rate of 20 oC/min, the crystallization temperature is ~110 oC, and the two melting temperatures are observed at 158 and 164 oC, respectively. As the cooling is decreased, the crystallization temperature is increased and the only one melting temperature is detected. It implies that more perfect iPP crystals are developed at a low cooling rate and its melting temperature is increased to high temperature.
In contrast, the iPP composites filled with 5 wt% iPS fiber exhibit different behavior as shown in Figure 8, whereas the DSC cooling curves at different cooling rate is displayed in the left, and the corresponding melting curves of the crystallized samples are shown in the right. Compared with the neat iPP in Figure 7, the crystallization curves of iPP composites during cooling is not much different, whereas the melting curves exhibit four melting peaks. It implies that the presence of iPS fibers in the iPP matrix significantly alters the crystalline structures of iPP due to transcrystallization. To reveal the effect of iPS fiber on the crystallization kinetics of iPP, the cooling curves of composites are shown in Figure 9 at a rate of 5 oC/min in the left and at 20 oC/min in the left, respectively. They all show that addition of 0.1 and 0.5 wt% iPS fiber apparently retards the crystallization of iPP matrix, compared to the neat iPP sample. A higher content of iPS fibers (1 and 5 wt%) may lead to less retardation of iPP crystallization. It seems that in the composites the presence of iPS fibers reduces the rate of dynamic (nonisothermal) crystallization of iPP regardless of the fiber content. However, the benefit of fiber addition in the composites is the formation of -form crystals of iPP, which possess a higher toughness than the -form crystals.
iPS fibers. For the neat iPP cooled at 20 °C/min, the melting endotherm exhibited two melting peaks at 156.9 °C and 162.8 °C; the double melting behavior is associated with the -form crystals because only the -related crystalline reflections are detected by WAXD. The peak temperatures are denoted by Tm1, for the lower endotherm and by Tm2, for the higher endotherm. With decreasing R, Tm1, shifts to a higher temperature, but Tm2, gradually disappears. These results indicate that
Tm1, is related to the melting of the originally crystallized iPP, and Tm2, is associated with the melting of reorganized/recrystallized iPP after partial crystal melting.
The iPP composite containing 5 wt% iPS fibers exhibites four apparent melting peaks after dynamically crystallized at 20 oC/min. WAXD intensity profile demonstrated the coexistence of - and -related reflections so that mixed / crystals were developed. On this basis, the melting peaks are denoted Tm1,, Tm2,,
Tm1, and Tm2, from low to high temperatures. For the 20 °C/min-cooled composites, the values Tm1,, Tm2,, Tm1, and Tm2, are 143.8, 150.6, 158.6, and 163.9 °C, respectively. When subjected to a lower cooling rate (10 and 5 oC/min), Tm1,, Tm2,
and Tm1, shift to higher temperatures, whereas Tm2, remains unchanged. At a cooling rate of 1 °C/min, the melting peak of Tm1, became pronounced and that of
Tm2, disappears. More importantly, at T < Tm1,, a broad plateau with a small wavy peak for the Tm1, was observed. Similar trends can be observed for the iPP containing 0.5 and 1.0 wt% iPS fibers. The double melting of the -form is also related to the reorganization/recrystallization of the originally-crystallized -phase after partial crystal melting.
For further verification, the melting behavior of the 20 °C/min-cooled composites was directly observed under polarized optical microscopy (POM) to confirm this phenomenon. The corresponding POM images at 130 °C and 155 °C before and after
-crystal melting are examined. Highly birefringent -form crystals are evidently identified at T < Tm1, prior to crystal melting. At Tm1, < T < Tm2,, the remaining
-form crystals remain space-filling and exhibit a reduced birefringence. At higher temperatures of Tm2, < T < Tm1,, all the -form crystals disappear to form amorphous dark regions, and the less birefringent -form iPP remained. These POM images clearly demonstrate that two -form crystallites with different birefringence/ perfection were produced during non-isothermal crystallization. Moreover, the -to- crystal transformation during heating was not observed. Thus, the endotherm shown in Figure 10 involves the respective melting of both the - and -form with different crystal perfections.
The content of -form crystals developed in the composite can be strictly derived provided that the complex melting endotherm can be reasonably deconvoluted to account for the phase transitions. For a qualitative comparison, a rough estimate of
the melting enthalpy associated with the -form crystals ΔH was carried out by simple integration of the melting curve above the baseline. In addition, WAXD curves for samples crystallized at different cooling rates also indicate that the content of b-for crystals is increased with increasing iPS-fiber content, which is consistent with the DSC results.
Conclusion:
1. Core/shell iPS/iPP nenofibers have been successfully obtained from the coaxial electrospinning by carefully adjusting the processing parameters, especially the solution temperature of iPP to avoid its precipitation.
2. Using the core/shell fibers as the master batch, iPP composites with different iPS- fiber concentrations (0.1, 0.5, 1 and 5 wt%) are readily prepared by melt blending via microcompounder.
3. Electrospun iPS fibers are found to be dual-nucleating agent for iPP to produce both the and phases.
4. Given their high specific surface area, electrospun fibers with submicron diameters are ideal candidates as good NG and reinforced filler for the semicrystalline polymers, such as iPP, used in this work. Electrospun iPS fibers are dual-NG for iPP to produce both and phases. The relative proportions of - and -phases depend on the cooling rate. The -form content increases with increasing cooling rates.
Figure 1. Experimental setup used for the coaxial electrospinning of the iPP/o-DCB
solution (shell, yellow) and iPS/o-DCB solution (core, blue color) to prepare the core/shell iPS/iPP nnaofibers. To avoid the precipitation of iPP/o-DCB solution, a heating jacket with circulating silicone oil at 150 oC is applied to keep the solution at
high temperature. Due to the fin-effect of the spinneret, the temperature drop of the iPP solution during flow from the bath to the needle tip is significant so that additional IR emitter is required to maintain the environmental temperature at high temperature of 70 oC, to avoid the solution clogging at the needle end to interrupt the electrospinning. The distance between the IR emitter and the spinneret is about 12 cm and the temperature setting for the IR emitter is 700 oC. By these parameters, continuous electrospinning is feasibly performed for hours to prepare the core/shell iPS/iPP fibers on the collector. It is noted that to control the flight of the charged jet (fibers) the collector is connected to a negative potential, which is in contrast with the spinneret connected by the positive potential. By controlling the concentrations of iPP (s) and iPS (c) solutions and the flowrates of the core solution (Qc) and the shell
solution (Qs), the composition of the collected fibers can be obtained.
Figure 2. Determination of the gel (precipitation) temperature Tgel of the 8 wt%
iPP/o-DCB solution at different cooling rates (left), and the subsequent heating traces at a rate of 10 oC/min to determine the melting temperature of the iPP gel (right).
Figure 3. Plot of Tgel versus cooling rate and the extrapolated temperature at a zero
cooling rate gives the thermodynamic gel temperature (left), and the plot of exothermic enthalpy during gel formation versus cooling rate (right).
Table 1. Thermal properties of iPP/o-DCB solution measured from the DSC curves.
Note: addition of salt is necessary for electrospinning in order to increase the solution conductivity, otherwise the neat iPP/o-DCB solution is not feasibly electrospun since the electric conductivity is too low. Hgel is the measured value, while H’gel is
obtained by normalization with the iPP weight content. It is also noted that the melting temperature Tm,gel of the developed gel during cooling is much higher than the
gel temperature Tgel.
Figure 4. SEM images of the as-spun core/shell iPS/iPP fibers and the histogram of
the fiber diameter distribution.
Figure 5. Microcompounder (Xplore MC-15) used to prepare the iPP composites
filled with different concentration of iPS nanofibers (0, 0.1, 0.5, 1, 5 wt%) by mixing the appropriate amount of master batch obtained from the coaxial electrospinning and the excess amount of raw iPP powders. The capacity of the microcompounder is 填料
容量:5 ~ 15 mL, 最高升溫:400 oC, 預熱 20~240 oC 約 20 min, 螺桿轉速:5 ~
250 rpm).
Figure 6. iPP composites with iPS fiber concentration of 0, 0.1, 0.5, 1 and 5 wt% are
prepared after melt blending via microcompounder.
Figure 7. DSC tracing curves of neat iPP during cooling from melt at 200 oC at different cooling rates (left), and the subsequent heating from 30 oC at a constant heating rate of 10 oC/min (right).
Figure 8. M DSC tracing curves of iPP composites filled with 5 wt% iPS fibers
during cooling from melt at 200 oC at different cooling rates (left), and the subsequent heating from 30 oC at a constant heating rate of 10 oC/min (right).
Figure 9. DSC cooling curves of iPP composites filled with different amounts of iPS
fibers during cooling from melt at 200 oC at a constant cooling rates of 5 oC/min and 20 oC/min (right).
Figure 10. DSC melting curves with a heating rate of 10 oC/min for iPP composites filled with different amounts of iPS fibers after cooling with different rates (-1, -2, -5, -10 and -20 oC/min) from 200 oC melt.
科技部補助專題研究計畫出席國際學術會議心得報告
日期:2019 年 7 月 25 日因 COVID19 疫情,本年度(第三年)沒有出國開會,國外差
旅費經費已依學校程序,流用至相關研究設備費。
計畫編號
MOST 106 -2221-E-006-210-MY3
計畫名稱
含電紡纖維之聚丙烯奈米複材製備與微結構鑑定
出國人員
姓名
王紀
服務機構
及職稱
成功大學化工系
會議時間
會議地點
會議名稱
(中文)
(英文)
發表題目
(中文)
(英文)
附件六106年度專題研究計畫成果彙整表
計畫主持人:王紀 計畫編號:106-2221-E-006-210-MY3 計畫名稱:含電紡纖維之聚丙烯奈米複材製備與微結構鑑定 成果項目 量化 單位 質化 (說明:各成果項目請附佐證資料或細 項說明,如期刊名稱、年份、卷期、起 訖頁數、證號...等) 國 內 學術性論文 期刊論文 0 篇 研討會論文 4 參加國內研討會 專書 0 本 專書論文 0 章 技術報告 0 篇 其他 0 篇 國 外 學術性論文 期刊論文 4 篇(1)Macromolecular Materials and Engineering 2019, 304, 1900281. (2) Polymer 2019, 176, 236 - 243. (3) Macromolecules 2020, 53, 7876 -7886. (4) Macromolecules 2020, October, in press。 研討會論文 4 參加國際研討會 專書 0 本 專書論文 0 章 技術報告 0 篇 其他 0 篇 參 與 計 畫 人 力 本國籍 大專生 0 人次 碩士生 7 盧傳耀、張晏賓、黃正傑、項揚、呂品 賢、蔡孟慈、郭印川 博士生 0 博士級研究人員 0 專任人員 0 非本國籍 大專生 0 碩士生 0 博士生 0 博士級研究人員 0 專任人員 0 其他成果 (無法以量化表達之成果如辦理學術活動 、獲得獎項、重要國際合作、研究成果國 際影響力及其他協助產業技術發展之具體 效益事項等,請以文字敘述填列。)